The pivotal element in animal ag air pollution is nitrogen (N). Large quantities of excess nitrogen turn into ammonia – the primary air pollutant from animal agriculture.[1]
Nitrogen emissions are at the center of the most damaging environmental impacts of animal ag and the most critical issues facing the world today, including biodiversity loss, climate change, water pollution, and ocean deoxygenation.[2,3]
Liu, L., et al., (2022). Exploring global changes in agricultural ammonia emissions and their contribution to nitrogen deposition since 1980. PNAS, 119(14), e2121998119, p. 1. [“Nr compounds (reactive nitrogen) in the atmosphere are mainly controlled by the emissions of nitrogen oxides (NOx) and ammonia (NH3); NOx is mainly from the burning of fossil fuels for energy production and NH3 is mostly from agricultural sources including volatilized livestock waste and nitrogen (N)-based fertilizers.”]
Erisman, J. W., et al., (2013). Consequences of human modification of the global nitrogen cycle. Philosophical Transactions of the Royal Society B: Biological Sciences, 368(1621), 20130116. [“Many thresholds for human and ecosystem health have been exceeded owing to Nr (reactive nitrogen) pollution, including those for drinking water (nitrates), air quality (smog, particulate matter, ground-level ozone), freshwater eutrophication, biodiversity loss, stratospheric ozone depletion, climate change and coastal ecosystems (dead zones).” Abstract]
For more information on biodiversity loss: see, Fertilizer Harm to Biodiversity; climate change: see, Animal Ag GHG Emissions; water pollution: see, Nutrient Pollution of Waterways
Of the 9 identified “planetary boundaries,” nitrogen flows (i.e., nitrogen released into the environment) are the most definitively transgressed, potentially threatening “the resilience of the earth system.”[1,2]
While the impacts of escaped nitrogen do not receive close to the share of attention given to climate change, some researchers are asking, “Is nitrogen the next carbon?”[3] Others are pleading for a full reckoning of the damages, saying, “Many are aware of nitrogen as one of the most transgressed ‘planetary boundaries’. What is less widely understood is that nitrogen also affects the exceedance of all of the other planetary boundaries.”[4]
Globally, nitrogen-related emissions (into air and water) from livestock production “represents about one-third of global human-induced N emissions.”[5]
The impacts of nitrogen air and water pollution on the U.S. population and environment are wide-ranging.[6,7]
Steffen, W., et al., (2015). Planetary boundaries: Guiding human development on a changing planet. Science, 347(6223), 1259855.
Richardson, K., et al., (2023). Earth beyond six of nine planetary boundaries. Science advances, 9(37), eadh2458. [6 boundaries identified as “transgressed.” Proposed annual boundary of 62 Tg N is currently overshot by ~3 times.]
Battye, W., et al., (2017). Is nitrogen the next carbon? Earth’s future, 5(9), 894-904.
Sutton, M. A., et al., (2021). The nitrogen decade: mobilizing global action on nitrogen to 2030 and beyond. One Earth, 4(1), 10-14. p. 10. [“By massively increasing the supply of nitrogen compounds, humans are worsening air and water quality, contributing to climate change and stratospheric ozone depletion, and thereby threatening health, biodiversity, and livelihoods.”]
Uwizeye, A., et al., (2020). Nitrogen emissions along global livestock supply chains. Nature Food, 1(7), 437-446, p. 438.
Sobota, D. J., et al. (2015). Cost of reactive nitrogen release from human activities to the environment in the United States. Environmental Research Letters, 10(2), 025006, Table A1.
U.S. EPA (2011) Reactive Nitrogen in the United States: An Analysis of Inputs, Flows, Consequences, and Management Options, A Report of the EPA Science Advisory Board, Table ES-1.
Reactive nitrogen (Nr) includes any nitrogen compound on earth that is not N2, the nitrogen that makes up ~78% of the air.[1] Nitrogen in the air (N2) is considered inert; nitrogen in any other form is highly reactive and combines with other elements and gases to create a variety of compounds.
Once the Haber-Bosch process was invented, nitrogen could be taken out of the air and used for other purposes, mostly for chemical fertilizer. The nitrogen in chemical fertilizer is the main reason that crop yields have increased many times over since pre-industrial days and human populations have soared.[2] Reactive nitrogen is also created by nitrogen-fixing crops, primarily soybeans and alfalfa/hay.[3]
Once reactive nitrogen is created, it is hard to put back in the box.[4] Although some reactive nitrogen is temporarily incorporated into plant or animal biomass, it can often escape again on destructive paths.[5]
Davidson, E. A., et al., (2011). Excess nitrogen in the US environment: trends, risks, and solutions. Issues in ecology, (15). Glossary, p. 14. [“Reactive nitrogen. All forms of N other than N2.”]
U.S. EPA (2011) Reactive Nitrogen in the United States: An Analysis of Inputs, Flows, Consequences, and Management Options, A Report of the EPA Science Advisory Board, p. ES-1. [“Without the creation of N fertilizer by an industrial process (the Haber-Bosch process) and the increased cultivation of leguminous crops, the world could not support the current human population or its projected increase.”]
Davidson, E. A., et al., (2011), p.3. [“Soybean production has been increasing, which increases biological nitrogen fixation in croplands.”]
Liu, L., et al., (2022). Exploring global changes in agricultural ammonia emissions and their contribution to nitrogen deposition since 1980. PNAS, 119(14), e2121998119, p. 1. [“Our analyses of Nr have shifted from how to increase food production to a realization that agricultural intensification adds excess Nr that damages environmental systems and degrades human health.”]
Houlton, B. Z., et al., (2013). Intentional versus unintentional nitrogen use in the United States: trends, efficiency and implications. Biogeochemistry, 114, 11-23. [“Eventually all of the N2 fixed (intentionally or unintentionally) will affect the environment, and so even Nr incorporated into products has long-term effects.”]
A single newly created reactive nitrogen atom released into the environment can go through many transformations over time, causing damage over and over in different ecosystems, moving from air to water to soil and back to air or water again. This is called the nitrogen cascade.[1,2]
As the EPA notes, “most N used in food production, and all of the new Nr produced by fossil fuel combustion, is lost to the environment where it circulates through the earth’s atmosphere, hydrosphere, geosphere, and biosphere. During this circulation, Nr contributes to a wide variety of consequences, which are magnified with time as Nr moves through the environment.”[3]
Galloway, J. N., et al., (2003). The nitrogen cascade. Bioscience, 53(4), 341-356. [“The same atom of Nr can cause multiple effects in the atmosphere, in terrestrial ecosystems, in freshwater and marine systems, and on human health. We call this sequence of effects the nitrogen cascade.” Abstract]
U.S. EPA (2011) Reactive Nitrogen in the United States: An Analysis of Inputs, Flows, Consequences, and Management Options, A Report of the EPA Science Advisory Board, p. 4. [“Unlike other element-based pollution problems, the N cascade links the negative impacts, where one N-containing molecule can in sequence contribute to all the environmental issues mentioned above.”]
U.S. EPA (2011) Reactive Nitrogen in the United States, p. ES-1.
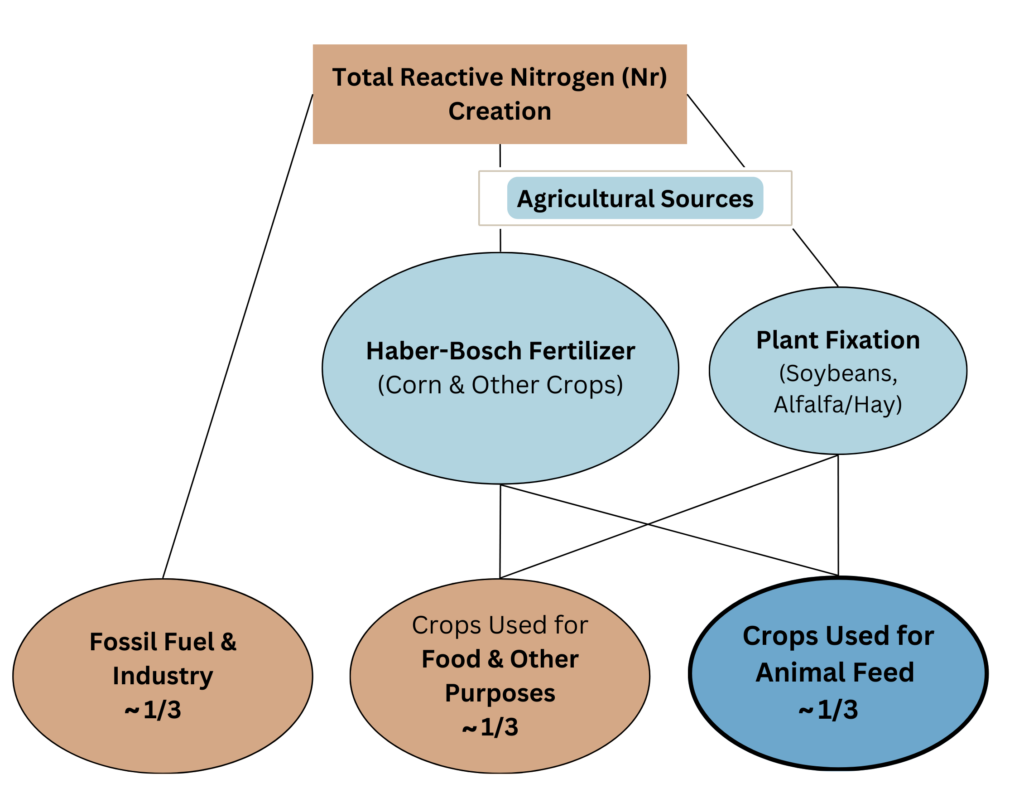
Very broadly estimated, about a third of newly created anthropogenic reactive nitrogen comes from production of crops specifically used for animal feed.
In the U.S., about two-thirds of the newly created anthropogenic reactive nitrogen comes from agricultural production.[1-3]
The 2 largest sources are nitrogen created for chemical fertilizers and nitrogen created by the fixation process of legumes.[4]
About half of all nitrogen in chemical fertilizers is used on corn and soybeans.[5] Soybeans and other nitrogen fixing crops are mostly used for feed.[6,7]
We broadly estimate about a third of the total reactive nitrogen creation is attributable specifically to animal ag.[8]
Davidson, E. A., et al., (2011). Excess nitrogen in the US environment: trends, risks, and solutions. Issues in ecology, (15), Table 1. [19.7 MMT N/ 28.8 MMT = 69% agricultural]
Sobota, D. J., et al., (2013). Reactive nitrogen inputs to US lands and waterways: how certain are we about sources and fluxes? Frontiers in Ecology and the Environment, 11(2), 82-90, Table 2. [18.6 MMT N/ 26.9 MMT= 69% agricultural]
U.S. EPA (2011) Reactive Nitrogen in the United States: An Analysis of Inputs, Flows, Consequences, and Management Options, A Report of the EPA Science Advisory Board, p. ES-5. [Report estimates ~61% from agricultural sources. Calculation: (9.8 Tg N + 7.7) / 28.5 = 61.4%. See Figure ES-2, and Page 17 which uses 9.8 Tg N for “crops” versus 10.9 Tg N for “fertilizer use on farms and non-farms.”]
Sobota, D. J., et al., (2013), Table 2. [“Across the conterminous US, synthetic N fertilizer and C-BNF were the largest and second-largest overall human-mediated N sources by HUC8 and at the national scale (figure 2).” at p. 5]
See, Chemical Fertilizer Use on Feed Crops
U.S. EPA (2011) Reactive Nitrogen in the United States, p. ES-5. [Of 7.7MMT from fixation, ~99% is from crops used primarily for feed. See Table 1, p. 12.]
Davidson, E. A., et al., (2011), Table 1. [About 40% of newly created Nr is from nitrogen fixing crops. 8.3MMT N/ 19.7 MMT = 42%. The other 58% is from chemical fertilizer]
Note: This is likely a conservative estimate, based on harvested corn, soybeans, wheat, sorghum, & barley. (Pasture, silage and other forage crops are also fertilized.) Corn and soybeans use about half of all nitrogen, while soybeans and hay are responsible for almost all crop fixation. The multi-step calculation (a broad estimate based on somewhat dated materials): Ag sources = ~67%. Of that ~60% is from Haber Bosch. Corn and soybeans use ~50% of total N from chemical fertilizers. About 64% of corn is specifically for animal feed. Therefore .67 * .6 *.5 *.64 = ~13% from chemical fertilizers. About 40% of ag sources are from fixation. About 80% is from crops specifically used for animal feed. (See EPA 2011 Table 1 – using 58% of soy for animal feed and all pasture, hay and alfalfa for animal feed.) Therefore .67 * .4 * .8 = ~21%. Finally, 13% plus 21% = 34% or about one-third. For estimate of 58% of soy for animal feed see, Share of Soybean Crop for Feed. For estimate of 64% of corn used for animal feed see, Share of Corn Crop for Feed
Analyses vary, though broadly estimated, about a third of the nitrogen applied to feed crops escapes into the environment during the crop production cycle.[1-4]
Hellerstein, D., et al., USDA, Economic Research Service (2019) Agricultural Resources and Environmental Indicators, 2019, Bulletin 208, p. 45. [In 2015 corn lost 24% of applied N to the environment. In 2011 soybeans lost 54%.]
Davidson, E. A., et al., (2011). Excess nitrogen in the US environment: trends, risks, and solutions. Issues in ecology, (15), p. 1. [“Approximately half of all nitrogen applied to boost agricultural production escapes its intended use and is lost to the environment.”]
Zhang, X., et al., (2015). Managing nitrogen for sustainable development. Nature, 528(7580), 51-59, Table 1. [32% nitrogen loss in 2010 for “USA and Canada”]
Gu, B., et al., (2023). Cost-effective mitigation of nitrogen pollution from global croplands. Nature, 613(7942), 77-84, p. 77. [Globally, “more than half of these N inputs to croplands are lost to air and water…”]
Broadly estimated, ~70% of the nitrogen (N) that is taken up in feed crops and then consumed by farmed animals goes unutilized and is excreted in manure.[1,2]
Davidson, E. A., et al., (2011). Excess nitrogen in the US environment: trends, risks, and solutions. Issues in ecology, (15), p. 10. [“Most livestock only utilize about 30% of the nitrogen in their feed; the rest is excreted in manure (feces and urine).”]
Rotz, C. A. (2004). Management to reduce nitrogen losses in animal production. Journal of animal science, 82 (suppl_13), E119-E137, pp. E120-E121. [Utilization: dairy 20 to 30%, feedlot beef 10%, pigs and poultry 30 to 40%.]
Broadly estimated, about 10% of the total manure nitrogen (N) from factory farms is applied to crops. The great majority of nitrogen in factory farm manure escapes into the environment.
Perhaps about a third of the nitrogen in factory farm manure escapes into the environment within hours or days after excretion.[1] After further losses into water, soil, and air during manure storage and transfers, a very small share of nitrogen (N) is eventually applied to crops.
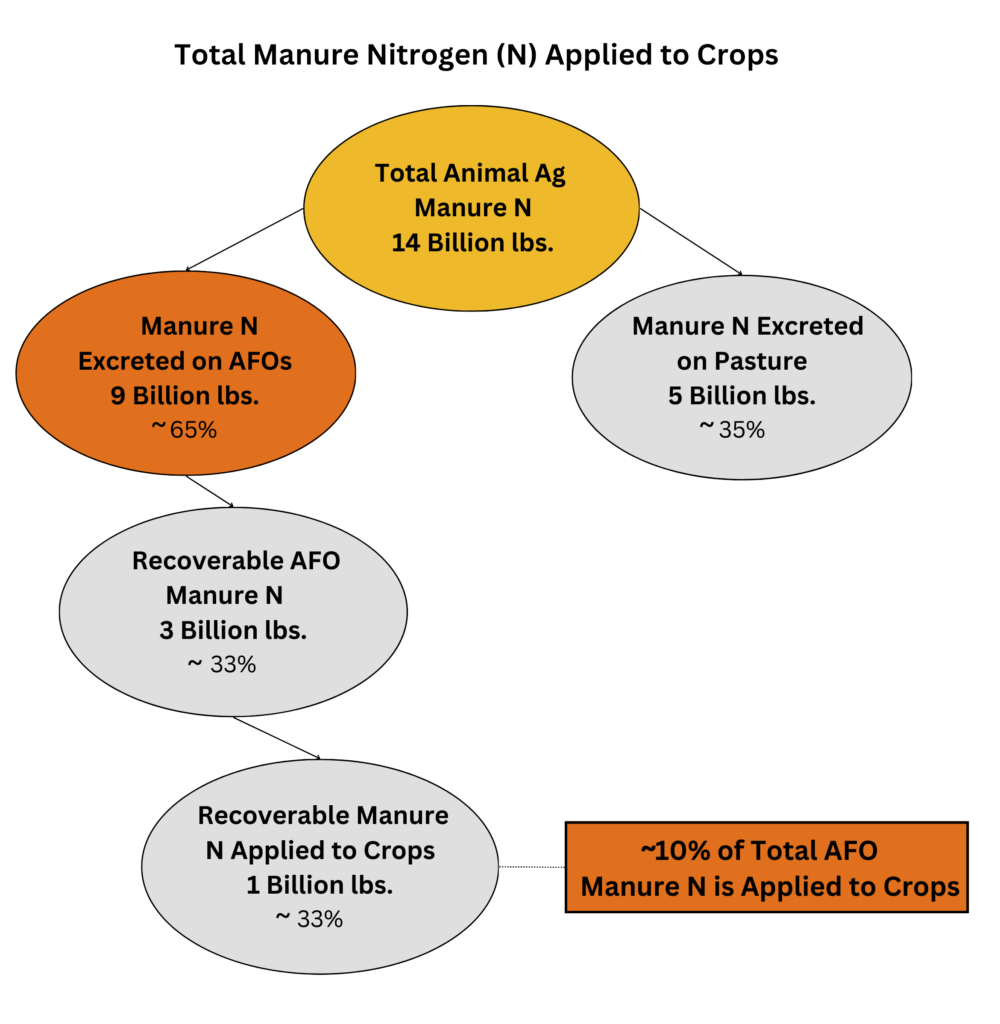
The figures are as follows:![]() The EPA estimates that ~14 billion lbs. of manure nitrogen (N) were generated in 2017 from all animal agriculture.[2]
The EPA estimates that ~14 billion lbs. of manure nitrogen (N) were generated in 2017 from all animal agriculture.[2]![]() About 65%, or 9 billion lbs., was from factory farms, with the rest generated by animals that were not confined (mostly grazing cattle).[3,4]
About 65%, or 9 billion lbs., was from factory farms, with the rest generated by animals that were not confined (mostly grazing cattle).[3,4] ![]() Of the 9 billion lbs. of manure nitrogen from factory farms, about one-third is considered “recoverable.” The rest is lost during “collection, transfer, storage, and treatment.”[5]
Of the 9 billion lbs. of manure nitrogen from factory farms, about one-third is considered “recoverable.” The rest is lost during “collection, transfer, storage, and treatment.”[5]![]() Of the ~3 billion lbs. recoverable, the USDA estimates that ~1 billion lbs. of manure nitrogen (N) is land-applied to crops.[6]
Of the ~3 billion lbs. recoverable, the USDA estimates that ~1 billion lbs. of manure nitrogen (N) is land-applied to crops.[6]![]() Of the 1 billion lbs. of land-applied manure nitrogen a smaller portion, perhaps a little more than half, is incorporated into crops.[7,8]
Of the 1 billion lbs. of land-applied manure nitrogen a smaller portion, perhaps a little more than half, is incorporated into crops.[7,8]
In total, broadly estimated, ~10% of manure nitrogen from factory farms is applied to crops.[9,10]
The land application of manure on crops, despite being intensively researched, subsidized, and highly touted brings very little nitrogen to crops in practice. Almost all the nitrogen from manure from factory farming is entering and damaging ecosystems throughout the country.
Rotz, C. A. (2004). Management to reduce nitrogen losses in animal production. Journal of animal science, 82 (suppl_13), E119-E137, Table 2. [“Up to half of the excreted nitrogen is lost from the housing facility…” The broad estimate of a third is our calculation based on figures from Table 2 and assumptions about the most common facilities and manure handling methods. Most nitrogen loss at the facility is in the form of ammonia. See, fn b]
U.S. EPA (2023) Estimated Animal Agriculture Nitrogen and Phosphorus from Manure https://www.epa.gov/nutrientpollution/estimated-animal-agriculture-nitrogen-and-phosphorus-manure [2017 totals: 14,201,994,389 pounds of N]
Gollehon, N. R., et al., (2016). Estimates of recoverable and non-recoverable manure nutrients based on the census of agriculture – 2012 results. USDA Natural Resources Conservation Services, Washington, DC, p. 11. [63.5% of manure nitrogen from AFOs (see, Table 3). Calculation: 14.2 billion pounds x .635 = 9.0. In this analysis we equate “factory farming” with Gollehon’s “AFOs” since less than 2% of total manure nitrogen was from “very small AFOs” that might not meet the “factory farm” definition. See,Table A-2. All AFOs in this report are defined by “confined animals.”]
Rotz, C. A. (2004). [Notes about a 35% nitrogen loss of N for grazing feces and urine application. Incorporated nitrogen of beef cattle on pasture at less than 10%, pastured dairy cattle at ~20% (Table 4). Therefore, the overall nitrogen loss from grazing cattle is very high. (p. E121)]
Gollehon, N. R., et al., (2016), p. 11. [“The amount of recoverable manure nitrogen was 34 percent…”]
Leng, T., et al., (2023) Increasing the Value of Animal Manure for Farmers, USDA Economic Research Service, p. 13. [“Corn acres received more than 410,000 tons of manure nitrogen, 81 percent of total applied nitrogen.”]
See, Economics of Manure for the many reasons that manure is over-applied, used on top of full shares of chemical fertilizers, and applied on land owned by factory farm operations as a way to get rid of a waste product.
USDA NRCS (2017) Effects of Conservation Practices on Nitrogen Loss from Farm Fields: A National Assessment Based on the 2003-06 CEAP Survey and APEX Modeling Databases. [“Total nitrogen losses were highest for acres receiving manure. The average annual estimate of total nitrogen loss for acres receiving manure was 56 pounds per acre per year, compared to the average annual amount lost for acres not receiving manure of 32 pounds per acre per year.” (at p. 13.) A loss of 56 pounds / average of 117 pounds applied = 48% loss. High loss rates are common because the manure is often applied in addition to the full application of chemical fertilizers.]
Calculation: 1 billion pounds / 9 billion pounds = ~11%. [Of all animal ag manure nitrogen, including manure on pasture, land application is about 7% or 1 billion pounds / 14 billion pounds.] For further information on the reasons such small shares of nitrogen are applied, see, Animal Ag Water Pollution Sources [question: In what ways does manure lead to nutrient pollution?]
Note that there is some share of manure applied to hay and grassland that is not included in this tally. According to the USDA [Lim, T., et al., (2023) Increasing the Value of Animal Manure for Farmers, USDA Economic Research Service, p. 12. “Hay acreage and grassland also receive manure. USDA data from 2006 shows that 26 percent of manured acres were hay and grass acres.”] Including this amount would change the 1 billion pound estimate to ~1.4 billion lbs. However, grassland is not a crop. And since about half of manure nitrogen is applied in addition to full chemical fertilizer applications, it is clear that much of the total application is simply a form of dispersal rather than effective crop application. (see, p. 12: “only 44 percent of farmers who applied manure to corn also reduced commercial fertilizer applications to corn because of manure applications.” Corn accounts for the great majority of usage.
The nitrogen lost to the environment from the entire factory farming cycle is most likely 80% or more.[1,2]
As noted in the questions above:![]() About a third of the nitrogen in chemical fertilizers and manure applied to feed crops escapes during the crop production process.
About a third of the nitrogen in chemical fertilizers and manure applied to feed crops escapes during the crop production process.![]() Of the 70% of N embedded in feed, about a third is incorporated into the animals and the rest is excreted.
Of the 70% of N embedded in feed, about a third is incorporated into the animals and the rest is excreted.![]() Of the amounts incorporated into animals, a smaller share goes into animal food for consumption.[3]
Of the amounts incorporated into animals, a smaller share goes into animal food for consumption.[3]![]() Of the excreted manure less than 10% is applied to crops and perhaps 5% is incorporated into those crops.
Of the excreted manure less than 10% is applied to crops and perhaps 5% is incorporated into those crops. ![]() About two-thirds of manure on pasture fertilizes forage and one-third is lost. Beef cattle (by far the majority of grazing animals) incorporate the lowest share of nitrogen in plants into their bodies.[4]
About two-thirds of manure on pasture fertilizes forage and one-third is lost. Beef cattle (by far the majority of grazing animals) incorporate the lowest share of nitrogen in plants into their bodies.[4]
Bouwman, L., et al., (2013). Exploring global changes in nitrogen and phosphorus cycles in agriculture induced by livestock production over the 1900–2050 period. PNAS 110(52), 20882-20887, p. 20882. [“Therefore, it is, in fact, global livestock production that drives the nutrient cycling in the total agricultural system.” Nitrogen recovery rate for North America for the year 2000 estimated at about 18%. (Figure 3C)]
Sutton, M. A., et al., (2013). Our nutrient world. The challenge to produce more food & energy with less pollution. Centre for Ecology & Hydrology, p. viii. [“The efficiency of nutrient use is very low: considering the full chain, on average over 80% of N and 25-75% of P consumed (where not temporarily stored in agricultural soils) end up lost to the environment…” The figure “over 80%” includes all foods, not just animal products.]
Einarsson, R. (2024). Nitrogen in the food system. TABLE Explainer. TABLE, University of Oxford, Swedish University of Agricultural Sciences, and Wageningen University and Research, p. 24.
Rotz, C. A. (2004). Management to reduce nitrogen losses in animal production. Journal of animal science, 82(suppl_13), E119-E137, p. E121. [Notes ~35% nitrogen loss of N for grazing feces and urine application (Table 4). Incorporated nitrogen of pasture-raised and feedlot beef at 10% or less.]
Broadly estimated, ~15-20% of the total nitrogen leaked to the environment is ammonia.[1-4] Most of the ammonia comes from animal ag.[5]
Of total atmospheric nitrogen emissions, ammonia makes up ~35-40%.[6] Ammonia is generally considered the most damaging air pollutant from agriculture (followed by nitrous oxide, a significant factor in climate change).[7,8]
Houlton, B. Z., et al., (2013). Intentional versus unintentional nitrogen use in the United States: trends, efficiency and implications. Biogeochemistry, 114, 11-23, See, Figure 3, p. 18. [Estimate is 13% of total N is lost to the environment via NH3. Of anthropogenic N creation this would be about 16%]
Sobota, D. J., et al., (2015). Cost of reactive nitrogen release from human activities to the environment in the United States. Environmental Research Letters, 10(2), 025006. pp. 6-7. [At the national scale, anthropogenic N leakages per year = 4.8 surface freshwater, 4.2 groundwater, 3.0 ammonia, 1.9 coastal zones, 1.4 fossil fuel combustion (p. 6). Calculation: 3.0 Tg N / 15.3 = 19.6%. Ammonia emissions have grown to ~5.5 million tons (~5 Tg N) per the EPA, so the 15-20% figure could be an underestimate.]
Liu, L., et al., (2022). Exploring global changes in agricultural ammonia emissions and their contribution to nitrogen deposition since 1980. PNAS, 119(14), e2121998119. [Notes that 17% of N in fertilizer applications (the largest N input) is lost to NH3 in the U.S. Does not appear to give total NH3 lost from manure, except as kilograms per head (Supporting information Table S-3)]
National figures on total escaped N are not regularly calculated. According to USDA researchers, “there are no national estimates of total reactive N loss…” [See, Rotz, A., et al., (2021). Environmental assessment of United States dairy farms. Journal of Cleaner Production, 315, 128153. Abstract]
U.S. EPA (2024) 2020 NEI Supporting Data and Summaries – Data Queries for Sector Summaries.[Query: National/Ammonia NH3/Livestock Waste (49.2%), fertilizer application (33.5%), agricultural field burning (2.7%) of total (5,482,484 tons). Of the 36.2% due to crop production, we estimate at least half is from feed crops.]
U.S. EPA (2024) 2020 NEI Supporting Data and Summaries – Data Queries for Sector Summaries. [5.5 million tons (ammonia) / 14.4 million tons (nitrogen oxides + ammonia) = 38%]
Rotz, C. A., et al., (2014). Ammonia emission model for whole farm evaluation of dairy production systems. Journal of environmental quality, 43(4), 1143-1158, p. 1143. [“Gaseous emissions from animal agriculture have become an important issue in the United States and in many other countries. Emissions include greenhouse gases, volatile organic compounds, and specific toxic compounds, of which ammonia (NH3) is the most important.”]
Hill, J., et al., (2019). Air-quality-related health damages of maize. Nature Sustainability, 2(5), 397-403. [Calculates that the economic damages of ammonia emissions from corn production far exceed those of nitrous oxide (Figure 6)]
To some degree, yes. Water quality goals and air quality goals can be in conflict, and operators have some influence over which type of emissions they allow.[1] Some degree of “pollution swapping” is likely occurring.[2]
The largest source of ammonia comes from farmed animal manure.[3] Ammonia starts escaping from feces and urine the moment the manure is excreted. Storing manure in lagoons greatly reduces nitrogen levels through volatilization which allows the land-applied manure to more easily meet nutrient management plans required by water pollution regulations.[4] The longer manure is exposed, however, the more it volatizes.[5] And this protracted volatilization allows the ammonia to escape into the atmosphere where it adversely affects air quality.[6]
Some factory farms are likely choosing air pollution emissions rather than water pollution. Air pollution regulations are generally even weaker than water pollution regulations.[7]
Aillery, M. P., et al., (2005). Managing manure to improve air and water quality. USDA Economic Research Service, Report 9, p. iii. [“To meet a water quality goal, farmers tend to use practices that increase ammonia emissions to the air. Similarly, the practices used to meet an air quality goal would tend to increase nitrogen losses from fields to ground and surface waters. Meeting both air and water quality goals would likely cost more than meeting either air or water goals.”]
Rotz, A., et al., (2021). Environmental assessment of United States dairy farms. Journal of Cleaner Production, 315, 128153. [“While strategies are available to reduce NH3 emissions, finding economical and sustainable solutions that do not result in pollution swapping remains a challenge for the dairy industry.” (p. 1) Also see Figure 2: 66% of reactive nitrogen loss from dairy farms is via ammonia emissions (which are mostly unregulated)]
U.S. EPA (2024) 2020 NEI Supporting Data and Summaries – Data Queries for Sector Summaries. [Query: National/Ammonia NH3/Livestock Waste (49.2%), fertilizer application (33.5%) of total (54,82,484 tons)]
Key, N., et al., (2011) Trends and Developments in Hog Manure Management: 1998-2009, USDA Economic Research Service, Bulletin No. 81, p. 23. [Lagoons reduce manure’s nitrogen content through anaerobic digestion and ammonia volatilization. This allows farmers to apply more manure on less land without exceeding crop nutrient requirements, thereby lowering manure transportation costs by eliminating the need to transport manure to more distant cropland.”]
Rotz, C. A. (2004). Management to reduce nitrogen losses in animal production. Journal of animal science, 82(suppl_13), E119-E137. [“Volatile loss begins soon after excretion, and it continues through all manure handling processes until the manure nutrients are incorporated into soil.”]
Rotz, C. A. (2004), p. E119. [“At least 70% of the nitrogen entering anaerobic lagoons is typically lost.”]
Madison McVan (April 20, 2023) 18 years and counting: EPA still has no method for measuring CAFO air pollution, Investigate MidWest. https://investigatemidwest.org/2023/04/20/18-years-and-counting-epa-still-has-no-method-for-measuring-cafo-air-pollution/