1. About 50% of all U.S. nitrogen applications and ~75% of all phosphorus are used on corn and soybeans, the primary feed crops.
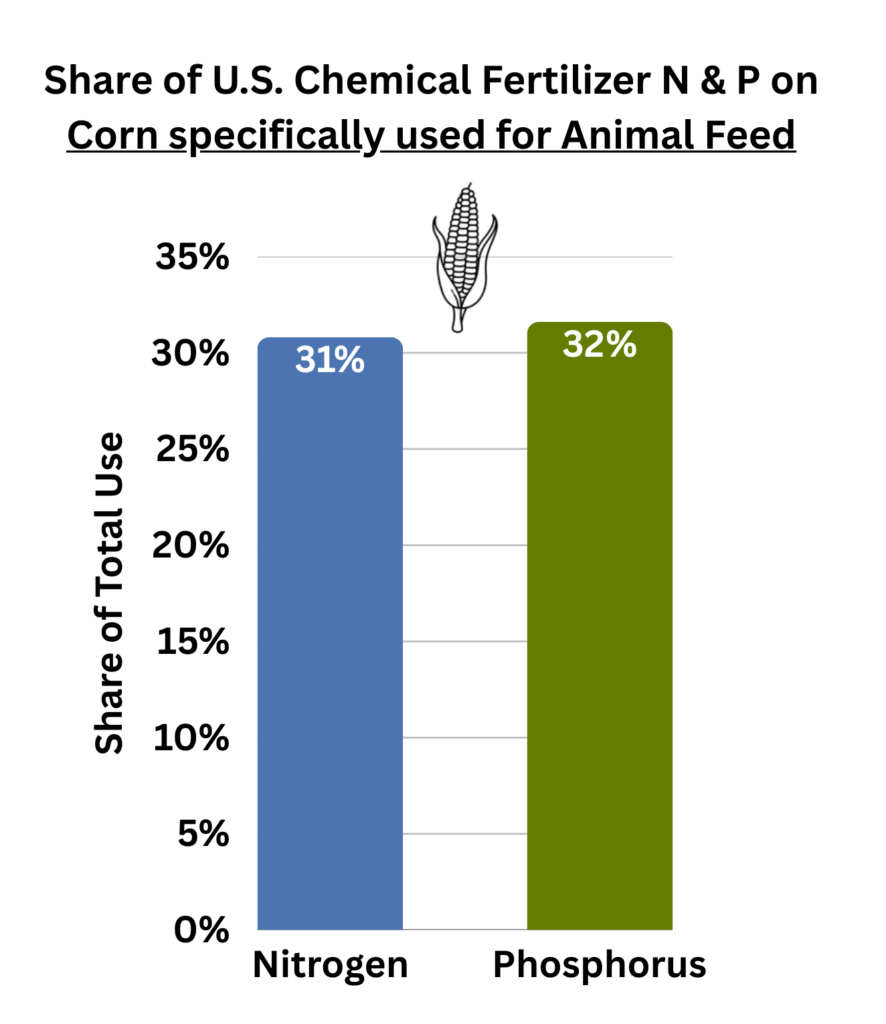
2. About a third of all U.S. nitrogen use and almost half of all phosphorus is applied to the share of corn & soybeans specifically used for animal feed.
3. When tallying secondary crops such as wheat, sorghum, and barley, ~35% of all U.S. nitrogen and ~50% of all phosphorus is applied to the share of harvested crops specifically used for animal feed.
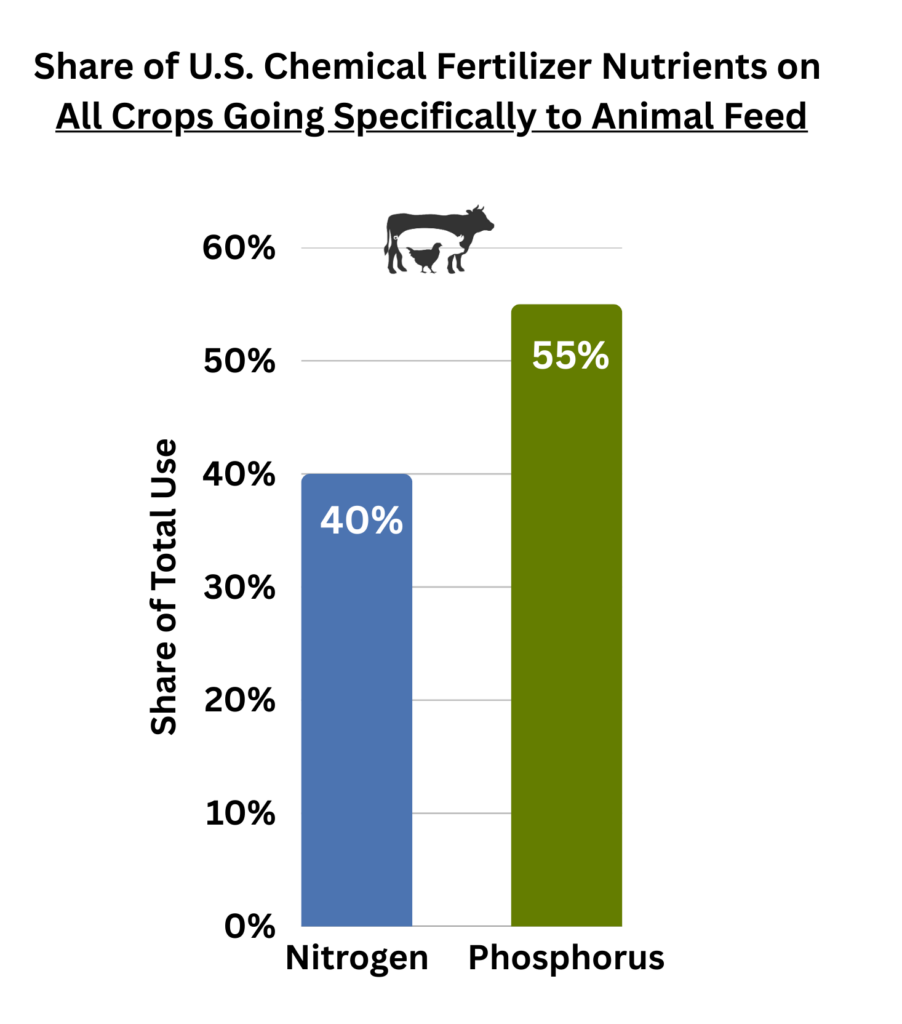
4. Considering applications on corn silage, other secondary crops and usages, and the fertilization of hay and pastureland – nearly all of which goes to livestock – we estimate that ~40% of all nitrogen and ~55% all phosphorus is used specifically for animal feed.
5. Vegetables, fruits, and pulses account for under 5% of total nitrogen and phosphorus use.
Based on the most recent USDA data, the amount of chemical fertilizer nutrients applied to corn and soybean crops is more than for all other crops combined.[1-4]
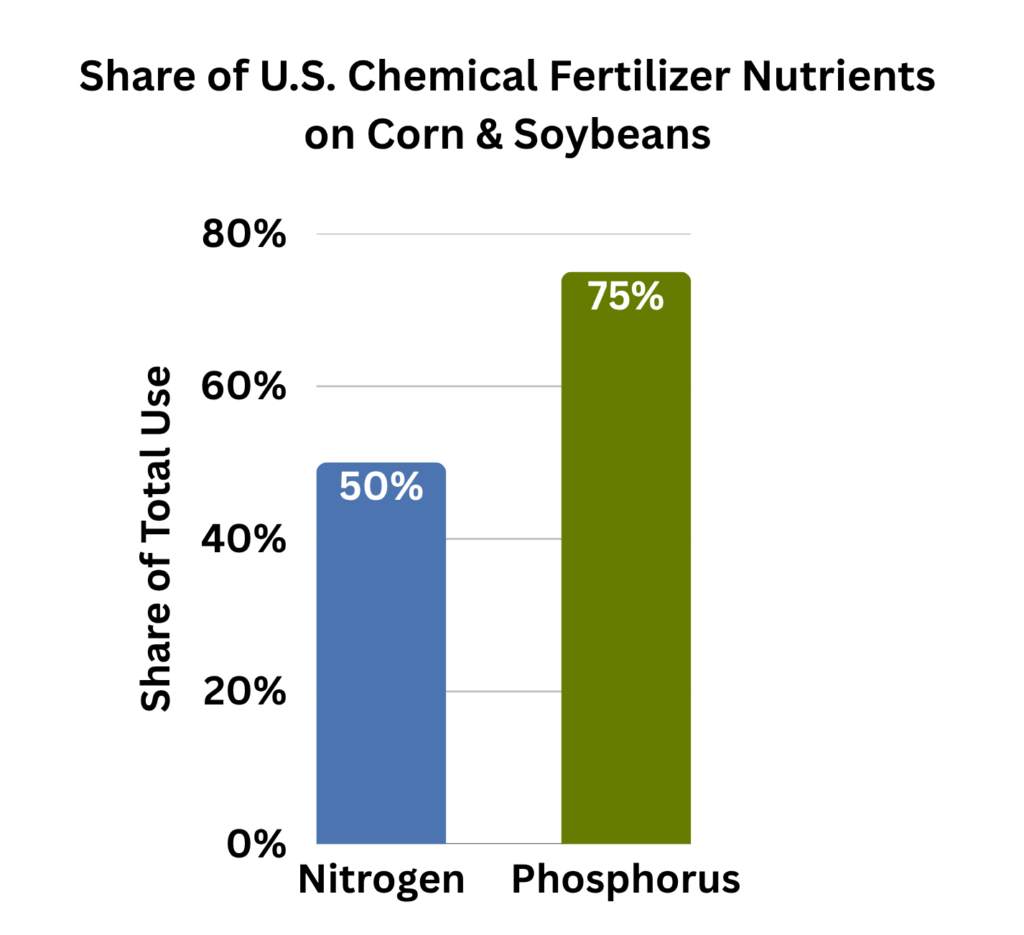
Nitrogen (N) applied to corn and soybeans accounts for ~50% of all U.S. nitrogen use.
Phosphorus (P) applied to corn and soybeans accounts for ~75% of all U.S. phosphorus use.
Corn and soybeans are the nation’s 2 largest crops, both predominantly used for animal feed.
All figures in fertilizer/nutrient evaluations should be considered broad estimates. There are 3 credible databases – USDA, FAO, and IFA (Int’l Fertilizer Assoc.) that each offer detailed information, though none provide a complete evaluation that include yearly updates, total of all nutrient usage, and nutrients by crop. For total annual U.S. amounts of nitrogen and phosphorus chemical fertilizer applied, we use the most current data from the FAO. For nutrients by crop we use USDA for selected years, since they rotate evaluations from year to year. International Fertilizer Association info is used as a check of the FAO data.
The total U.S. use of N & P is an average of years 2021-2023 obtained from FAOSTAT (2023 is the last year data reported as of 7/6/26). Query: Fertilizers by Nutrient/U.S./ Agricultural Use. Total nutrients were converted to pounds, and the three years averaged at Nitrogen ((25,408,341,034 lbs.) Phosphorus (3,577,677,750 lbs.) converted from the FAO figure given for phosphate. See, Chemical Fertilizers on Feed Crops spreadsheet https://docs.google.com/spreadsheets/d/1gcinJo2LOdb0ITUfrfQcp9oUBsRVS8FV-2MfuNnsEW0/edit?gid=0#gid=0
The use of N & P corn for 2021 and for soy 2023 obtained from USDA NASS Quick Stats (the last years for which fore USDA has published base surveys): [Survey/Environmental/Crop/Fertilizer/Applications, measured in lbs.)] 2021 Corn: share of N = 48.4%; share of P = 50.5%; 2023 Soybeans: share of N = 2.1%, share of P = 25%]
Although the USDA and FAO report P usage in phosphate lbs. (P205), we use an adjusted figure for phosphorus, since phosphorus is the key pollutant. See, Falcone, J.A., 2021, Estimates of county-level nitrogen and phosphorus from fertilizer and manure from 1950 through 2017 in the conterminous United States: U.S. Geological Survey Open-File Report 2020–1153, 20 p. 10. [“ERS estimates for application rates and fertilized acres are given for phosphate, P2O5; however, the desired calculation for this report was for phosphorus. For this reason, the mass of phosphate (P2O5), which resulted from the above calculations, was multiplied by 0.437 to convert it to the mass of phosphorus.”]
These percentages are in line with IFA figures from 2018-2019. Share for corn & soy was 51% nitrogen; 70% phosphorus. [see, Ludemann, C. et al., (2022) Global data on fertilizer use by crop and by country, Data files/Country tables. Dryad. published by the International Fertilizer Association through IFASTAT]
In 2021 (the most recent year for which the USDA has published fertilizer use for corn), the share of total chemical fertilizers applied to corn specifically used for animal feed was about 31% of all nitrogen and 32% of all phosphorus.[1-4] In other words, slightly less than one-third of all U.S. chemical fertilizer was applied to corn fed to farmed animals.
See, Chemical Fertilizers on Feed Crops spreadsheet https://docs.google.com/spreadsheets/d/1gcinJo2LOdb0ITUfrfQcp9oUBsRVS8FV-2MfuNnsEW0/edit?gid=0#gid=0
The use of N & P on corn for 2021 obtained from USDA NASS QuickStats. [Survey/Environmental/Corn/Fertilizer/Applications: Nitrogen = 12,299,300,000 lbs., Phosphorus = 1,805,858,800 lbs. converted form phosphate.]
The total U.S. use of N & P obtained from FAOSTAT – Fertilizers by Nutrient, U.S. average of years 2021-2023 (date run 7/6/26): Nitrogen (25,408,341,034 lbs.; phosphate (10,733,033,250 lbs. converted to phosphorus = 3,577,677,750 lbs.)
Share of corn used for animal feed is calculated at 64%. This includes exports used as animal feed, corn silage, and the animal feed share of corn used for ethanol. See Share of Corn Crop to Feed.
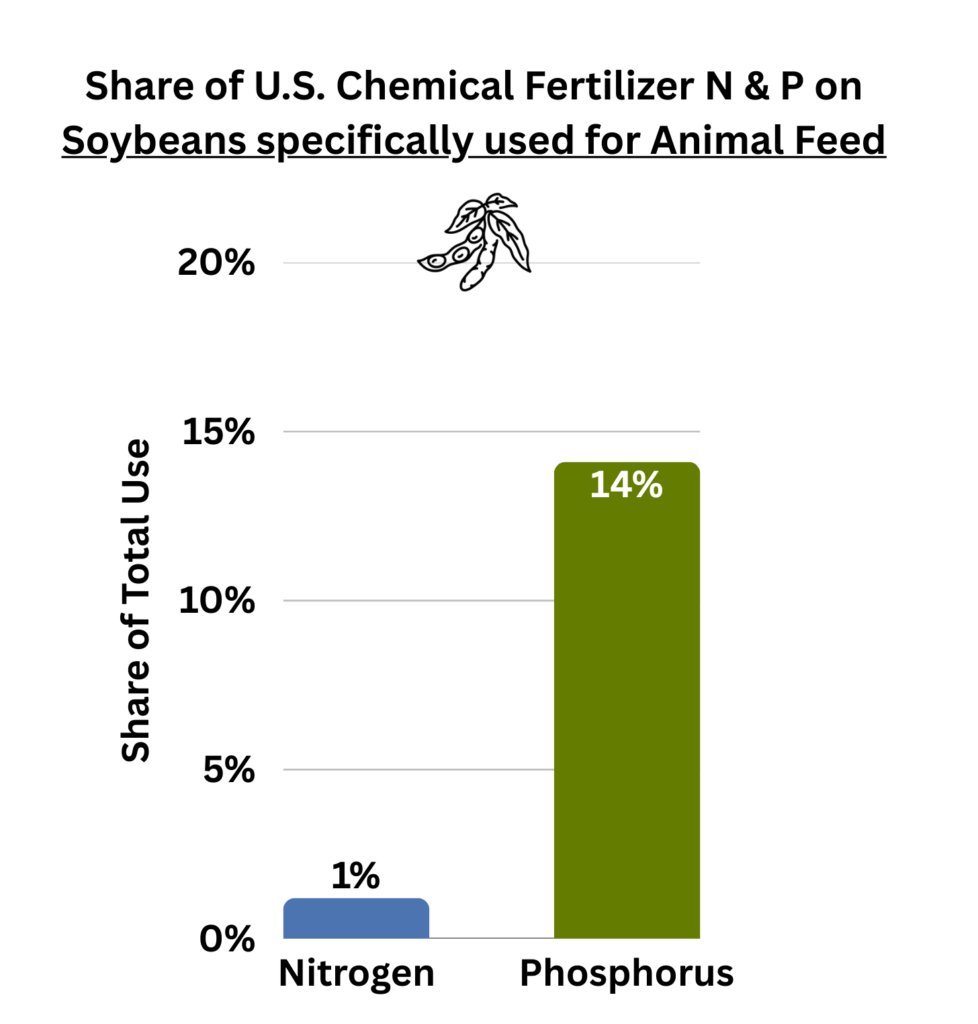
In 2023, the share of total chemical fertilizers applied to the portion of soybeans specifically used for animal feed was ~1% of all nitrogen and ~14% of all phosphorus.[1-4]
See, Chemical Fertilizers on Feed Crops spreadsheet https://docs.google.com/spreadsheets/d/1gcinJo2LOdb0ITUfrfQcp9oUBsRVS8FV-2MfuNnsEW0/edit?gid=0#gid=0
The use of N & P on soybeans for 2023 [USDA NASS Quick Stats, Survey/Environmental/Crop/Fertilizer/Applications, measured in lbs., Soybeans 2023: Nitrogen = 537,000,000 lbs., Phosphorus = 892,179,200 lbs. converted from phosphate.]
The total U.S. use of N & P was obtained from FAOSTAT Fertilizers by Nutrient, U.S. average of years 2021-2023 (date run 7/6/26): Nitrogen ((25,408,341,034 lbs.; phosphate (10,733,033,250 lbs. converted to phosphorus = 3,577,677,750 lbs.)
Share by value of soybeans used for animal feed is calculated at 58%. This includes exports used for animal feed and soybean meal for animal feed. See Share of Soybean Crop to Feed. Note that soybeans do not use much nitrogen chemical fertilizer because, like other legumes, they can interact with soil organisms to convert nitrogen from the air into forms of nitrogen that can be used for plant growth.
The share of chemical fertilizers used on both corn and soybeans going to animal feed is ~32% of all U.S. nitrogen use and ~47% of phosphorus.[1]
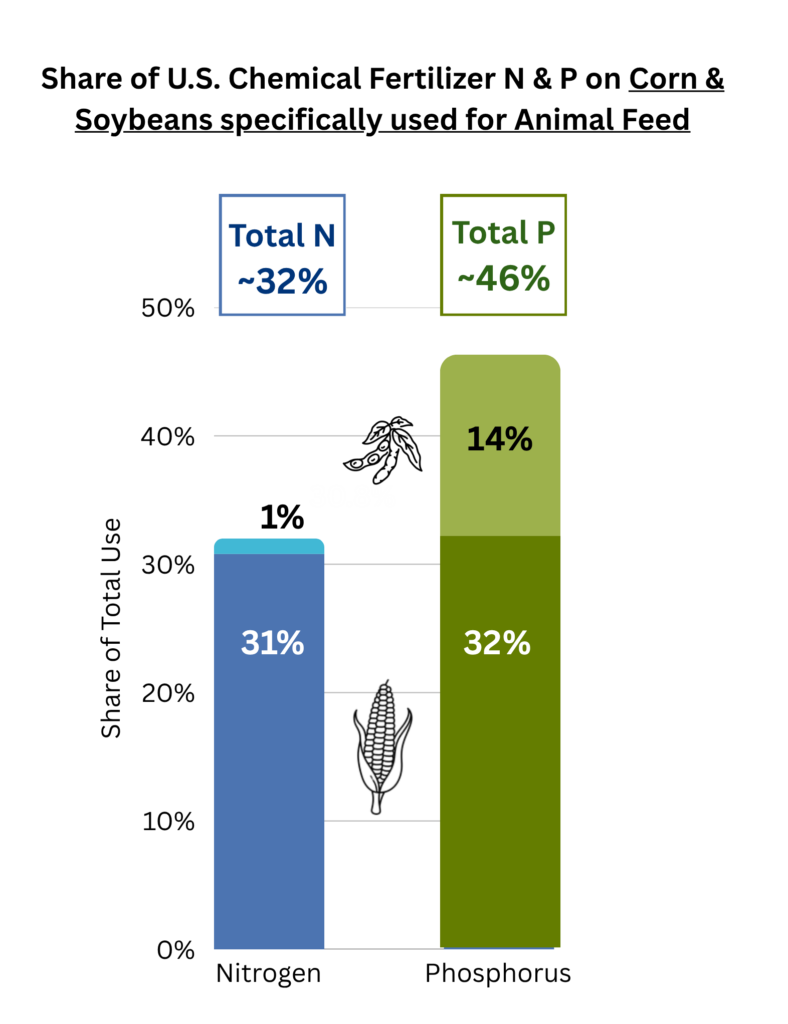
See previous questions for share of N & P used on corn and on soybeans.
When tallying all crop usage, we broadly estimate that ~40% of all U.S. nitrogen and ~55% of all phosphorus is applied to the share of crops specifically used for animal feed.
These figures include:![]() Harvested corn, soybeans, wheat, sorghum, and barley going to animal feed, which together tally to ~36% N and 50% P.[1]
Harvested corn, soybeans, wheat, sorghum, and barley going to animal feed, which together tally to ~36% N and 50% P.[1]![]() Corn silage (all used for forage) and failed corn acres (some used for forage) add an additional ~2 to 3% of N and ~2 to 3% of P (thereby increasing totals to feed to ~38% of N and 52% of P).[2]
Corn silage (all used for forage) and failed corn acres (some used for forage) add an additional ~2 to 3% of N and ~2 to 3% of P (thereby increasing totals to feed to ~38% of N and 52% of P).[2]![]() Many other secondary crops and crop usages go to feed, likely adding a couple of percent to these figures.[3]
Many other secondary crops and crop usages go to feed, likely adding a couple of percent to these figures.[3] ![]() Some chemical fertilizers, generally untallied, are applied to alfalfa, other hays, and pastureland (nearly all of which goes to livestock). [4,5]
Some chemical fertilizers, generally untallied, are applied to alfalfa, other hays, and pastureland (nearly all of which goes to livestock). [4,5]
See Chemical Fertilizers on Feed Crops spreadsheet https://docs.google.com/spreadsheets/d/1gcinJo2LOdb0ITUfrfQcp9oUBsRVS8FV-2MfuNnsEW0/edit?gid=0#gid=0
Nutrients used on corn, as estimated by the USDA, are for grains only and excludes silage [See, USDA ERS (2025) Fertilizer Use and Price, Fertilizer use and price tables, Table 2, footnote 1] Acres planted for corn in 2021 = 93,357,000. Acres of silage harvested = 6,481,000. Acres of grain harvested = 85,388,000. [USDA NASS (2022) Acreage, p. 33] Assuming similar N and P applications on corn silage, 6,481,000/ 85,388,000 = 7.6% * 31% of N for feed = an additional 2.4% N. For P, 7.6% * 32% = an additional 2.4% of P.
See, Total Feed Crops Share [question: What crop usages add at least an additional 2% to our estimate?]
There are no national statistics that report the share of fertilizer-applied nutrients on U.S. pastureland. Nor does the USDA report the share used on alfalfa/hay, other than acres that fertilize using chemigation (fertilizer applications using irrigation ) in 2023 (691,981 acres). And these are a very small share of all ~127 million hay acres (USDA Census of Ag 2022, Table 35).
Fertilization of both pasture and hay acres is recommended in nutrient budgets in some regions as set out by the USDA and agricultural extensions. [See, e.g. USDA (2022) Illinois Grazing Manual Fact Sheet, Pasture Fertilization. https://www.nrcs.usda.gov/sites/default/files/2022-09/Pasture-Fertilization.pdf; Utah State University Crop Resources, Alfalfa Nutrient Management Guide. https://extension.usu.edu/crops/research/alfalfa-nutrient-management-guide; Crop Quest (2017) Fertility Requirements of Alfalfa Production. https://www.cropquest.com/fertility-reqs-in-alfalfa/ [In Kansas, recommending about 318 pounds of nitrogen, 72 pounds of phosphorus, and 300 pounds of potassium per acre.] Univ of Minnesota Extension (2023) Fertilizing Alfalfa in Minnesota. https://extension.umn.edu/crop-specific-needs/fertilizing-alfalfa
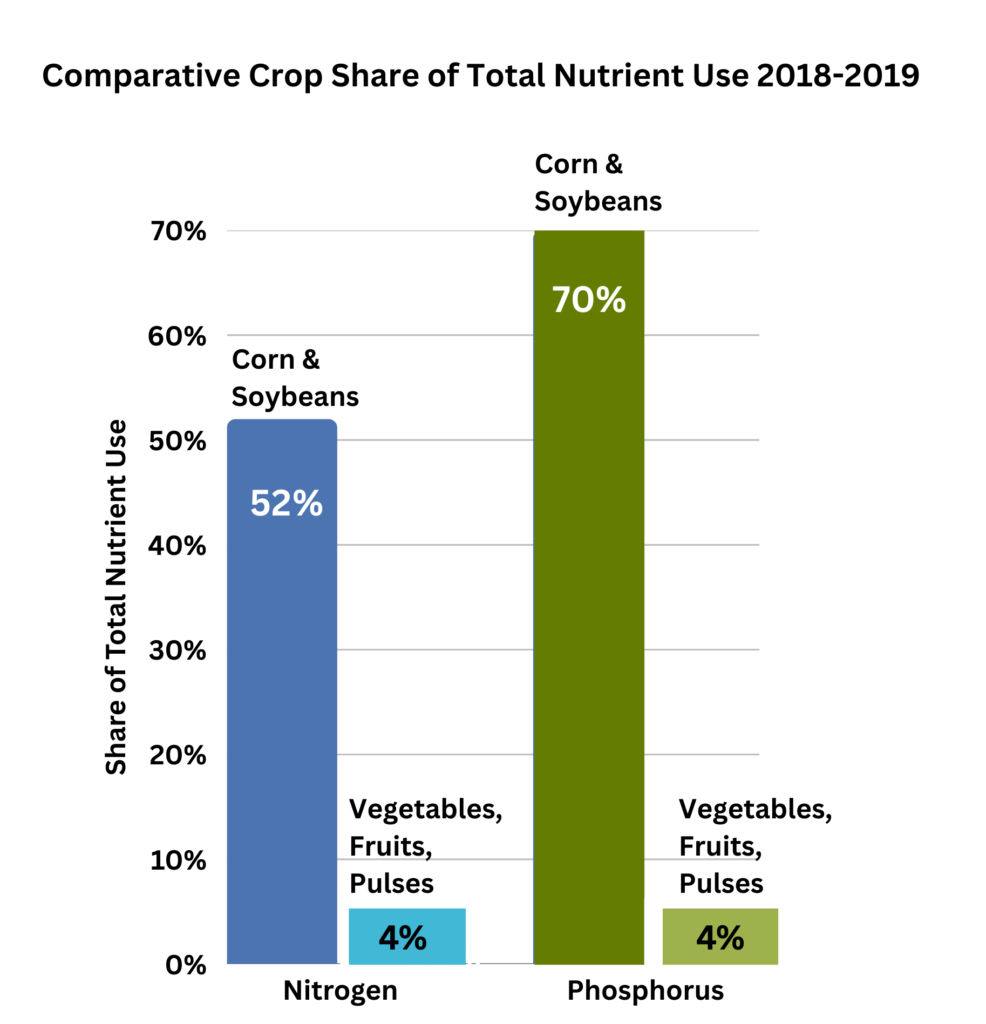
A 2018-2019 analysis reported that total usage on vegetables, fruits, and pulses (i.e., beans, lentils and peas) accounted for about 4% of total nitrogen and 4% of phosphorus.[1]
Compared to this group of foods, during the same period surveyed, corn and soybeans used:![]() ~14 times more nitrogen
~14 times more nitrogen![]() ~17 times more phosphorus.[2]
~17 times more phosphorus.[2]
Ludemann, C. et al., (2022). Global data on fertilizer use by crop and by country, Data files/Country tables. Dryad. published by the International Fertilizer Association through IFASTAT. [See Data files for Country Tables — Mineral FertiIizer Use by Crop. N 413,437MT/ 11,347,070 = 3.64%; P 165,067/ 3,931,740 = 4.20%]
Ludemann, C. et al., (2022) [Corn and Soy together = 52.0% of N, 70.2% of P. Calculation: For N, 52.0/ 3.6 = ~14 times. For P, 70.2/ 4.2 = ~17 times.]
For each American, about 128 total lbs. of nitrogen, potassium, and phosphorus were applied to U.S. croplands in 2022.[1,2]
The total U.S. use of N,P,K obtained from FAOSTAT [Inputs/Fertilizers by Nutrient/United States/2022. Total N,P, K = 42,701,683,031 lbs.]
U.S. Census Bureau, U.S. and World Population Clock. [At the end of 2022, the U.S. population was 334,130,076. Total fertilizer use in the U.S. of 42,701,683,031 lbs. / 334,130, 076 == 127.8]