
1. Glyphosate and atrazine are the most widely used herbicides.
2. About half of total glyphosate usage is applied to the share of crops going specifically to animal feed – primarily corn and soybeans.
3. About 60% of all atrazine is applied to the share of crops going specifically to animal feed. The vast majority is used on corn.
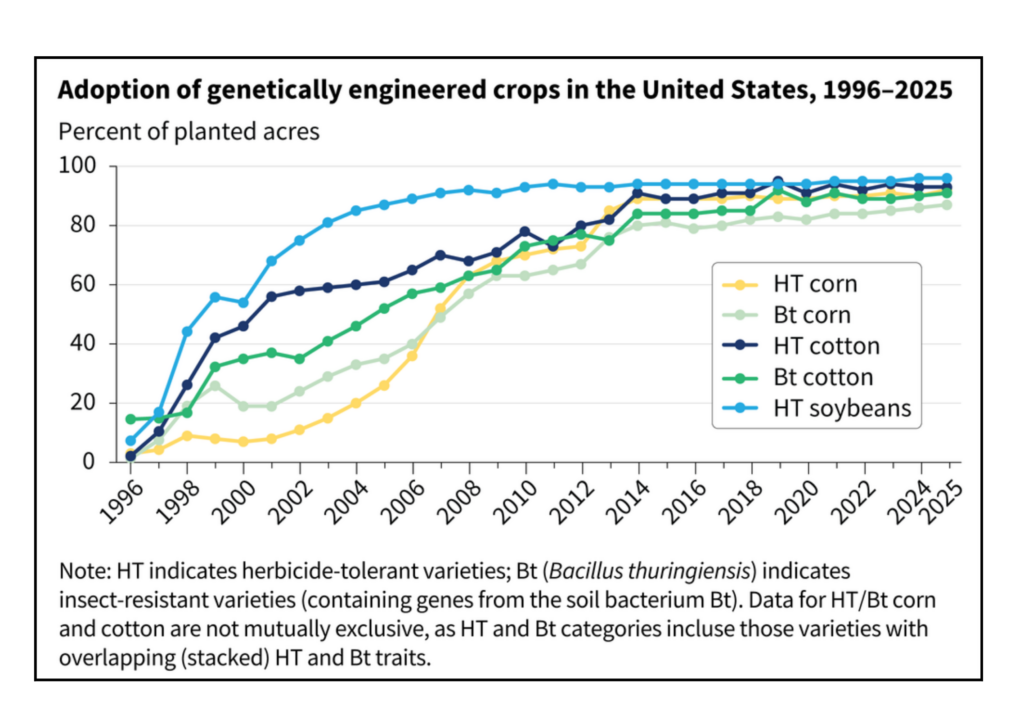
4. Genetically modified corn and soybeans designed to tolerate specific herbicides, especially glyphosate, have led to the evolution of herbicide-resistant weeds, which has driven a steady increase in herbicide use.
5. From 2005 to 2021, overall herbicide use on corn increased ~50%, with usage on soybeans more than doubling.
Glyphosate is the most widely used herbicide both in terms of area treated and quantity applied (weight of active ingredients).[1,2]
Atrazine is the second most widely used.[3,4]
U.S. EPA (2019) Memorandum: Glyphosate: Response to Comments, Usage, and Benefits. p. 2 and p. 27. [“Glyphosate is the most commonly used herbicide in the United States, in terms of area treated. … Glyphosate is a broad-spectrum herbicide that is applied on an average to 298 million acres of cropland annually, making it the most commonly used herbicide on agricultural sites in the United States.”]
U.S. EPA (2016) Pesticides Industry Sales and Usage: 2008-2012, Table 3.4 & p. 13. [“Glyphosate was the most used active ingredient in 2012 (270 million to 290 million pounds used), as it has been since 2001.” Was more than triple the pound volume of atrazine.]
U.S. EPA (2016) Pesticides Industry Sales and Usage: 2008-2012, Table 3.4. [Atrazine at 64M to 74M pounds.]
Beaulieu, M., et al., (2020). Predicting atrazine concentrations in waterbodies across the contiguous United States: The importance of land use, hydrology, and water physicochemistry. Limnology and Oceanography, 65(12), 2966-2983. [“Atrazine, an herbicide, is the second most used pesticide in the United States…”]
Based on the last report by the USGS on glyphosate use, more than 50% of total U.S. glyphosate is used on crops specifically going to animal feed.[1-5]
Out of a total of ~272 million lbs. of glyphosate, ~140 million pounds were used on the shares of corn, soybeans, pasture and hay/alfalfa going to animal feed.
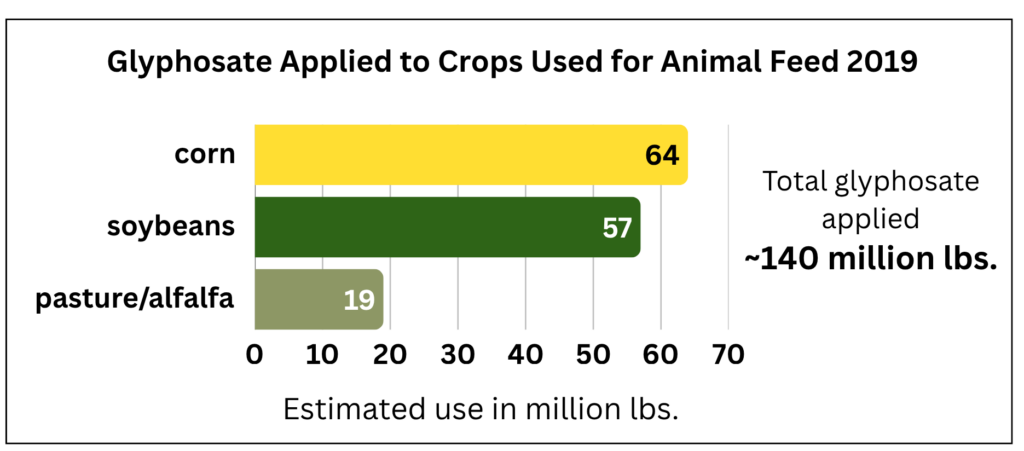
The total share to animal feed is likely well over 50%, since there are other crops, a portion of which are used for animal feed, including sorghum, wheat, canola, and cotton, that are treated with glyphosate, adding at least 2 to 3% to the total.[6,7]
These estimates are based on a visual examination of the glyphosate use chart from USGS Pesticide National Synthesis Project (2021) Estimated Annual Agricultural Pesticide Use, Glyphosate 2019. https://water.usgs.gov/nawqa/pnsp/usage/maps/show_map.php? year=2019&map=GLYPHOSATE&hilo=L [Showing a total of ~272 million lbs. applied.]
Calculation: Corn ~97 million lbs. * 65% share to animal feed = 63 million lbs.; Soybeans ~97 million lbs. * 58% share to animal feed = 56 million lbs.; Pasture & hay/alfalfa = 20 million lbs. * 95% share to animal feed = 19 million lbs. Total = 140 million lbs. / 272 = or ~51%. For shares of crops to animal feed, see Total Feed Crops Share
U.S. EPA (Revised May 19, 2020) Memorandum: Glyphosate: Response to Comments, Usage, and Benefits (PC Codes: 103601 103604, 103605, 103607, 103608, 103613, 417300).
[This EPA memorandum confirms or may be even higher than the USGS figures of total shares to feed crops. See Table 1A, p. 14. Of an estimated 280 million pounds applied to agricultural crops, 94.9 applied to corn and 113.9 applied to soybeans. Therefore 94.9 * .66 = 62.6M, and 113.9 * .59 = 67.2M. 62.6 + 67.2 = 129.8 / 280 = 46%. These figures do not include pasture/hay/alfalfa, which in the USGS estimate make up about 8% of total usage and are almost entirely used for animal feed.]Benbrook, C. M. (2016). Trends in glyphosate herbicide use in the United States and globally. Environmental Sciences Europe, 28, 1-15. Table 3, p. 6. [For the year 2014, report estimates totals on soybeans at 122.5M lbs and corn at 68.9M lbs. and total crops at 249.9M lbs. Therefore, corn and soy at 191.4 / 249.9 = 77%. This is an older but credible report.]
Hygeia Analytics, PUDS (Pesticide Use Data System), dataset: Individual Analytes/Corn or Soybeans/Herbicides/Glyphosate/National/2018. [Site based on the expert work of Dr. Charles Benbrook estimates amount of glyphosate used on corn in 2018 at 71.9M lbs.; glyphosate on soybeans in 2018 was 99.6M lbs. == 171.5M lbs. Does not appear to provide total crop usage.]
U.S. EPA (Revised May 19, 2020) Memorandum: Glyphosate: Response to Comments, Usage, and Benefits (PC Codes: 103601 103604, 103605, 103607, 103608, 103613, 417300) [“About 280 million pounds of glyphosate are applied to an average of 298 million acres of crop land annually.”]
And see, Secondary Crops Used for Animal Feed
According to the last report by the USGS, more than 90% of all atrazine usage (~73 million lbs.) was applied to corn in 2019. Incorporating the share applied to pasture and hay, we estimate that ~60% of total U.S. atrazine is used on crops specifically going to animal feed.[1-3] 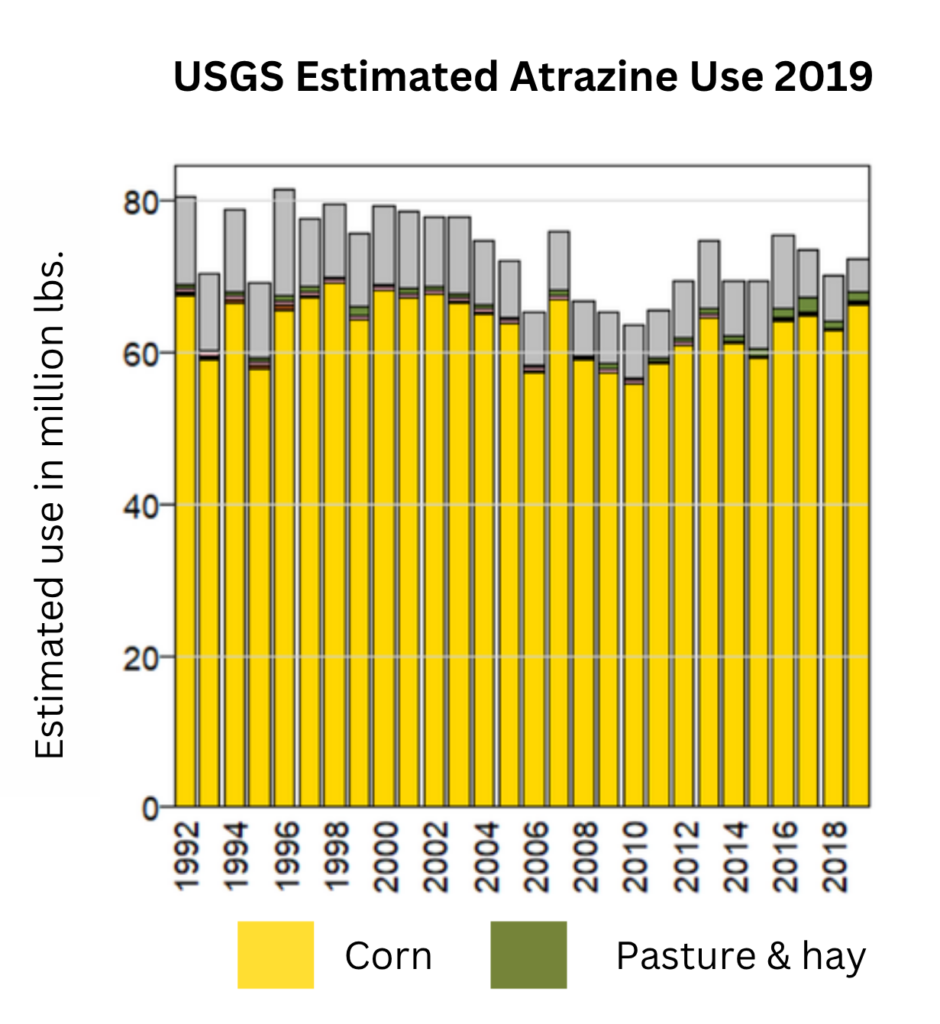
Atrazine was effectively banned by the EU in 2004 and is currently banned in more than 30 other countries.[4,5] In 2025, the World Health Organization’s cancer research agency classified atrazine as “probably carcinogenic to humans.”[6]
USGS, Pesticide National Synthesis Project (2021) Estimated Annual Agricultural Pesticide Use, Atrazine 2019. [Visual estimate of USGS chart shows total atrazine usage at ~73M pounds for 2019. Corn usage estimated at ~66M pounds * 66% to animal feed = ~44M lbs.; Pasture/alfalfa of ~2M lbs. * 95% share to animal feed = 1.9M lbs. Total = ~46M lbs. or ~63% of total 73M lbs.]
For shares of crops going to animal feed, see Total Feed Crops Share
U.S. EPA (October 21, 2020) Executive Summary “Atrazine Executive Summary for Biological Evaluation,” Final National Level Listed Species Biological Evaluation for Atrazine, Endangered Species. [EPA estimates that from 2013 through 2017, average atrazine usage was 72 million pounds]
Legislation.gov.uk (2004) Commission Decision concerning the non-inclusion of atrazine, 2004/248/EC. [“Measures should be taken to ensure that existing authorisations for plant protection products containing atrazine are withdrawn within a prescribed period and are not renewed and that no new authorisations for such products are granted.”]
Bethsass, J., & Colangelo, A. (2006). European Union bans atrazine, while the United States negotiates continued use. International journal of occupational and environmental health, 12(3), 260-267.
Cattley, R. C., et al., (2025). Carcinogenicity of atrazine, alachlor, and vinclozolin. The Lancet Oncology. [“From October to November, 2025, a Working Group of 22 scientists from 12 countries met at the International Agency for Research on Cancer (IARC)… Atrazine and alachlor were each classified as ‘probably carcinogenic to humans…’”]
Immense production – Corn and soybeans are the nation’s largest crops and the largest users of glyphosate and atrazine.[1] Corn and soybean production goes mostly to animal feed.[2] These 2 crops take up ~55% of U.S. cropland — an area the size of Texas.[3]
Monoculture crops – Monoculture agriculture eliminates much of the biodiversity (predators, competing plants, and alternative hosts) that would otherwise keep weeds in check.[4,5] Large amounts of herbicides applied with advanced technology are now the norm to keep yields high and labor costs down. Corn and soybeans are mostly grown on huge tracts of monoculture cropland – continuous areas of a single plant species. About 63% of corn and ~65% of soybeans are grown on monoculture tracts exceeding 500 acres.[6]
Genetically Engineered (GE) Crops – Corn and soybeans are now almost entirely grown from genetically modified seeds that are herbicide tolerant (primarily glyphosate). This allows farmers to use herbicides freely and more often.[7,8] The adoption of GE corn and soybeans has increased dramatically in the last 30 years.[9] The pervasive and long-term use of herbicides, particularly in GE monoculture corn and soybeans, has led to the evolution of herbicide resistant weeds, which in turn has driven increasing herbicide usage along with multiple applications including both older and newer herbicides.[10,11]
As noted in previous questions.
See, Share of Corn Crop for Feed and Share of Soybean Crop for Feed
USDA NASS (2026) Acreage, p. 32 [In 2025, corn and soybeans planted on 180 million acres. (Corn = 98.8M. Soybeans = 81.2M.) Total acres planted = ~322M, including 311.5M in “principal crops” (p. 5) + ~10M acres for vegetables and fruits (See USDA Census of Ag 2022 Tables 35-37). 180 / 322 = ~56%.]
Amina Khatri (2025) Monoculture’s Peril: Environmental, Economic, and Food Security Risks. Journal of Environmental Hazards, 09:03, p. 1. [“The absence of natural predators and competitors in such simplified environments can also lead to the unchecked proliferation of pest species, thereby creating a self-perpetuating cycle of dependency on chemical interventions.”]
Allison Balogh (2021) The rise and fall of monoculture farming. Horizon, The EU Research & Innovation Magazine. [“Raising a single crop has drawbacks as it increases the risk of disease and pest outbreaks because monocultures lack other plant and animal species that limit the spread of disease and control pests through predation. This means larger amounts of pesticides and herbicides, which can pollute rivers and streams, are needed compared to more diverse farming systems.”]
USDA 2022 Census of Agriculture. [See pages 25-27. Corn = 18,211,453 + 32,192,409 / 80,597,963 = ~63%. Soybeans = 19,150,664 + 35,952,510 / 84,599,236 = ~65%. Tallies in the Census of Ag are for harvested cropland. The corn figures are for corn for grain only.]
Mortensen, D. A., et al., (2024). Another step on the transgene-facilitated herbicide treadmill. Pest Manag Sci 80: 4145–4149, p. 4146. [“Interestingly, glyphosate use rates continued at 1.4 kg ha−1 despite the ever-worsening problem of glyphosate resistance. Hence, the large increase in total herbicide use over that period was driven primarily by applications of other pre- and post-emergence herbicides intended to control glyphosate-resistant weeds. Dramatic increases in the use of dicamba following the introduction of dicamba-resistant soybean further added to the total.”]
USDA (2022) 2021 Agricultural Chemical Use Survey – Corn [See Table 2. Considering only the top 5 herbicides applied to corn, the average use is 2.14 herbicide types per acre.]
USDA ERS (2025) Adoption of Genetically Engineered Crops in the United States – Recent Trends in GE Adoption.
Bonny, S. (2016). Genetically modified herbicide-tolerant crops, weeds, and herbicides: overview and impact. Environmental management, 57(1), 31-48, Abstract. [“However, the repetition of glyphosate-tolerant crops and of glyphosate only applications in the same fields without sufficient alternation and herbicide diversity has contributed to the appearance of glyphosate-resistant weeds. These weeds have resulted in a rise in the use of glyphosate and other herbicides.”]
Myers, J. P., et al., (2016). Concerns over use of glyphosate-based herbicides and risks associated with exposures: a consensus statement. Environmental Health, 15(1), 19. [“The emergence and spread of glyphosate-resistant weeds requires farmers to spray additional herbicides, including older herbicides posing documented environmental and public health risks and/or newer, more costly herbicides to avoid crop yield losses and slow the spread of these weeds. This is particularly problematic in grain and row-crop fields planted for several years with Roundup Ready GE crops.”]
USDA data shows that total herbicide use (weight of active ingredients) on corn has increased ~50% from 2005 to 2021.[1] Planted acres increased ~11% during that time.[2]
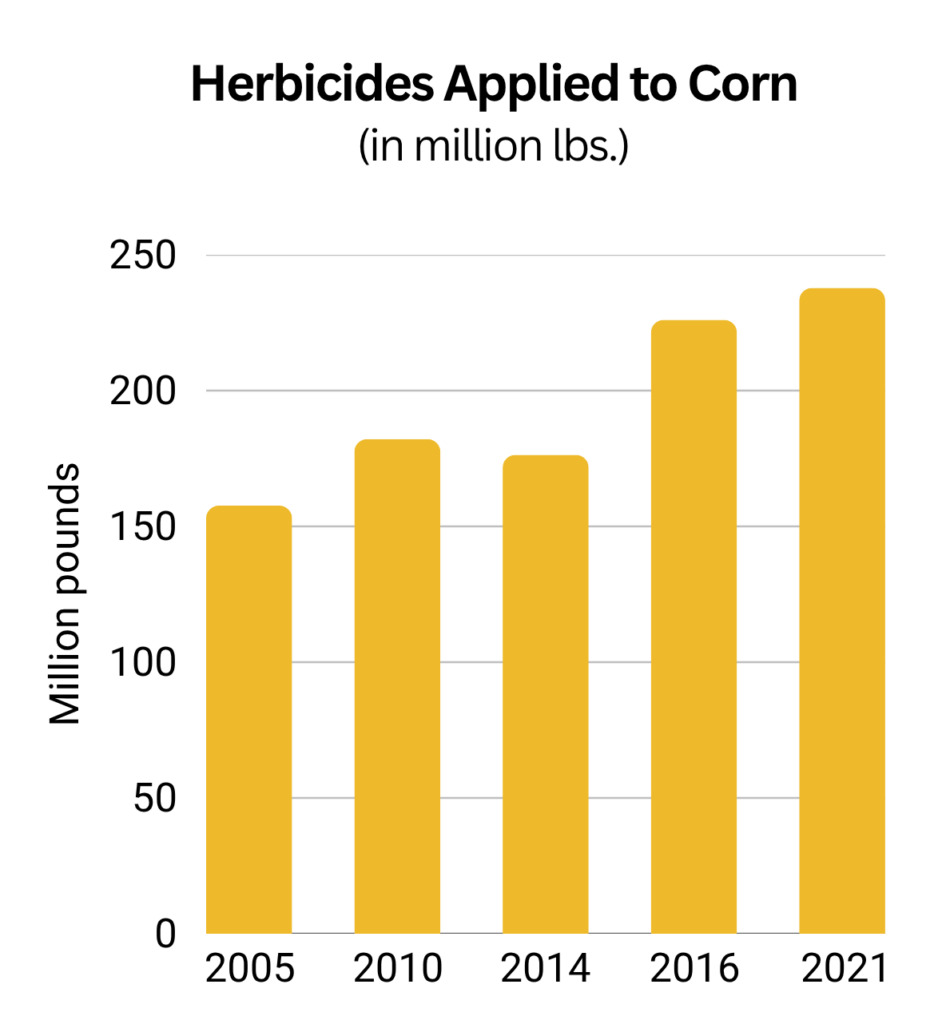
Herbicide use for Corn and Soybeans is from USDA NASS QuickStats, Survey/Environmental/Corn & Soybeans/Herbicide applications in lbs./Total Herbicide use.
Planted acres for the selected years in the charts above from USDA NASS Acreage Reports, released annually.
See also, Singh, M., & Jhala, A. J. (2025) Perspectives on the economics of herbicide usage in corn and soybean production in the United States. Weed Technol. 39(e48), 1–10, p. 7. [Compared to 2021 “total herbicide use increased by 50% (71.9 to 107.8 million kg) compared to 2005.”]
USDA data shows that total herbicide use (weight of active ingredients) on soybeans has more than doubled from 2005 to 2023. Planted acres increased ~14% during that time.[1-3]
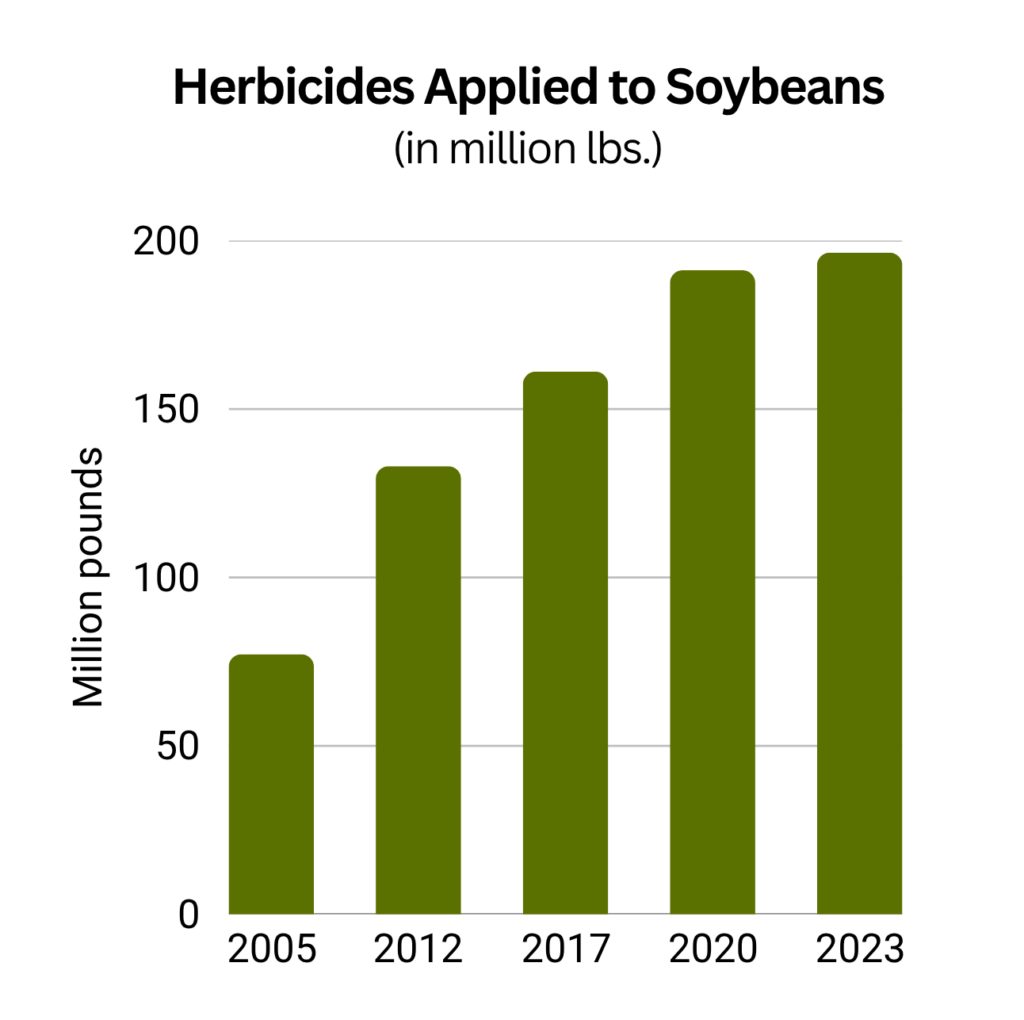
Herbicide use for Corn and Soybeans is from USDA NASS QuickStats, Survey/Environmental/Corn & Soybeans/Herbicide applications in lbs./Total Herbicide use]
Planted acres for the selected years in the charts above from USDA NASS Acreage Reports, released annually.
See also, Singh, M., & Jhala, A. J. (2025) Perspectives on the economics of herbicide usage in corn and soybean production in the United States. Weed Technol. 39(e48), 1–10, p. 7. [For soybeans in 2023, “total herbicide use more than doubled, rising by 116% (41.3 to 89.1 million kg) compared to 2005.”]