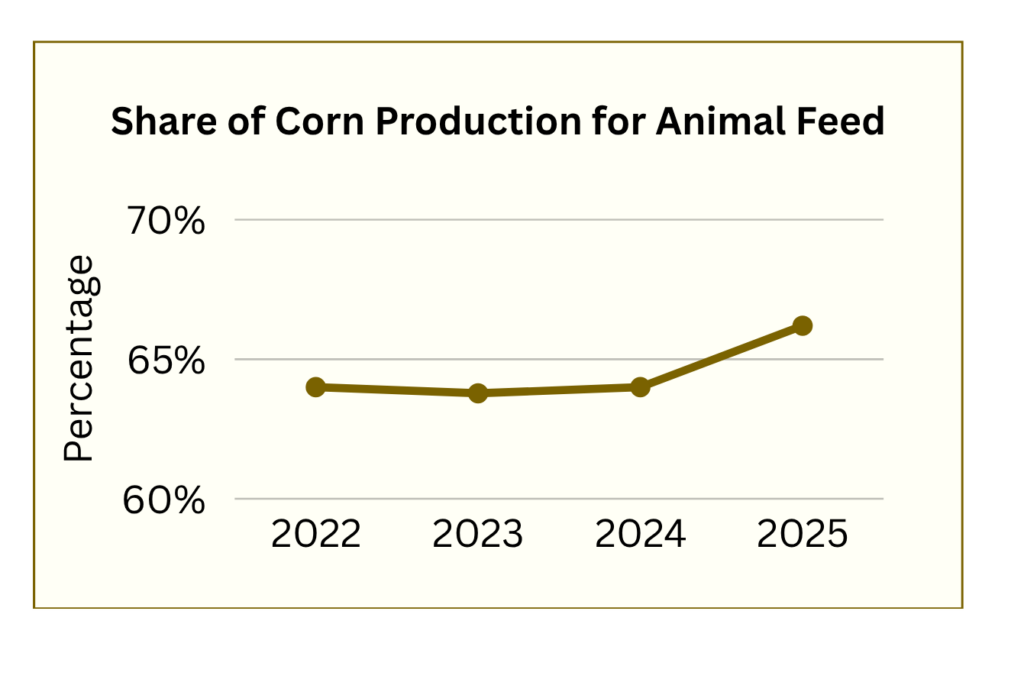
About 65% of corn production goes to animal feed. This is a 4-year average from 2022-2025.
For years, the USDA has estimated that ~40% of “total domestic corn use” goes to animal feed.[1] This figure is often picked up as all corn going to animal feed when, in fact, it is only that share of corn grain that goes to domestic feed. However, when considering all corn production, the following should also be included:
![]() Exports used for animal feed – About 70% of corn grain exports go to animal feed.
Exports used for animal feed – About 70% of corn grain exports go to animal feed. ![]() Corn silage – Whole corn plants harvested from millions of acres are fed directly to farmed animals.
Corn silage – Whole corn plants harvested from millions of acres are fed directly to farmed animals.![]() Dried distiller grains (DDGs) – This is a coproduct of ethanol used almost exclusively as animal feed.[2]
Dried distiller grains (DDGs) – This is a coproduct of ethanol used almost exclusively as animal feed.[2]
USDA Economic Research Service (May 7, 2026) Feed Grains Sector at a Glance. https://www.ers.usda.gov/topics/crops/corn-and-other-feed-grains/feed-grains-sector-at-a-glance/
David Olson & Thomas Capehart, USDA Economic Research Service (2019) Dried Distillers Grains (DDGs) Have Emerged as a Key Ethanol Coproduct. https://www.ers.usda.gov/amber-waves/2019/october/dried-distillers-grains-ddgs-have-emerged-as-a-key-ethanol-coproduct/ [“Dried distillers grains are a major coproduct from the production of ethanol from grain. DDGs are typically used as a protein-rich animal feed.”]
We use USDA data from Feed Grain Yearbook Tables, Foreign Agricultural Trade Service, Bioenergy Statistics, and annual acreage reports.[1-3]
Year-to-year figures may fluctuate, though an analysis of the last 4 years shows fluctuations within one percentage point. We would expect fluctuations to stay under 2 percent unless there is significant change in animal-sourced food consumption or factory farming practices.
The share of corn for animal feed for 2022-2025 was estimated per the analysis in the Q&A’s below.
This is an estimate based on many calculations, some of which are complex. The figures are almost all based on USDA data. However, there are some broadly estimated figures within their data, and the percentages of animal feed are measured with different metrics. The percentage of exports used for feed is based on weight. The percentage of corn silage is based on acreage harvested. The percentage of DDGS is based on coproduct values.
Note that animal feed usage is calculated as a percent of “Total use” rather than “production.” Total use (sometimes called disappearance) refers to the usage in a single year. It can be different from production because of imports and changes in beginning and ending stocks. It is therefore a good reflection of annual usage. However, corn silage is not a part of the USDA’s regular corn calculations. It is treated as a separate crop since it is not harvested as bushels, but rather as the entire corn plant. Therefore, corn silage is calculated as a percent of total cropland harvested for corn and for corn silage.
The USDA Feed Grains Yearbook Tables are updated monthly, and past figures may be adjusted. There will be slight changes depending on when the tables are accessed. These updates are usually small and should only slightly affect the overall percentage of corn used for animal feed.
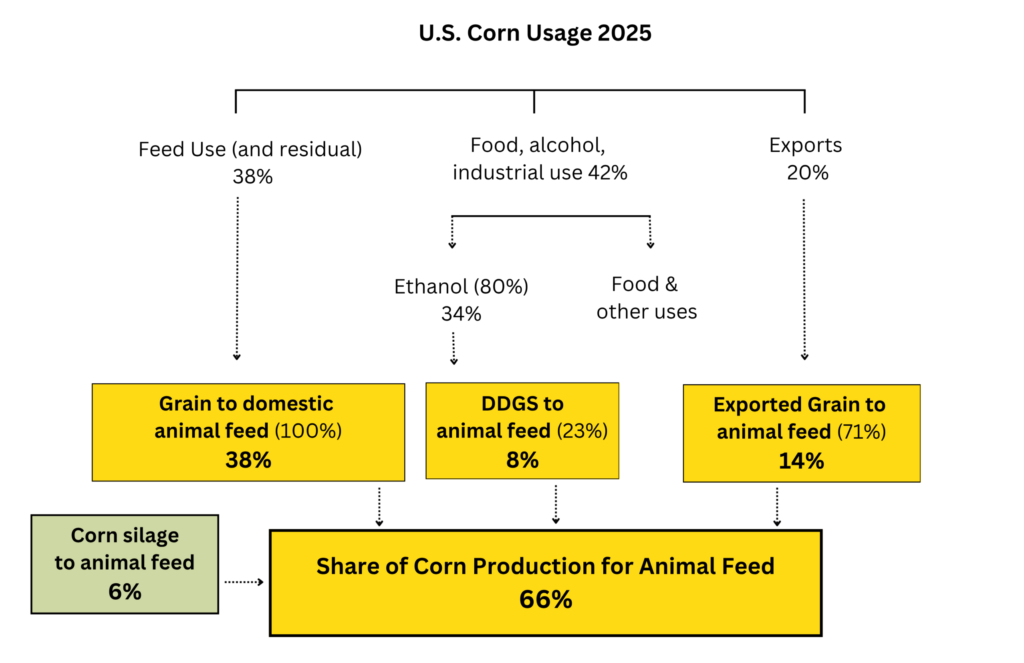
![]() About 38% (by weight) of corn total use is directly used for domestic animal feed.
About 38% (by weight) of corn total use is directly used for domestic animal feed.![]() About 8% (by value) of corn is a coproduct of ethanol production used for animal feed.
About 8% (by value) of corn is a coproduct of ethanol production used for animal feed.![]() About 14% (by weight) of exported corn total use is used for animal feed.
About 14% (by weight) of exported corn total use is used for animal feed.![]() About 6% (by land use) of all corn cropland is harvested as corn silage and used for animal feed.
About 6% (by land use) of all corn cropland is harvested as corn silage and used for animal feed.
Totals may not always add due to rounding. See further details about each channel in the questions below.
In 2025, about 38% of total corn usage went directly to domestic animal feed under the USDA category “feed and residual use.”[1] There is some inherent uncertainty within this category since “residual” is, by definition, a “catchall” category used to balance beginning and ending stocks.[2]
However, the USDA regularly estimates the feed use of individual species by relying on the entire volume in the “feed and residual” category, referring to it as “implied feed use.” The agency’s estimates of feed consumption per Grain Consuming Animal Units (CGAU) reflect this.[3] Other USDA and USDA-supported reports also use the entire volume of the “feed and residual” category to estimate actual feed consumption figures by state or by species.[4] Therefore, we make the same assumption, using the full 37% as feed.
This figure of 38% does not include exports, silage, and DDGS, as analyzed below.
USDA ERS Feed Grains Yearbook Tables, table 4 Corn: Supply and disappearance, MY 2025-2026 (updated 6/13/26) [Domestic feed & residual use (6,350 million bushels) / Total use (16,580 million bushels) = 38.3%]
Tom Capehart, USDA Economic Research Service (2013) Feed Outlook: Special Article Animal Unit Calculations – First Projections for the 2013/14 Crop Year, p. 1. [“However, there is no survey or other direct measurement available for the volume of grains fed to livestock. As a result, feed use becomes part of the “residual” category of use after total supply and all other directly measurable usage categories have been estimated and accounted for in supply-and-use tables.”]
Feed Grains Yearbook Tables, table 29, Processed feeds: Quantities fed and feed per grain-consuming animal unit. [In 2025: Corn fed per GCAU = 161,297,490 metric tons, which is equivalent to 6,350 million bushels, or 38.3% of total disappearance.]
Tom Capehart, USDA Economic Research Service (2013), p. 2.
In 2025 about 14% of all corn grain was made up of exports that went to animal feed.
In total, the U.S. exported exported 3,325 million bushels of corn grain in 2025, which was ~20% of total use.[1] The top 10 export markets for U.S. corn accounted for ~88% of all corn exports.[2]
Weighting each country’s market share by the percent of corn used for feed, ~71% of exported corn grain goes to animal feed in these top 10 countries.[3] We assume that the share of corn used for animal feed in the export markets outside the top 10 is about the same and apply that figure to all corn grain exports used for feed. Therefore ~14% of total corn grain was exported for feed.
In addition, about 25-30% of DDGS processed in the U.S. is exported for animal feed.[4]
USDA ERS Feed Grains Yearbook Tables, table 4 (updated 6/13/26) Corn: Supply and disappearance, MY 2025-26.
USDA Foreign Agricultural Trade of the United States, Top 10 U.S. agricultural export markets for wheat, corn, soybeans, and cotton, by volume, Feb. update of Dec. 2025 data (Jan – Dec 2025)
USDA Foreign Agricultural Service, Production, Supply and Distribution (PS&D) database, reporting period July 2026 for year 2025. [Analysis: Grains/Corn/Countries and calculating feed & residual use (in metric tons) as a percentage of total consumption. Corn used as feed in top 10 countries = 51,374,992 metric tons / 72,333,116 metric tons of total U.S. corn exports to the top 10 countries.]
David Olson and Thomas Capehart (October 1, 2019) Dried Distillers Grains (DDGs) Have Emerged as a Key Ethanol Coproduct. Amber Waves, USDA. https://www.ers.usda.gov/amber-waves/2019/october/dried-distillers-grains-ddgs-have-emerged-as-a-key-ethanol-coproduct
In 2025, about 6% of total corn acreage was corn silage, all used for animal feed. This figure is based on the acres of silage harvested as a share of the total of acres harvested for both silage and grain. The USDA does not count corn silage in their tally of corn use presumably because the end product (tons of silage) is not comparable to bushels of corn. Still, the similar resource usage (land, water, soil, fertilizers and pesticides) warrants the inclusion of corn silage in any tally of corn production used for animal feed.
Corn silage is a forage crop, roughly a 50:50 blend of stems and leaves to grain, used primarily to feed dairy cows but also used as feed on some beef cattle operations.[1,2] It is generally seen as a separate cropping system, but a “producer may decide partway through the season to harvest the corn crop as silage, rather than wait to harvest as grain, depending on market and weather conditions.”[3]
In 2025, the area harvested for grain was 91,258,000 acres. The area harvested for corn silage was 6,208,000 acres.[4-6]
Penn State Extension (2001) Corn Silage Production and Management. [“Corn silage is roughly 50:50 blend of grass stem and leaves to grain, and is considered by nutritionists and farmers a forage crop for ruminants, primarily dairy cows.”]
Dr. Jason Smith, Univ. of Tennessee Inst. Of Agriculture (2019) Corn Silage for Beef Cattle, 2019 Tri-State Beef Conference, Blountville, TN.
Field to Market (2021) Environmental Outcomes from On-Farm Agricultural Production in the United States, 4th edition, p. 20. https://fieldtomarket.org/national-indicators-report/report-downloads/
USDA NASS Acreage report (June 30, 20256 ISSN 1949-1522, table: Crop Area Planted and Harvested, Yield, and Production in Domestic Units, 2025, p. 32.
Calculation: 6,208,000 acres / 97,466,000 acres (the total of grain and silage harvested acres) = 6.4%.
Both the acreage and the value of corn silage may be slightly underestimated in this figure. Some corn silage (stalks and grain) is used directly for pasture, either from damaged or unharvested crops. Additionally, there is some value in the corn stalks that remain after the grain is harvested. See, for example: Shelia Grobosky (October 2021) Corn stalks, most underutilized feed resource, Wisconsin State Farmer. https://www.wisfarmer.com/story/news/2021/10/27/corn-stalks-most-underutilized-feed-resource/8515915002/
In 2025, about 8% of all corn disappearance went to dried distiller grains (DDGs), a product used for animal feed. This is calculated by approximate value, rather than weight (which would generate a higher percentage).
About 34% of corn is used for ethanol production. Of that, ~23% by value ends up as DDGs, a coproduct of ethanol.[1] DDGs (also known as DDGS when including “solubles” as is common) are almost exclusively used for animal feed.[2,3]
The sources used for these calculations are noted below.[4-8] Other assumptions are made to arrive at this estimate.[9]
In 2022 this calculation came out to 8.4%, in 2023 to 7.6%, and in 2024 to 7.8%.[10]
Calculation is based on the following 2025 values: $4.29 Avg price for bushel of corn; $1.68 Avg price for gallon of ethanol, $178.8 Avg price per ton of DDGS, $0.54 Avg price of corn oil per pound. Based on these figures $4.70 is the value of ethanol per bushel (= price of one gallon x 2.8); $1.52 is the value of DDGS per bushel (= price per ton x .0085); $0.38 is the value of corn oil per bushel (= oil per pound x .7); $6.60 is the total value created from one bushel of corn. $1.52/ $6.60 = 23%; 23% of 33.5% (share of corn used as ethanol) = 7.71%.
David Olson & Thomas Capehart, USDA Economic Research Service (2019) Dried Distillers Grains (DDGs) Have Emerged as a Key Ethanol Coproduct. [“DDGs are typically used as a protein-rich animal feed.” “DDGs are most commonly used in feeding cattle, dairy cows, swine, and some poultry.”]
Kurt Rosentrater, Distillers Grains Technology Council, Distillers Dried Grains with Solubles (DDGS) – An Effective and Available Livestock and Poultry Feed Ingredient, Iowa State Univ. [“Animal feed is the most important use for ethanol coproducts (more than 99%, in fact).”]
USDA Economic Research Service (updated July 2026) U.S. Bioenergy Statistics, tables 5, 9, and 15. Marketing Year 2025.
CME Group (2010) Commodity Products: Trading the Corn for Ethanol Crush, “The Corn Crush Spread” https://www.cmegroup.com/trading/agricultural/files/AC-406_DDG_CornCrush_042010.pdf
Scott Irwin, Dept. of Agricultural and Consumer Economics, Univ. of Illinois (2016) The Profitability of Ethanol Production in 2015. https://farmdocdaily.illinois.edu/2016/01/the-profitability-of-ethanol-production-in-2015.html
Agricultural Marketing Resource Center (2022) Ethanol, Iowa State Univ. and USDA. https://www.agmrc.org/renewable-energy/ethanol
Note: By weight, DDGS makes up a higher percentage of ethanol coproducts. A bushel of corn weighing 56 pounds generates about 17 pounds of DDG or DDGS (about 30%). But we think that the value of the products is a better index. For those who would argue that DDG/DDGS is a by-product and therefore not a generator of usage, we think the opposite may be true. It seems likely that without the extra value of the animal feed, and additionally without the vast amount of cropland and infrastructure that had already been devoted to growing feed for animals, corn ethanol would never have been viable and is likely still not viable today.
Although distiller’s corn oil is used for animal feed, we don’t know how common it is, and have therefore removed the value of the corn oil and only used the value of the DDGs. See, U.S. Grains Council, DDGS User Handbook, 4th ed., Chemical Composition and Energy Value of Distillers Corn Oil for Swine and Poultry, p. 15. [“Distillers Corn Oil is used as a high quality energy source primarily in poultry and swine diets because of its high metabolizable energy (ME) content and relatively low price compared with other feed fats and oils.”] Also see, Sampath Jayasinghe (2016) Recent Trends in Ethanol Profitability: The Contribution of Distillers Corn Oil, Iowa Grain Quality Initiative, Iowa State University. [“In addition to the biodiesel market, DCO (Distillers Corn Oil) has become a vegetable fat supplement for the livestock and poultry industry, but it’s hard to estimate how much is used in the animal feeding industry.”]
These figures are similar to an estimate by the National Corn Growers Association at 7.02% for the value of “Ethanol – Animal Feed” for 2025 based on “revenue per acre by segment” from: National Corn Growers Association – World of Corn. https://ncga.com/world-of-corn/dashboard/u-s-corn-usage-by-segment-1