
PM stands for particulate matter and the 2.5 means 2.5 microns or less in diameter (much less than the width of a human hair). Because PM2.5 gets deep into the airways and bloodstream, exposure can damage a person’s lungs and heart.[1]
Particulate matter has been designated by the EPA as one of six criteria air pollutants for which the agency has set National Ambient Air Quality Standards.[2]
PM2.5 is also referred to as “fine particulate matter,” in contrast to PM10, a coarser form of particulate matter that tends to be somewhat less damaging, with more localized effects and shorter life spans.[3]
U.S. EPA (June 20, 2024) Particulate Matter (PM) Basics https://www.epa.gov/pm-pollution/particulate-matter-pm-basics#PM
U.S. EPA (2024) Criteria Air Pollutants. https://www.epa.gov/criteria-air-pollutants
U.S. EPA (2020) Policy Assessment for the Review of the National Ambient Air Quality Standards for Particulate Matter, EPA-452/R-20-002, pp. 2-3. [“Atmospheric lifetimes are generally longest for PM2.5, which often remains in the atmosphere for days to weeks before being removed by wet or dry deposition.” PM10 (particles larger than PM2.5 but smaller than 10 microns) are “generally removed from the atmosphere within hours, through wet or dry deposition.”]
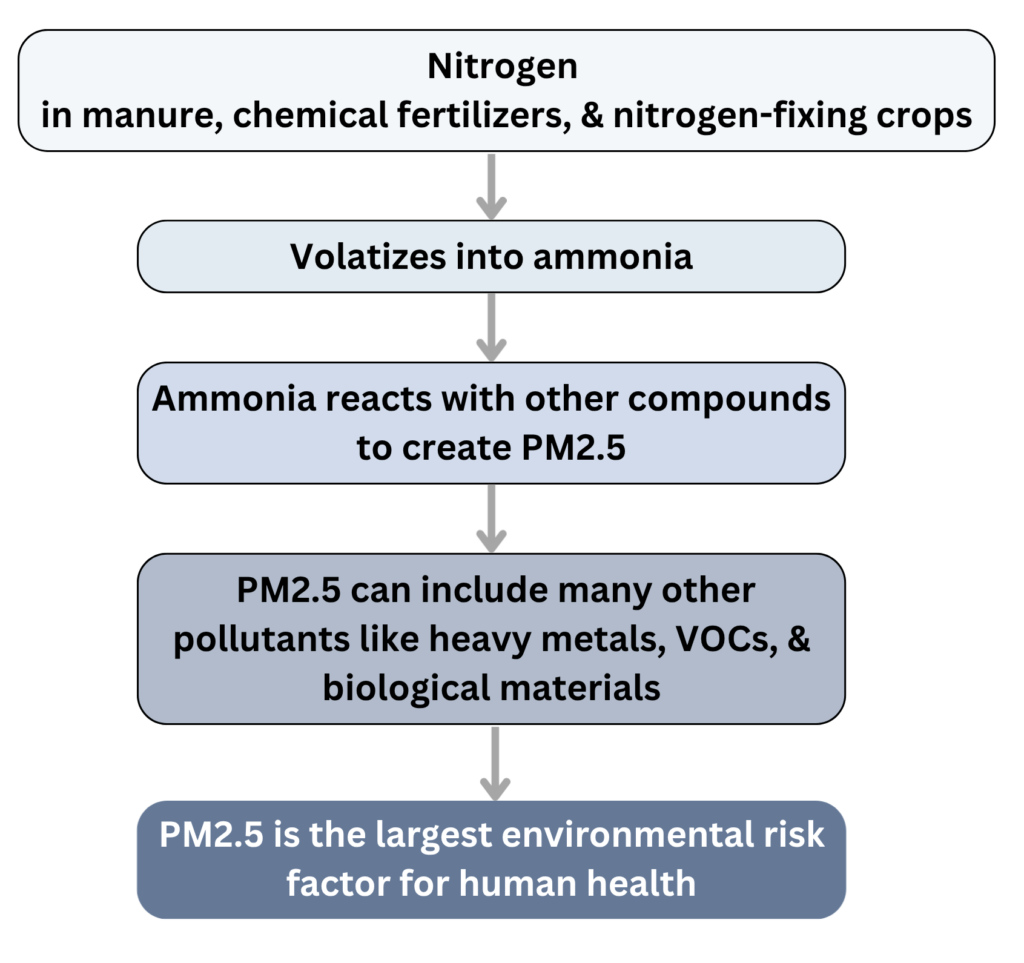
1. Reactive nitrogen is created via the Haber-Bosch process, mostly for use in chemical fertilizers, and by nitrogen-fixing crops (primarily soybeans and alfalfa/hay) that take inert nitrogen from the air and turn it into a usable form of nitrogen.[1,2]
2. Excess nitrogen applied to crops as chemical fertilizer or manure volatilizes into ammonia, along with fixed nitrogen left in the soil and in plant residue.[3,4]
3. The nitrogen in farmed animal manure begins volatizing into ammonia upon excretion and throughout the manure storage processes.[5,6]
4. Ammonia then reacts with aerosols and other compounds to create PM2.5.[7]
5. PM2.5 can be made up of a wide range of other pollutants including heavy metals, volatile organic compounds, and biological materials including bacteria and viruses.[8,9]
6. PM2.5 is the largest environmental health risk factor in the United States.[10]
U.S. EPA (2011) Reactive Nitrogen in the United States: An Analysis of Inputs, Flows, Consequences, and Management Options, A Report of the EPA Science Advisory Board, p. 3. [. [“This deficiency led to what has been called one of the world’s most important discoveries – how to extract N2 from the atmosphere and convert it to ammonia (NH3) – called the Haber-Bosch process.”]
Davidson, E. A., et al., (2011). Excess nitrogen in the US environment: trends, risks, and solutions. Issues in ecology, (15), p.3. [“Soybean production has been increasing, which increases biological nitrogen fixation in croplands.”]
U.S. EPA (2024) 2020 NEI Supporting Data and Summaries – Data Queries for Sector Summaries.
[Query: National/Ammonia NH3/Livestock Waste (49.2%), fertilizer application (33.5%), agricultural field burning (2.7%) of total (5,482,484 tons)]U.S. EPA (2011) Reactive Nitrogen in the United States, p. 22. [ “Management of biologically fixed N, insofar as it is possible, is proportionally as critical a task as the management of synthetic N because Nr from BNF is prone to the same loss pathways as Nr from commercial fertilizers.”]
Rotz, C. A. (2004). Management to reduce nitrogen losses in animal production. Journal of animal science, 82 (suppl_13), E119-E137, Table 2. [“Volatile loss begins soon after excretion, and it continues through all manure handling processes until the manure nutrients are incorporated into soil.” “The primary pathways of N loss are volatile emissions into the atmosphere and leaching and runoff losses to ground and surface waters.” pp. E-119 and 120]
Giannadaki, D., et al., (2018). Estimating health and economic benefits of reductions in air pollution from agriculture. The Science of the Total Environment, 622–623, 1304–1316, p. 1305. [“The main pollutant from agricultural activity is ammonia (NH3), mainly from animal husbandry and its associated manure processing, and to a lesser extent from fertilizer use.”]
Wyer, K. E., et al., (2022). Ammonia emissions from agriculture and their contribution to fine particulate matter: A review of implications for human health. Journal of Environmental Management, 323, 116285–116285, p. 5. [“Gaseous NH3 reacts with aerosols containing sulphuric and nitric acids to create particulates such as ammonium nitrate (NH4NO3), ammonium sulphate ((NH4)2SO4), and ammonium chloride (NH4CL).”]
Thangavel, P., et al., (2022). Recent insights into particulate matter (PM2.5)-mediated toxicity in humans: an overview. International journal of environmental research and public health, 19(12), 7511, pp. 3-4. [“The major components in PM2.5 are black carbon, polycyclic aromatic hydrocarbons, aryl hydrocarbons, volatile organic hydrocarbons, heavy metals organic compounds, minerals, inorganic ions, and biological materials, which collectively make up at least 79–85% of the total mass.”]
McEachran, A. D., et al., (2015). Antibiotics, bacteria, and antibiotic resistance genes: aerial transport from cattle feed yards via particulate matter. Environmental Health Perspectives, 123(4), 337–337.
Tessum, C. W., et al., (2019). Inequity in consumption of goods and services adds to racial–ethnic disparities in air pollution exposure. PNAS, 116(13), 6001–6006, p. 6001. [“Fine particulate matter (PM2.5) air pollution exposure is the largest environmental health risk factor in the United States.”]
PM2.5 can travel hundreds of miles to upwards of a thousand miles.[1-3] It generally stays in the atmosphere for “days to weeks before being removed by wet or dry deposition.”[4]
Goodkind, A. L., et al., (2019). Fine-scale damage estimates of particulate matter air pollution reveal opportunities for location-specific mitigation of emissions. PNAS, 116(18), 8775-8780, Abstract. [“We find that 33% of damages occur within 8 km of emission sources, but 25% occur more than 256 km away…”]
Emert, A. D., et al., (2024). USEPA CALPUFF validation and dispersion modeling of beef cattle feedlot PM10 and PM2.5 emissions factors. Atmospheric Environment (1994), 316, 120189, p. 2. [“…capable of atmospheric transport exceeding hundreds of kilometers…”]
Aneja, V. P., et al., (2008). Ammonia assessment from agriculture: US status and needs. Journal of Environmental Quality, 37(2), 515-520. [“ammonium aerosols might travel as far as 2500 km…”]
U.S. EPA (January 2020) Policy Assessment for the Review of the National Ambient Air Quality Standards for Particulate Matter. EPA-452/R-20-002, pp. 2-3. [“Atmospheric lifetimes are generally longest for PM2.5, which often remains in the atmosphere for days to weeks before being removed by wet or dry deposition.”]
Data from the 2020 EPA’s National Emissions Inventory [NEI] assesses that agriculture is responsible for 91% of total anthropogenic U.S. ammonia emissions.[1] This is similar to global estimates of about 80-90%.[2,3]
U.S. EPA (2024) 2020 NEI Supporting Data and Summaries – Data Queries for Sector Summaries. [Query: National/Ammonia NH3/Livestock Waste (49.2%), Fertilizer Application (33.5%), Agricultural Field burning (2.7%) of total. Total ag ammonia (4,675,035) / total ammonia (5,482,484 tons) = 85.3%. EPA includes 321,482 tons of ammonia from unprescribed wildfires in total ammonia; not including this in total ammonia (thereby considering only anthropogenic) makes ag contribution ~91%.]
Van Damme, M., et al., (2021). Global, regional and national trends of atmospheric ammonia derived from a decadal (2008–2018) satellite record. Environmental Research Letters, 16(5), 055017. [“For 2015, the Emission Database for Global Atmospheric Research (EDGAR) v5.0 reports a global emission total of 49.1 TgNH3, with 85.7 % originating from agriculture.”]
Nair, A. A. & Yu, F. (2020). Quantification of Atmospheric Ammonia Concentrations: A Review of Its Measurement and Modeling. Atmosphere, 11(10), 1092, p. 9. [“Approximately 60% of total NH3 emissions are from anthropogenic sources, of which 80–90% are from agricultural activity (fertilizers and livestock wastes).”]
About 25% of U.S. anthropogenic PM2.5 pollution comes from agriculture, broadly estimated from many reports.[1-7] It is likely that the share of ammonia, which remains unregulated by the EPA, has likely increased since some of these reports made their assessments.[8]
This is in stark contrast to the decrease in 2 other key precursors of PM2.5 – sulfur dioxide and nitrogen oxides – which are regulated by federal and state governments.[9]

Overall, average PM2.5 levels have decreased.[10] However, continuing animal ag ammonia emissions, increasing PM2.5 from wildfires, and the expanding understanding of air pollution’s severe health risks, will undoubtedly force this subject into the public’s purview.
Lelieveld, J., et al., (2015). The contribution of outdoor air pollution sources to premature mortality on a global scale. Nature, 525(7569), 367-371, Table 2. [In 2010, estimates 29% from agriculture. This is for U.S. “premature mortality linked to outdoor air pollution,” ~93% from PM2.5. (in “Americas”), = ~27% from agriculture.”]
Thakrar, S. K., et al., (2020). Reducing Mortality from Air Pollution in the United States by Targeting Specific Emission Sources. Environmental Science & Technology Letters, 7(9), 639–645, Figure 3. [“Our focus is on PM2.5…” Of a total of 19,000 deaths from food and agriculture, “livestock rearing” is responsible for ~8,400 deaths and crop production adds 6,600 in the year 2015. Therefore 15,000 deaths divided by 100,000 total = ~15%.]
Gu, B., et al., (2021). Abating ammonia is more cost-effective than nitrogen oxides for mitigating PM2. 5 air pollution. Science, 374(6568), 758-762, Table S-1. [In North America in 2013, NH3 contribution to PM2.5 = 35.8%. Agriculture’s share of NH3 (see previous question) = 91%. Therefore, agriculture’s contribution estimated at ~33% based on NH3 alone. Note that “The N-shares of total Nr emissions are much smaller than the sum of N-shares from NH3 and NOx separately (Fig. 1) because of the interactions between NH3 and NOx during secondary PM2.5 formation.” at p. 1]
Bauer, S. E., et al., (2016). Significant atmospheric aerosol pollution caused by world food cultivation. Geophysical Research Letters, 43(10), 5394–5400, Figure 1. [“Agriculture is responsible for about half of the total anthropogenic pollution in both the eastern and western United States.” (p. 5396). Referring to PM2.5 pollution and assessing the year 2010.]
Wyer, K. E., et al,. (2022). Ammonia emissions from agriculture and their contribution to fine particulate matter: A review of implications for human health. Journal of Environmental Management, 323, 116285–116285, p. 1. [“NH3 emissions from agriculture are responsible for 30% of all PM2.5 in the US…” (reference to Bauer et al., (2016) and specifically the share due to ammonia, in 2010.]
Tschofen, P., et al., (2019). Fine articulate matter damages and value added in the US economy. PNAS, 116(40), 19857–19862. [Gross external damages for agriculture at ~28% of total gross external damages for 2014. This is based on Figure 2, p. 19859 – calculated at $225B/$795B. “Indeed, farms have become the largest contributor to air pollution damages from PM2.5 -related emissions.” Abstract]
Tessum, C. W., et al., (2019). Inequity in consumption of goods and services adds to racial–ethnic disparities in air pollution exposure. PNAS, 116(13), 6001–6006. [In 2015, of 102,000 PM2.5 related deaths (p. 6001), ~15,000 are due to agriculture (see supplementary info p. 2), or ~15%.]
See, Animal Agriculture Share of Anthropogenic Ammonia Emissions 2020. https://docs.google.com/spreadsheets/d/1naMuMuWYGUU9cvN8FoXni9TkfM65s85DGajbWqSP7xw/edit?gid=0#gid=0
U.S. EPA (2022) Our Nation’s Air – Trends Through 2021, Factsheet. https://gispub.epa.gov/air/trendsreport/2022
U.S. EPA (2022) Particulate Matter Trends – National Trend Starting in 2000. https://gispub.epa.gov/air/trendsreport/2022/documentation/AirTrends_Flyer.pdf
[2000 average = 13.456 ug/m3, 2007 = 11.929, 2024 = 7.332. 2000 to 2024 = 46% reduction. 2007 to 2024 = 39% reduction.]
Globally, air pollution is considered the 2nd largest contributor to disease and premature death, behind high blood pressure.[1,2] PM2.5 is the largest contributor to air pollution deaths and considered the largest overall environmental health risk.[3,4]
Hay, S. I., et al., (2025). Burden of 375 diseases and injuries, risk-attributable burden of 88 risk factors, and healthy life expectancy in 204 countries and territories, including 660 subnational locations, 1990–2023: a systematic analysis for the Global Burden of Disease Study 2023. The Lancet, 406(10513), 1873-1922, p. 1873. [“Globally, the five level 3 risk factors contributing the highest proportion of risk-attributable disability-adjusted life-years (DALYs) were high systolic blood pressure (SBP), particulate matter pollution, high fasting plasma glucose (FPG), smoking, and low birthweight and short gestation…”]
Institute for Health Metrics and Evaluation (IHME). (2024). Global burden of disease 2023: findings from the GBD 2023 study, p. 13 [“2023 Rank – #2 – Particulate matter pollution.”]
Health Effects Institute (2025) State of Global Air 2025. Special Report. Boston, MA. [Air pollution trailing only high blood pressure, with 7.9 million total deaths in 2023 (p. 5). Of total air pollution deaths, 62% due to PM2.5. at p. 18]
Giannadaki, D., et al., (2018). Estimating health and economic benefits of reductions in air pollution from agriculture. The Science of the Total Environment, 622–623, 1304–1316, pp. 1304-1305. [“Air pollution by fine particulate matter (PM2.5) has been recognized as the prime environmental health risk (Burnett et al., 2014; Cohen et al., 2005; Ezzati et al., 2002; Krewski et al., 2009; Lim et al., 2013; Pope III et al., 2009;WHO, 2009).”]
In the U.S., PM2.5 is the largest cause of human mortality due to environmental factors, estimated to cause more than 60% of all premature deaths from environmental causes.[1,2]
PM2.5 from anthropogenic sources is estimated to be responsible for between 50,000 to 100,000 premature deaths per year, with the higher figures more commonly cited.[3-7] Deaths from firearms and motor vehicle crashes combined equal about 85,000 annually.[8]
Tessum, C. W., et al., (2019). Inequity in consumption of goods and services adds to racial–ethnic disparities in air pollution exposure. PNAS, 116(13), 6001–6006, p. 6001. [“Fine particulate matter (PM2.5) exposure is a major health risk factor in the United States, responsible for 63% of deaths from environmental causes and 3% of deaths from all causes.”]
Thakrar, S. K., et al., (2020). Reducing Mortality from Air Pollution in the United States by Targeting Specific Emission Sources. Environmental Science & Technology Letters, 7(9), 639–645. [“Exposure to air pollution remains the greatest environmental health risk factor in the United States…”]
Tessum, C. W., et al. (2019), p. 6001. [“We estimate a population-weighted average ambient PM2.5 exposure concentration of 7.7 µg m3 for the United States in 2015, causing 131,000 premature deaths. Of these, 102,000 are caused by US anthropogenic emissions…”]
Goodkind, A. L., et al., (2019). Fine-scale damage estimates of particulate matter air pollution reveal opportunities for location-specific mitigation of emissions. PNAS, 116(18), 8775-8780. [“We estimate that anthropogenic PM2.5 was responsible for 107,000 premature deaths in 2011…”]
Tschofen, P., et al., (2019). Fine particulate matter damages and value added in the US economy. PNAS, 116(40), 19857–19862, Table S-4 (supplementary data) [Total deaths PM2.5 = 54,000 to 86,000 depending on the model.]
Lelieveld, J., et al., (2015). The contribution of outdoor air pollution sources to premature mortality on a global scale. Nature, 525(7569), 367-371, Table 2. [Estimates 55,000 deaths in 2010 with more than 90% due to PM2.5]
Thakrar, S. K., et al., (2020), p. 642. [“Our focus is on PM2.5… We find 100,000 deaths each year (model range of 88000-107000) are attributable to human-caused emissions in the United States.]
CDC (2026) National Center for Health Statistics for 2024.
https://www.cdc.gov/nchs/fastats/injury.htm
It is estimated that more than 90% of U.S. air pollution-related health damages are attributable to PM2.5.[1-2]
This figure is in line with a major global finding, attributing more than 95% of air pollution deaths to PM2.5.[3]
Lelieveld, J., et al., (2015). The contribution of outdoor air pollution sources to premature mortality on a global scale. Nature, 525(7569), 367-371. [Estimates 55,000 U.S. deaths in 2010 with more than 90% due to PM2.5. See Table 1 (for Americas) and Table 2 (for USA). Estimates that globally 3.15 million of 3.3 million total deaths due to PM2.5 (~95%)]
Tschofen, P., et al., (2019). Fine particulate matter damages and value added in the US economy. PNAS, 116(40), 19857–19862, p. 19857. [“Among these are fine particulate matter, or PM2.5, which the Environmental Protection Agency (EPA) estimates is responsible for over 90% of air pollution-related health damages.”] This statement refers to: U.S. EPA (2011) The Benefits and Costs of the Clean Air Act from 1990 to 2020, Final Report – Rev. A.
Health Effects Institute (2024) State of Global Air 2024. Special Report. Boston, MA, p. 14. [Air pollution premature deaths at 8.1 million in 2021. Of total air pollution deaths, 7.8 million due to PM2.5, ~96%]
Researchers estimate ~15,000 premature deaths per year are due to PM2.5 from U.S. agriculture.[1-4]
Of these, the great majority are attributable to animal agriculture.[5,6]
Thakrar, S. K., et al., (2020). Reducing Mortality from Air Pollution in the United States by Targeting Specific Emission Sources. Environmental Science & Technology Letters, 7(9), 639–645. [Estimates deaths due to agriculture at 19,000 including 3,100 from food prep and processing (Figure 1)]
Domingo, N. G., et al., (2021). Air quality–related health damages of food. PNAS, 118(20), e2013637118, p. 1. [17,900 deaths due to agriculture, with more than 95% from PM2.5]
Tessum, C. W., et al., (2019). Inequity in consumption of goods and services adds to racial–ethnic disparities in air pollution exposure. PNAS, 116(13), 6001–6006. [“Agriculture (15,000 premature deaths): crop and livestock production.” (Supplementary Information, p. 2)]
Lelieveld, J., et al., (2015). The contribution of outdoor air pollution sources to premature mortality on a global scale. Nature, 525(7569), 367-371. [Estimates 29% of 55,000 deaths in 2010 or approximately 16,000 deaths (Table 2). Includes agriculture-related deaths due to ozone which are less than 10% (Table 1)]
Domingo, N. G., et al., (2021), p. 1. [17,900 deaths due to agriculture, with more than 95% from PM2.5. Of these, about 12,700 (~70%) “attributable to animal-based foods, both directly from animal production and indirectly from growing animal feed.”]
See, Ammonia’s Contribution to PM2.5 [question: How many human deaths are attributable to air pollution from animal ag?]