
Ammonia (NH3) is a precursor gas that reacts with aerosols (particles or droplets in the air or in gases) to form various chemical compounds, some of which take the form of PM2.5.[1]
Most air-borne ammonia is short lived and will be deposited within 2 or 3 miles of its source.[2,3] However, some portion of ammonia reacts with aerosols to create PM2.5 which can drift, creating damage hundreds of miles or even more than a thousand miles from the source.[4,5]
PM2.5 is considered the largest environmental health risk factor in the U.S.[6,7]
Wyer, K. E., et al., (2022). Ammonia emissions from agriculture and their contribution to fine particulate matter: A review of implications for human health. Journal of Environmental Management, 323, 116285–116285, p. 5. [“Gaseous NH3 reacts with aerosols containing sulphuric and nitric acids to create particulates such as ammonium nitrate, ammonium sulphate, and ammonium chloride.”]
Krupa, S. V. (2003). Effects of atmospheric ammonia (NH3) on terrestrial vegetation: a review. Environmental pollution, 124(2), 179-221, p. 181. [Ammonia life span of several hours to perhaps 1 to 4 days and a reach of .5 to 3 or 4 miles]
Nair, A. A., & Yu, F. (2020). Quantification of Atmospheric Ammonia Concentrations: A Review of Its Measurement and Modeling. Atmosphere, 11(10), 1092, p. 2. [“While ammonia itself has a very short atmospheric lifetime of a few hours to a day owing to rapid deposition and particle uptake, its particulate forms too have relatively short atmospheric lifetimes of under a week…”]
Goodkind, A. L., et al., (2019). Fine-scale damage estimates of particulate matter air pollution reveal opportunities for location-specific mitigation of emissions. PNAS, 116(18), 8775-8780. [“We find that 33% of damages occur within 8 km of emission sources, but 25% occur more than 256 km away…”]
Aneja, V. P., et al., (2008). Ammonia assessment from agriculture: US status and needs. Journal of Environmental Quality, 37(2), 515-520, p. 516. [“ammonium aerosols might travel as far as 2500 km…”]
Tessum, C. W., et al., (2019). Inequity in consumption of goods and services adds to racial–ethnic disparities in air pollution exposure. PNAS, 116(13), 6001–6006, p. 6001. [“Fine particulate matter (PM2.5) air pollution exposure is the largest environmental health risk factor in the United States.”]
For more info, see, Agricultural PM2.5 Pollution
Despite the severe health impacts and the massive amounts generated,[1,2] ammonia emissions from factory farms are essentially unmonitored and unregulated due to agricultural exceptionalism, the inherent complexity of monitoring many thousands of factory farm locations, and pushback from the USDA and the animal ag industry.
See, Animal Ag Ammonia and Human Health
See, Ammonia Emissions from Animal Ag
For more info see, Lack of Air Regulations
Several studies suggest that NH3 is the precursor gas with the most impact on PM2.5 formation.[1-4]
Nitrogen oxides and sulfur dioxide (the other key precursor gasses) have been sharply reduced over recent years, mostly from industrial sources.[5] This leaves NH3 as the highest priority for reducing PM2.5 creation and its accompanying human health risks, especially given the steadily increasing amounts generated and the potential for climate change to amplify that trend.[6,7]
Wyer, K. E., et al., (2022). Ammonia emissions from agriculture and their contribution to fine particulate matter: A review of implications for human health. Journal of environmental management, 323, 116285, p. 2. [“…studies have shown that NH3 is the precursor which has the biggest impact on the formation of this pollutant.”]
Gu, B., et al., (2021). Abating ammonia is more cost-effective than nitrogen oxides for mitigating PM2.5 air pollution. Science, 374(6568), 758-762, p. 1 & Abstract. [“We found that NH3 emission made a larger contribution to PM2.5 than NOx emission globally and in most countries, indicating that PM2.5 is more strongly NH3 limited than NOx limited. … so that reduction of NH3 emission also tends to reduce the contribution of NOx and SO2 to PM2.5 formation. … The marginal abatement cost of ammonia emission is only 10% that of nitrogen oxides emission globally, highlighting the priority for ammonia reduction.”]
Lelieveld, J., et al., (2015). The contribution of outdoor air pollution sources to premature mortality on a global scale. Nature, 525(7569), 367-371, p. 369. [“Since NH3 abundance is often limiting in PM2.5 formation, reduction of its emissions can make an important contribution to air quality control.”]
Megaritis, A. G.et al., (2013). Response of fine particulate matter concentrations to changes of emissions and temperature in Europe. Atmospheric Chemistry and Physics, 13(6), 3423-3443, p. 3427. [“The reduction of NH3 emissions by 50% seems to be the most effective control strategy in reducing PM2.5, in both periods mainly due to a significant decrease of ammonium nitrate.”]
U.S. EPA (2022) Our Nation’s Air – Trends Through 2021. https://gispub.epa.gov/air/trendsreport/2022
See, Animal Agriculture Share of U.S. Anthropogenic Ammonia Emissions 2020. https://docs.google.com/spreadsheets/d/1naMuMuWYGUU9cvN8FoXni9TkfM65s85DGajbWqSP7xw/edit?gid=0#gid=0 [Compared to the 5 year period from 2000 to 2004, total anthropogenic ammonia emissions for the period from 2020 to 2024 are up ~15%.]
Jiang, J., et al., (2026). Global warming increases ammonia emissions and reduces the efficacy of mitigation actions. Communications Earth & Environment, 7(1), 398, Abstract. [“Here, we show that global warming drives NH3 emission increases of 5-22% across plausible ranges of climate projections in 2091-2100, with > 10% regional increase in NH3 emissions per °C warming.”]
Yes. Many studies have concluded that the reduction of ammonia from agriculture is the most urgent, sensible, and cost-effective route to an overall reduction in PM2.5 in the U.S. atmosphere.[1-6]
Van Damme, M., et al., (2021). Global, regional and national trends of atmospheric ammonia derived from a decadal (2008–2018) satellite record. Environmental Research Letters, 16(5), 055017, pp. 1-2. [“In Europe, China and the U.S. in particular, reduction in emissions of nitrogen and sulfur oxides have demonstrably resulted in an increased amount of atmospheric gas-phase NH3 during the last decade [21–24]. Several studies have concluded that reducing NH3 emissions would be a cost-effective strategy to reduce PM2.5 concentrations.”]
Sutton, M. A., et al., (2020). Alkaline air: changing perspectives on nitrogen and air pollution in an ammonia-rich world. Philosophical Transactions of the Royal Society A, 378(2183), 20190315, pp. 2 & 7. [“Considering the present, across much of Europe and North America we now inherit a world where substantial emission controls have already been achieved for SO2 and NOx. … The reminder of ammonia as alkaline air is highly relevant to the present, as emissions of SO2 and NOx have decreased greatly over the last 30 years, leaving European and North American atmospheres increasingly rich in NH3.”]
Paulot, F., & Jacob, D. J., (2014). Hidden cost of US agricultural exports: particulate matter from ammonia emissions. Environmental science & technology, 48(2), 903-908. [“Previous work suggests that the average U.S. annual health cost (morbidity + mortality) of 1 kg of NH3 emitted to the atmosphere ranges from 3 to 13 US$ (2006) depending on the valuation method, 2 and 9 times greater than the cost of 1 kg of SO2 and NOx, respectively.”]
Pinder, R. W., et al., (2007). Ammonia emission controls as a cost-effective strategy for reducing atmospheric particulate matter in the eastern United States. Environ. Sci. Technol. 41, 380-386, p. 385. [“While there are definite challenges inherent in the policy options, ammonia emission reductions offer significant cost savings compared to further controls on SO2 and NOx.”]
Gu, B., et al., (2021). Abating ammonia is more cost-effective than nitrogen oxides for mitigating PM2.5 air pollution. Science, 374(6568), 758-762. [“North America has the largest benefit-to-cost ratio for NH3 mitigation, followed by Europe and Asia, suggesting reduction of NH3 emission as a favorable option to increase social benefit.” at p. 3. “The main opportunities for NH3 abatement concern agricultural sources, for which abatement measures are relatively easy and inexpensive.” at p. 4. Also see Supplementary Materials Table S-1: marginal abatement cost is less than 10% of marginal mortality cost.]
Lee, M., et al., (2025). Ammonia emissions from beef cattle feedyards: a review. Frontiers in Animal Science, 6, 1608387, p. 02. [“Since NH3 is a precursor gas that may be easier to mitigate than others among PM2.5’s other precursors, if ambient PM2.5 standards are further reduced, ambient air-quality standards for NH3 may be introduced.”]
Conservatively estimated, ~15-20% of PM2.5 comes from animal agriculture. This figure is based on an estimate that agriculture is responsible for ~20-25% of PM2.5, and animal ag is responsible for ~80% of agriculture’s ammonia contributions, by far the largest agricultural precursor gas.[1,2]
This may be an underestimate due to the steady decrease in precursor gases from all other industries, along with the increase in gases, especially ammonia, from animal agriculture.[3,4]
See, Agricultural PM2.5 Pollution [question: What share of PM2.5 pollution comes from U.S. agriculture?]
See, Animal Agriculture Share of U.S. Anthropogenic Ammonia Emissions 2020. https://docs.google.com/spreadsheets/d/1naMuMuWYGUU9cvN8FoXni9TkfM65s85DGajbWqSP7xw/edit?gid=0#gid=0 [Animal ag contributes ~79% of agricultural ammonia, the central agricultural PM2.5 precursor gas.]
U.S. EPA (2022) Our Nation’s Air – Trends Through 2021. [Sulfur dioxide emissions down 92% between 1990 and 2020 with the great majority of that reduction since 2000. Nitrogen oxides down 70%, with almost all that reduction since the year 2000.]
See, Animal Agriculture Share of U.S. Anthropogenic Ammonia Emissions 2020. https://docs.google.com/spreadsheets/d/1naMuMuWYGUU9cvN8FoXni9TkfM65s85DGajbWqSP7xw/edit?gid=0#gid=0 [Ammonia emissions increased about 15% between the periods 2000-2004 and 2020-2024.]
More than 10,000 U.S. deaths per year are attributed to air pollution from animal ag, mostly due to ammonia generated from manure and feed crop fertilizers transforming into PM2.5.[1-6]
Domingo, N. G., et al., (2021). Air quality–related health damages of food. PNAS, 118(20), e2013637118, p. 2. [“Of food-related damages, 80% (12,700 deaths) are attributable to animal-based foods (when impacts of animal feed production are included)…” About 95% of deaths are due to NH3 and PM2.5 per Fig. 1, p. 2]
Thakrar, S. K., et al., (2020). Reducing Mortality from Air Pollution in the United States by Targeting Specific Emission Sources. Environmental Science & Technology Letters, 7(9), 639–645, Figure 3. https://doi.org/10.1021/acs.estlett.0c00424. [“Our focus is on PM2.5…” Of a total of 19,000 deaths from food and agriculture, “livestock rearing” is responsible for ~8,400 deaths and crop production adds 6,600. We estimate that half of crop production deaths are from feed crops, bringing the total to ~11,700. Calculated an alternate way, about 17,300 deaths are attributed to NH3 of which about two-thirds is generated by animal ag, equaling ~11,600.]
Tschofen, P., et al., (2019). Fine particulate matter damages and value added in the US economy. PNAS, 116(40), 19857–19862, p. 19858. [“Agricultural gross external damage is driven by ammonia and primary particulate matter damages, which are caused primarily by livestock emissions and fertilizer application (NH3), and field burning, as well as combustion emissions from agricultural equipment and other crop-related activities (primary PM2.5).” Agriculture responsible for about 29% (230/796) of deaths from attributed sources. Total deaths = 54,000 to 86,000 depending on the model. At 29% this = from ~16,000 to ~25,000. Again assuming about two-thirds from animal ag (50% of NH3 from manure and about 17% from crops specifically for feed) then total deaths from animal ag = ~11,000 to 17,000.]
Note: we assume that ~50% of the ammonia from crops is due to crops specifically grown for feed. This is based on our estimate that ~40% of N from chemical fertilizers is applied to crops specially grown for animal feed (see, Chemical Fertilizer Use on Feed Crops) and a broad estimate that at least an additional ~10% comes from the approximately one-third of total crop acreage (~100m acres) allocated to soybeans and alfalfa, due to nitrogen fixation (about two-thirds used for animal feed). See: U.S. EPA (2011). Reactive Nitrogen in the United States, p. 22. [ “Management of biologically fixed N, insofar as it is possible, is proportionally as critical a task as the management of synthetic N because Nr from BNF is prone to the same loss pathways as Nr from commercial fertilizers.”]
Tessum, C. W., et al., (2019). Inequity in consumption of goods and services adds to racial–ethnic disparities in air pollution exposure. PNAS, 116(13), 6001–6006. [“Agriculture (15,000 premature deaths): crop and livestock production.” ~7,800 due to livestock and manure, and 5,900 due to crop production = ~10,800 deaths, again assuming half of crop production is due to feed crops. See Supplementary Information, Table S-2]
Lelieveld, J., et al., (2015). The contribution of outdoor air pollution sources to premature mortality on a global scale. Nature, 525(7569), 367-371. [Estimates 29% of 55,000 deaths in 2010 due to agriculture, or approximately 16,000 deaths (Table 2). Includes agriculture-related deaths due to ozone which are ~7% of deaths. The remainder is due to PM2.5. (Table 1)]
Yes, by wide margins. The EPA’s PM2.5 standard for a 24-hour concentration threshold is 35 ug/m3 (35 micrograms per cubic meter).[1] Reports have estimated levels inside factory farms at 5 to 100 times that limit.[2,3] Naturally, local ambient PM2.5 levels are also higher near factory farms.[4]
U.S. EPA (2025) Timeline of Particulate Matter (PM) National Ambient Air Quality Standards (NAAQS). https://www.epa.gov/pm-pollution/timeline-particulate-matter-pm-national-ambient-air-quality-standards-naaqs
Li, Q., et al., (2011). Fine particulate matter in a high-rise layer house and its vicinity. Transactions of the ASABE, 54(6), 2299-2310, p. 2303. [“The average concentration of PM2.5 inside the house was as high as 141 ug per m-3. This high concentration may potentially compromise the health of the workers and the production efficiency of the hens, and thus the profit of the farm.”]
Bist, R. B., & Chai, L., (2022). Advanced strategies for mitigating particulate matter generations in poultry houses. Applied Sciences, 12(22), 11323, Abstract. [“To protect public health and welfare, the occupational exposure limit for PM10 and PM2.5 are suggested not to exceed 150 ug/m3 and 35 ug/m3 respectively, based on 24-h concentrations thresholds as suggested by US EPA. However, the levels of PM10 and PM2.5 in poultry houses could be 100 times higher than that limit. For instance, PM10 and PM2.5 levels in cage-free henhouses are higher than 15,000 ug/m3 and 3,500 ug/m3 in wintertime.”]
Chamanara, S., et al., (2025). Geography of animal feeding operations and their contribution to fine particulate matter pollution in vulnerable communities in the United States. Communications Earth & Environment, 6(1), 620, p. 3. [“Using geographically optimized matching, we find that AFOs raise local PM2.5 levels by 28% near cattle operations and 11% near hog farms, even after accounting for urban and industrial confounders.”]
Yes, the EPA reports that PM2.5 levels from 2000 to 2024 have decreased by 46%.[1]
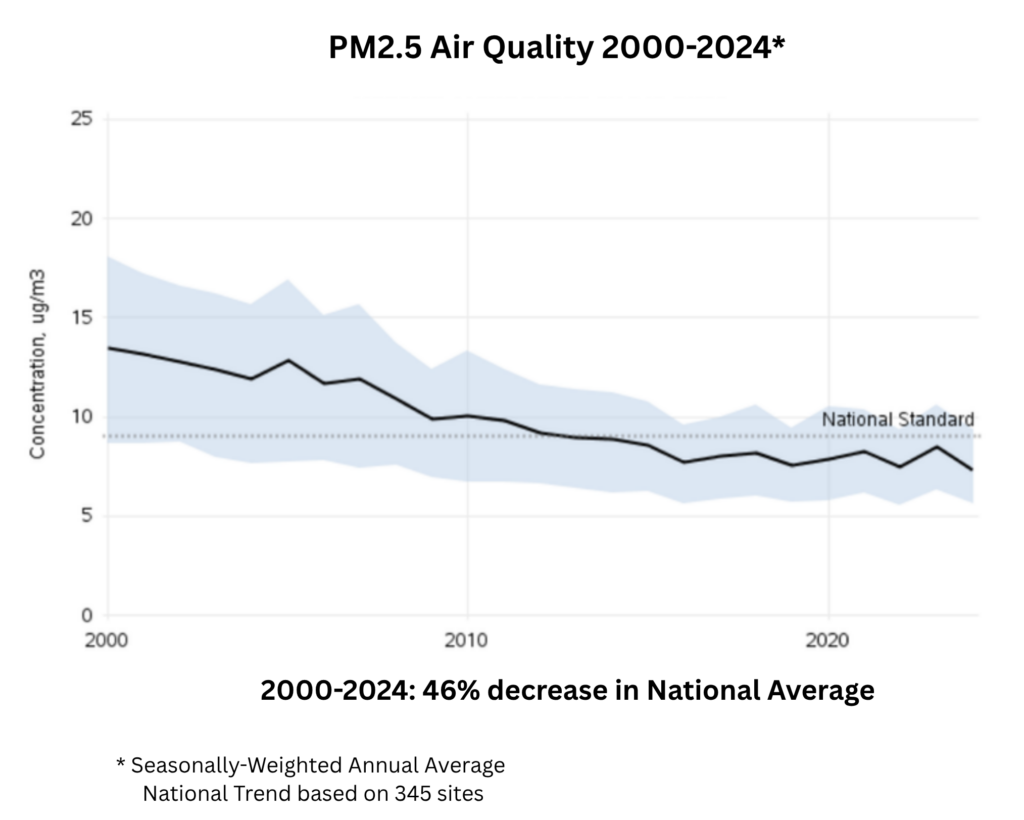
This is due to the reductions of 2 of the 3 major precursor gases – nitrogen oxides and sulfur dioxide.[2] However, steady or slightly increasing ammonia levels from animal ag along with increasing wildfires may slow or reverse this long-term trend.[3-7]
U.S. EPA (2026) Particulate Matter (PM2.5) Trends — National Trends (includes chart). https://www.epa.gov/air-trends/particulate-matter-pm25-trends
U.S. EPA (2022) Our Nation’s Air – Trends Through 2021. [Sulphur dioxide emissions down 92% between 1990 and 2020 with the great majority of that reduction since 2000. Nitrogen oxides down 70%, with almost all of that reduction since the year 2000]
See, Animal Agriculture Share of U.S. Anthropogenic Ammonia Emissions 2020. https://docs.google.com/spreadsheets/d/1naMuMuWYGUU9cvN8FoXni9TkfM65s85DGajbWqSP7xw/edit?gid=0#gid=0 [Ammonia emissions increased about 15% between the periods 2000-2004 and 2020-2024.]
Burke, M., et al., (2023). The contribution of wildfire to PM2. 5 trends in the USA. Nature, 622(7984), 761-766, p. 6. [“We show that recent increases in wildfire smoke have substantially slowed or reversed improvements in ambient PM2.5 concentrations throughout much of the USA…”]
Zhang, D., et al., (2023). Wildland fires worsened population exposure to PM2. 5 pollution in the contiguous United States. Environmental science & technology, 57(48), 19990-19998, p. 19996. [“Under the stricter standard of 9 ug/m3, the average affected population would increase to 167.23 million without considering the effect of fire smoke and 197.68 million with the contribution of fire smoke.”]
Ma, Y., et al., (2024). Long-term exposure to wildland fire smoke PM2. 5 and mortality in the contiguous United States. PNAS, 121(40), e2403960121, Abstract. [U.S. wildfires from 2007 through 2020 reported as “contributing to approximately 5% of all-source PM2.5.”]
Lee, H., & Jaffe, D. A. (2024). Wildfire impacts on O3 in the continental United States using PM2. 5 and a generalized additive model (2018–2023). Environmental science & technology, 58(33), 14764, Abstract. [“Days with smoke have an average of 11 µg m/3 more PM2.5 and… account for 94% of all days that exceed the daily PM2.5 health standard (35 µg m/3)…”]
The impact of PM2.5 on animals is not widely studied. However, logic and all available evidence suggests that the effects are similar to those in humans, including respiratory, cardiovascular, and many other diseases.[1-4]
Given that PM2.5 pollution is the number one environmental health risk for humans, it is likely that it is placing severe pressure on many wild species along with negatively affecting the health of farmed animals.[5,6]
Government of Canada (2018). Air pollution: effects on wild animals
https://www.canada.ca/en/environment-climate-change/services/air-pollution/quality-environment-economy/ecosystem/wild-animals.html [“Although not as well understood, other forms of air pollution, such as smog, particulate matter, and ground-level ozone, to mention a few, likely affect wildlife health in similar ways to human health including harming the lungs and cardiovascular systems.”]Losacco, C., & Perillo, A. (2018). Particulate matter air pollution and respiratory impact on humans and animals. Environmental Science and Pollution Research International, 25(34), 33901–33910, p. 33906. [“Particulate matter (PM) concentration has been linked with several clinical manifestations of pulmonary and cardiovascular diseases and is associated with morbidity and mortality induced by respiratory diseases both in human and animals.”]
Ferreira, A. P. S., et al., (2022). Experimental rodent models exposed to fine particulate matter (PM2. 5) highlighting the injuries in the central nervous system: A systematic review. Atmospheric Pollution Research, 13(5), 101407, p. 9. [“The reviewed findings provide important evidences that, exposure of whole or fractions components of the PM2.5, by the inhalation or absorption in any stage of life is strongly related to misfunction of the central nervous system.”]
Wang, X., et al., (2017). Exposure to concentrated ambient PM2. 5 shortens lifespan and induces inflammation-associated signaling and oxidative stress in Drosophila. Toxicological Sciences, 156(1), 199-207, Abstract. [“The survivorship curve demonstrated that exposure to concentrated ambient PM2.5 markedly reduced lifespan of Drosophila. … Similar to effects on humans, exposure to concentrated ambient PM2.5 leads to premature mortality likely through induction of inflammation-associated signaling, oxidative stress, and metabolic abnormality.”]
Wang, K., et al., (2023). Particulate matter in poultry house on poultry respiratory disease: a systematic review. Poultry Science, 102(4), 102556, p. 6. [“The hazardous effects of high concentrations of PM2.5 on the poultry respiratory tract and lungs make it difficult for poultry to be in a state of high-level production. … There is no doubt that PM impacts poultry respiratory health, where the poultry industry is responsible for significant annual losses from respiratory disease.”]
Beaupied, B. L., et al., (2022). Cows as canaries: The effects of ambient air pollution exposure on milk production and somatic cell count in dairy cows. Environmental research, 207, 112197. [“Our results suggest that ambient air pollution, specifically, fine particulate matter, is positively associated with somatic cell count and negatively associated with milk production in dairy cows.”]