Yes. The pivotal element in animal ag air pollution is nitrogen (N). Large quantities of excess nitrogen turn into ammonia, the primary agricultural air pollutant.[1,2]
Liu, L., et al.. (2022). Exploring global changes in agricultural ammonia emissions and their contribution to nitrogen deposition since 1980. PNAS, 119(14), e2121998119, p. 1. [“Nr compounds (reactive nitrogen) in the atmosphere are mainly controlled by the emissions of nitrogen oxides (NOx) and ammonia (NH3); NOx is mainly from the burning of fossil fuels for energy production and NH3 is mostly from agricultural sources including volatilized livestock waste and nitrogen (N)-based fertilizers.”]
See, Nitrogen, Air, and Animal Ag for more information about the sources and impacts of excess nitrogen from agriculture and animal ag.
Yes. In volume, importance, and damage, ammonia (NH3) is the central air pollutant of animal ag.[1-5] It is a colorless gas with a strong odor made up of nitrogen and hydrogen atoms.
Vast amounts of ammonia are released from factory farms and feed crop production.[6,7]
U.S. EPA (2024) 2020 NEI Supporting Data and Summaries – Data Queries for Sector Summaries. [Total nitrous oxide from all agriculture at ~1.1 million tons versus ~5.5 million tons ammonia (mostly from animal ag)]
Rotz, C. A., et al., (2014). Ammonia emission model for whole farm evaluation of dairy production systems. Journal of environmental quality, 43(4), 1143-1158, p. 1143. [“Emissions (from animal agriculture) include greenhouse gases, volatile organic compounds, and specific toxic compounds, of which ammonia (NH3) is the most important.”]
Giannadaki, D., et al., (2018). Estimating health and economic benefits of reductions in air pollution from agriculture. The Science of the Total Environment, 622–623, 1304–1316, p. 1305.
Ni, J. Q., et al., (2020). Nine Decades of Scientific Research on Air Pollution Related to Food Animal Health and Welfare. In 2020 ASABE Annual International Virtual Meeting (American Society of Agricultural and Biological Engineers), p. 1. [“…based on 167 journal research publications… Ammonia (NH3) was the primary pollutant reported in about 70% of the studies…”]
Hill, J., et al., (2019). Air-quality-related health damages of maize. Nature Sustainability, 2(5), 397-403. [Report estimates the PM2.5 pollution costs of corn production (the primary animal feed) at ~8 times the GHG damages of corn production.]
Giannadaki, D., et al., (2018), p. 1305. [“The main pollutant from agricultural activity is ammonia (NH3), mainly from animal husbandry and its associated manure processing, and to a lesser extent from fertilizer use.”]
U.S. EPA (2024) 2020 NEI Supporting Data and Summaries – Data Queries for Sector Summaries. [Query: National/Ammonia NH3/Livestock Waste (49.2%), fertilizer application (33.5%) of total (5,482,484 tons)]
Ammonia pollutes locally, regionally, and internationally.
![]() Locally, at the factory farm, ammonia causes respiratory and other health problems for farmed animals and workers.[1,2]
Locally, at the factory farm, ammonia causes respiratory and other health problems for farmed animals and workers.[1,2]![]() Regionally, ammonia transitions into wind-borne PM2.5 and damages human, animal, and environmental health.[3-5]
Regionally, ammonia transitions into wind-borne PM2.5 and damages human, animal, and environmental health.[3-5] ![]() Spanning national borders, ammonia is a key compound fueling the nitrogen cascade, creating cycles of damages in air, land, water, and oceans.[6]
Spanning national borders, ammonia is a key compound fueling the nitrogen cascade, creating cycles of damages in air, land, water, and oceans.[6]
Naseem, S., & King, A. J. (2018). Ammonia production in poultry houses can affect health of humans, birds, and the environment—techniques for its reduction during poultry production. Environmental Science and Pollution Research International, 25(16), 15269–15293, p. 15271.
Bist, R. B., et al., (2023). Ammonia emissions, impacts, and mitigation strategies for poultry production: A critical review. Journal of Environmental Management, 328, 116919, Table 2.
Tessum, C. W., et al., (2019). Inequity in consumption of goods and services adds to racial–ethnic disparities in air pollution exposure. PNAS, 116(13), 6001–6006, p. 6001. [“Fine particulate matter (PM2.5) air pollution exposure is the largest environmental health risk factor in the United States.”]
Wyer, K. E., et al., (2022). Ammonia emissions from agriculture and their contribution to fine particulate matter: A review of implications for human health. Journal of Environmental Management, 323, 116285–116285, p. 5. [“Gaseous NH3 reacts with aerosols containing sulphuric and nitric acids to create particulates such as ammonium nitrate (NH4NO3), ammonium sulphate ((NH4)2SO4), and ammonium chloride (NH4CL).”]
For more information on PM2.5 – definitions, sources, and impacts – see, Agricultural PM2.5 Pollution
Galloway, J. N., et al., (2003). The nitrogen cascade. Bioscience, 53(4), 341-356. [“The same atom of Nr can cause multiple effects in the atmosphere, in terrestrial ecosystems, in freshwater and marine systems, and on human health. We call this sequence of effects the nitrogen cascade.” at Abstract]
Escaped atmospheric ammonia (NH3) comes primarily from manure on factory farms (both livestock and poultry) and to a lesser degree from fertilizer application on crops that go to animal feed.[1,2]
Factory farm locations correlate strongly with ammonia emission densities.[3]
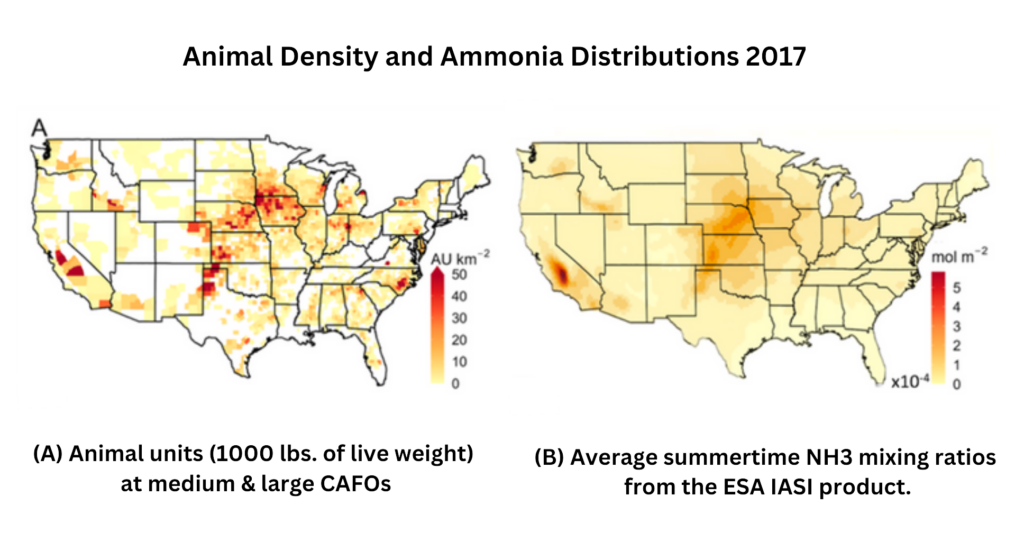
U.S. EPA (2024) 2020 NEI Supporting Data and Summaries – Data Queries for Sector Summaries.[Query: National/Ammonia NH3/Livestock Waste (49.2%), fertilizer application (33.5%), agricultural field burning (2.7%) of total (5,482,484 tons)]
Giannadaki, D., et al., (2018). Estimating health and economic benefits of reductions in air pollution from agriculture. The Science of the Total Environment, 622–623, 1304–1316, p. 1305. [“The main pollutant from agricultural activity is ammonia (NH3), mainly from animal husbandry and its associated manure processing, and to a lesser extent from fertilizer use.”]
Chart from Burns, A. M., et al., (2023). Data Gap: Air Quality Networks Miss Air Pollution from Concentrated Animal Feeding Operations. Environmental Science & Technology, 57(49), 20718–20725.
An estimated two-thirds of total U.S. anthropogenic ammonia emissions (NH3) is from animal ag. The largest source is livestock and poultry manure at 49% of total ammonia. Since more than half of U.S. crops are grown for animal feed, we add half of the total ammonia that escapes from crop production (i.e., half of 36%), which includes fertilizer application and the field burning of residue.[1,2]

The 2020 data from the EPA National Emissions Inventory [NEI] assesses that agriculture is responsible for ~85% of total U.S. ammonia emissions.[3] Other sources generally support that figure.[4,5]
U.S. EPA (2024) 2020 NEI Supporting Data and Summaries – Data Queries for Sector Summaries.[Query: National/Ammonia NH3/Livestock Waste (49.2%), Fertilizer Application (33.5%), Agricultural Field burning (2.7%) of total. 49.2 + (.5 *36.2) = 67.3%]
For share of crops that are used for animal feed, see, Total Feed Crops Share
U.S. EPA (2024) 2020 NEI Supporting Data and Summaries – Data Queries for Sector Summaries. [Total ag ammonia (4,675,035) / total ammonia (5,482,484 tons) = 85.3%. A large fraction of the remaining 15% is from wildfires, both natural and prescribed. Subtracting “Wildfires” increases total ag contributions to about 90%. Not included in the EPA tallies are other significant natural (non-anthropogenic) contributions of ammonia emissions including soils under natural vegetation and oceans. See, Bouwman, A. F., et al., (1997). A global high‐resolution emission inventory for ammonia. Global biogeochemical cycles, 11(4), 561-587, Table 11]
Behera, S. N., et al., (2013). Ammonia in the atmosphere: a review on emission sources, atmospheric chemistry and deposition on terrestrial bodies. Environmental Science and Pollution Research, 20, 8092-8131, Table 2. [3,218 MMT anthropogenic agricultural / 3,587 = 89.7% for 2005]
Nair, A. A., & Yu, F. (2020). Quantification of Atmospheric Ammonia Concentrations: A Review of Its Measurement and Modeling. Atmosphere, 11(10), 1092, p. 9. [Globally, “approximately 60% of total NH3 emissions are from anthropogenic sources, of which 80–90% are from agricultural activity (fertilizers and livestock wastes).”]
Ammonia is a precursor gas that reacts with aerosols (particles or droplets in the air or in gases) to form various chemical compounds, some of which take the form of PM2.5.[1]
Most air-borne ammonia is short lived and will be deposited within 2 or 3 miles of its source.[2,3] However, a portion of ammonia reacts with aerosols to create PM2.5 which can drift, creating damage hundreds of miles or even more than a thousand miles from the source.[4,5]
PM2.5 is considered the largest environmental health risk factor in the U.S.[6]
Wyer, K. E., et al., (2022). Ammonia emissions from agriculture and their contribution to fine particulate matter: A review of implications for human health. Journal of Environmental Management, 323, 116285–116285, p. 5. [“Gaseous NH3 reacts with aerosols containing sulphuric and nitric acids to create particulates such as ammonium nitrate, ammonium sulphate, and ammonium chloride.”]
Krupa, S. V. (2003). Effects of atmospheric ammonia (NH3) on terrestrial vegetation: a review. Environmental pollution, 124(2), 179-221, p. 181. [Ammonia life span of several hours to perhaps 1 to 4 days and a reach of .5 to 3 or 4 miles]
Nair, A. A., & Yu, F. (2020). Quantification of Atmospheric Ammonia Concentrations: A Review of Its Measurement and Modeling. Atmosphere, 11(10), 1092, p. 2. [“While ammonia itself has a very short atmospheric lifetime of a few hours to a day owing to rapid deposition and particle uptake, its particulate forms too have relatively short atmospheric lifetimes of under a week…”]
Goodkind, A. L., et al., (2019). Fine-scale damage estimates of particulate matter air pollution reveal opportunities for location-specific mitigation of emissions. PNAS, 116(18), 8775-8780. [“We find that 33% of damages occur within 8 km of emission sources, but 25% occur more than 256 km away…”]
Aneja, V. P., et al., (2008). Ammonia assessment from agriculture: US status and needs. Journal of Environmental Quality, 37(2), 515-520, p. 516. [“ammonium aerosols might travel as far as 2500 km…”]
Tessum, C. W., et al., (2019). Inequity in consumption of goods and services adds to racial–ethnic disparities in air pollution exposure. PNAS, 116(13), 6001–6006, p. 6001. [“Fine particulate matter (PM2.5) air pollution exposure is the largest environmental health risk factor in the United States.”]
Broadly estimated, ~15-20% of total PM2.5 is attributable to animal ag.[1]
All of agriculture is responsible for ~20-30% of PM2.5, and animal ag is responsible for about two-thirds of that.[2-5]
This estimate may be conservative because ammonia emissions have grown significantly since the reference years of some of these reports and are likely still underestimated (see next 2 questions). In addition to the references below, see Agricultural PM2.5 Pollution for additional reports on the share of PM2.5 from agriculture.
Lelieveld, J., et al., (2015). The contribution of outdoor air pollution sources to premature mortality on a global scale. Nature, 525(7569), 367-371, Table 2. [Estimates 29% from agriculture in U.S. in 2010]
Bauer, S. E., et al., (2016). Significant atmospheric aerosol pollution caused by world food cultivation. Geophysical Research Letters, 43(10), 5394–5400. [“Agriculture is responsible for about half of the total anthropogenic pollution in both the eastern and western United States.” at p. 5396. Ammonia specifically about 30%. (Figure 1)]
Wyer, K. E., et al., (2022). Ammonia emissions from agriculture and their contribution to fine particulate matter: A review of implications for human health. Journal of Environmental Management, 323, 116285–116285, p. 1. [“NH3 emissions from agriculture are responsible for 30% of all PM2.5 in the US…”]
U.S. EPA (2024) 2020 NEI Supporting Data and Summaries – Data Queries for Sector Summaries.[Query: National/Ammonia NH3/Livestock Waste (49.2%), Fertilizer Application (33.5%), Agricultural Field burning (2.7%) of total. 49.2 + (.5 *36.2) = 67.3%]
Yes. From 2014 through 2020 total ammonia emissions have grown by ~20%, with most of the change due to emissions from livestock manure.[1]
The share of PM2.5 created from agricultural ammonia is likely growing as well.
U.S. EPA (2024) 2020 NEI Supporting Data and Summaries – Data Queries for Sector Summaries. [2020: Total agricultural ammonia = 4.68 million tons. 2014: Total agricultural ammonia = 2.95 million tons. EPA notes that changed methodology of ammonia tabulation added 900,000 tons to total agricultural ammonia from 2017 to 2020. Therefore, revising 2014 to 3.85 MT agricultural ammonia = increase of ~22% from 2014 to 2020 (4.68 – 3.85) / 3.85 = 21.6%. Livestock manure in 2014 = 2.07 MT. In 2020 = 2.70. Increase of ~630,000 tons making up most of it]
Most likely they are, perhaps dramatically. In 2021, a group of highly experienced USDA researchers concluded that ammonia emissions from U.S. dairy farms were ~3 times the volume that the EPA estimated.[1]
The EPA monitors air quality from data acquired from thousands of monitoring sites.[2] However, there is no system in place to monitor ammonia emissions at factory farms which are the largest NH3 emitters.[3,4] And because air pollution policy in the U.S. is focused on large point sources (such as industrial plants), mobile emissions, and highly populated areas, surface monitoring sites are sparsely located in rural agricultural areas. “Approximately one-third of all EPA air quality sites are located in rural settings, and ~10% are in agricultural locations.”[5]
In addition, there is a tendency to underestimate NH3 concentrations due to a lack of accurate modeling methods.[6]
Rotz, A., et al., (2021). Environmental assessment of United States dairy farms. Journal of Cleaner Production, 315, 128153, Table 5. [639 Gg = approx. 1.41 billion pounds or 704,000 tons. EPA assessment for 2014 dairy was 226,000 tons. For 2014 figure, see U.S. EPA (2023) 2020 National Emissions Inventory Technical Support Document: Agriculture – Livestock Waste, EPA-454/R-23-001j, Table 10-10 (NH3 emissions in tons by animal type)]
U.S. EPA (2024) Air Quality System (AQS), AQS Primer, 3.2 Geography. https://www.epa.gov/aqs [as of 2020]
U.S. EPA Office of Inspector General (2017) Eleven Years After Agreement, EPA Has Not Developed Reliable Emission Estimation Methods to Determine Whether Animal Feeding Operations Comply With Clean Air Act and Other Statutes, No. 17-P-0396.
Madison McVan (April 20, 2023) 18 years and counting: EPA still has no method for measuring CAFO air pollution, Investigate Midwest. https://investigatemidwest.org/2023/04/20/18-years-and-counting-epa-still-has-no-method-for-measuring-cafo-air-pollution/
Burns, A. M., et al., (2023). Data Gap: Air Quality Networks Miss Air Pollution from Concentrated Animal Feeding Operations. Environmental Science & Technology, 57(49), 20718–20725, p. 20721.
Van Damme, M., et al., (2014). Global distributions, time series and error characterization of atmospheric ammonia (NH3) from IASI satellite observations. Atmospheric Chemistry and Physics, 14(6), 2905–2922, p. 2906.
It is likely that 10,000 or more deaths per year are attributable to PM2.5 from animal ag. There is much research documenting the human health impacts of PM2.5 from animal ag:
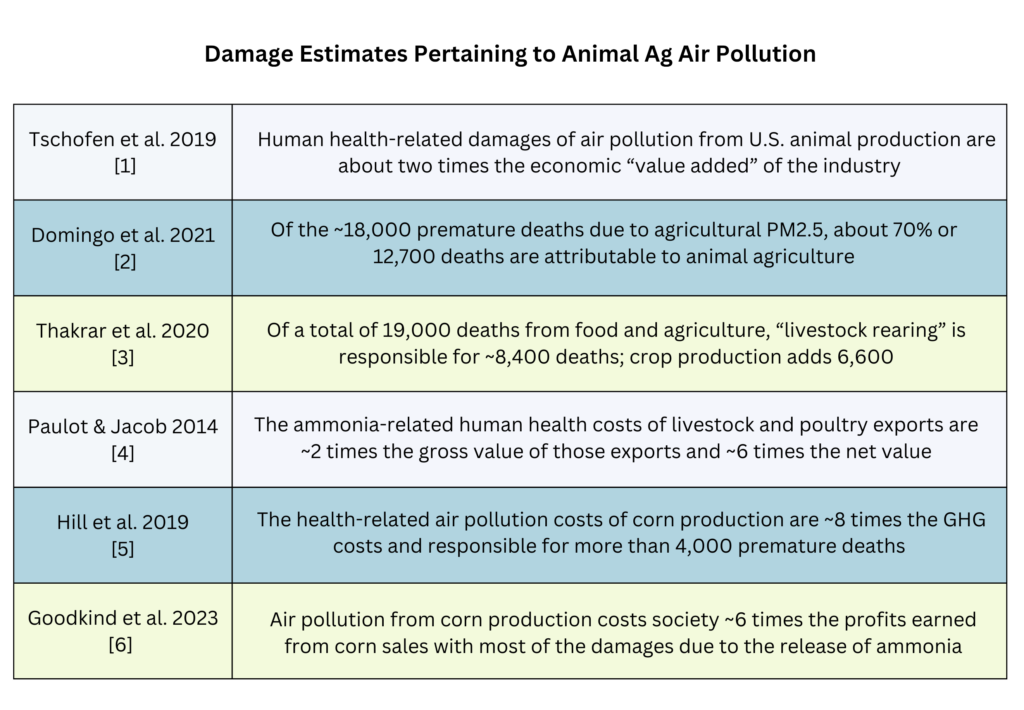
These reports are almost exclusively focused on the costs to human health, and usually account for just the portion of those health costs related to premature mortality.
Tschofen, P., et al., (2019). Fine particulate matter damages and value added in the US economy. PNAS, 116(40), 19857–19862.
Domingo, N. G., et al., (2021). Air quality–related health damages of food. PNAS, 118(20), e2013637118, p. 2.
Thakrar, S. K., et al., (2020). Reducing Mortality from Air Pollution in the United States by Targeting Specific Emission Sources. Environmental Science & Technology Letters, 7(9), 639–645, Figure 3.
Paulot, F. & Jacob, D. J. (2014). Hidden cost of US agricultural exports: particulate matter from ammonia emissions. Environmental science & technology, 48(2), 903-908. [Calculation based on Table 1: Total health costs = $36 billion. Share of NH3 emissions for livestock = 165 GgN/295 GgN = 56%. (.56 * $36B) = $20.2B livestock health costs / $10.1B livestock gross profits = ~2 times. $20.2B / $3.4B livestock net profits = ~6 times]
Hill, J., et al., (2019). Air-quality-related health damages of maize. Nature Sustainability, 2(5), 397-403, p. 397. [Just corn 4,300 deaths: $39 billion / $4.9 billion = ~8 times]
Goodkind, A. L., et al., (2023). Managing nitrogen in maize production for societal gain. PNAS nexus, 2(10), pgad319. [“We find that the monetized health and environmental costs to society of current maize nitrogen management practices are six times larger than the profits earned by farmers. Air emissions of ammonia from application of synthetic fertilizer and manure are the largest source of pollution costs.” at Abstract]
The impacts of ammonia from animal ag are unusually difficult to assess.
![]() It is a colorless fast-moving gas emanating in large quantities from tens of thousands of locations across the nation.
It is a colorless fast-moving gas emanating in large quantities from tens of thousands of locations across the nation.![]() Ammonia quickly transforms into a variety of complex compounds that continually transform and react with other compounds.[1]
Ammonia quickly transforms into a variety of complex compounds that continually transform and react with other compounds.[1]![]() Nitrogen-based pollutants constantly cycle from water to soil to air and back again.[2]
Nitrogen-based pollutants constantly cycle from water to soil to air and back again.[2]![]() Ammonia causes significant, complex, and variable damages in ecosystems spanning plant life, wildlife, forests, soil, air, and water.[3,4]
Ammonia causes significant, complex, and variable damages in ecosystems spanning plant life, wildlife, forests, soil, air, and water.[3,4]![]() Once released these compounds move among countries and oceans.[5]
Once released these compounds move among countries and oceans.[5]
Because of these complexities, the long-term consequences of nitrogen pollution, especially ammonia, are difficult to assess and weakly understood.[6-9]
Davidson, E. A., et al., (2011). Excess nitrogen in the US environment: trends, risks, and solutions. Issues in ecology, (15). Glossary, p. 14.
Galloway, J. N., et al., (2003). The nitrogen cascade. Bioscience, 53(4), 341-356. [“The same atom of Nr can cause multiple effects in the atmosphere, in terrestrial ecosystems, in freshwater and marine systems, and on human health.” Abstract]
U.S. EPA (2011) Reactive Nitrogen in the United States: An Analysis of Inputs, Flows, Consequences, and Management Options, A Report of the EPA Science Advisory Board, p. 4. [“However, a major consequence of this nearly inexhaustible supply is that most N used in food production, and all of the new Nr produced by fossil fuel combustion, is lost to the environment where it circulates through the earth’s atmosphere, hydrosphere, geosphere, and biosphere. During this circulation, Nr contributes to a wide variety of consequences, which are magnified with time as Nr moves through the environment.”]
Krupa, S. V. (2003). Effects of atmospheric ammonia (NH3) on terrestrial vegetation: a review. Environmental pollution, 124(2), 179-221.
U.S. EPA (2011) Reactive Nitrogen in the United States: An Analysis of Inputs, Flows, Consequences, and Management Options, p. ES-6. [Of the ammonia “emitted into the U.S. atmosphere each year, about (two-thirds) are deposited onto the land and surface waters of the U.S., and about (one-third) is advected out of the U.S. via the atmosphere.”]
Battye, William, et al., (2017). Is nitrogen the next carbon? Earth’s future 5.9: 894-904. [“some impacts of reactive nitrogen are difficult to measure on a short timescale.”]
Guthrie, S., et al., (2018). The impact of ammonia emissions from agriculture on biodiversity. RAND Corporation and The Royal Society, Cambridge, UK, p.14. [“Firstly, it must be noted that there is very limited evidence on the effects of ammonia on animals and wider ecosystem function.”]
Sutton, M. A., et al., (2020). Alkaline air: changing perspectives on nitrogen and air pollution in an ammonia-rich world. Philosophical Transactions of the Royal Society A, 378 (2183), 20190315, p. 2. [“Over recent decades ammonia (NH3) has often seemed like the Cinderella of air pollution, as it has been given much less attention than other pollutants…”]
Einarsson, R. (2024). Nitrogen in the food system. TABLE Explainer. TABLE, University of Oxford, Swedish University of Agricultural Sciences, and Wageningen University and Research, p. 2. […the increased turnover of N in the food system has led to unprecedented quantities of N emitted into ecosystems and the atmosphere, with long-term consequences that are as yet only partially understood.”]
Ammonia in the atmosphere eventually returns to earth on land and water. The damage to plant life from ammonia deposition on terrestrial ecosystems – i.e., the transformation of NH3 in the atmosphere into compounds that are then incorporated into plant foliar and soils – can be severe.[1,2] This includes potential negative impacts on North American forests.[3,4]
Some plant species thrive on higher nutrient levels, while many others are outcompeted by fast-growing species.[5] Notably, “agricultural crops appear to be the only systems not negatively influenced at present, since high productivity and turnover prevent the accumulation of N.”[6]
Ammonia is also deposited into water as gas, particulates, or via precipitation, thereby contributing to the eutrophication of lakes, rivers, and streams. This can trigger algae blooms that are toxic to fish and native aquatic plants.[7,8]
Perhaps most importantly, these impacts are all a part of the nitrogen cascade, as ammonia and its subsequent compounds continue to cycle through air, water, and soil, causing damage over and over.[9,10]
Krupa, S. V. (2003). Effects of atmospheric ammonia (NH3) on terrestrial vegetation: a review. Environmental pollution, 124(2), 179-221, p. 212. [“Natural and semi-natural ecosystems, as well as forests must be expected to be severely at risk from the current amount of N deposition.”]
Behera, S. N., et al., (2013). Ammonia in the atmosphere: a review on emission sources, atmospheric chemistry and deposition on terrestrial bodies. Environmental Science and Pollution Research, 20, 8092-8131, pp. 8121-8123. [“In general, the assimilation capacity of the plant species normally determines the degree of injury. If the assimilation capacity is not sufficiently high to detoxify NHy, acute (visible) injuries may occur.”]
Krupa, S. V. (2003), pp. 207-208. [“N deposition must indeed be regarded as a factor severely disturbing nutrient cycling in forest ecosystems with detrimental effects for tree health.”]
Behera, S. N., et al., (2013), p. 8122. [“However, in the developed areas of Europe and North America, high N deposition has affected the health of forest ecosystems by causing several effects, including soil acidification, nutrient imbalance, decrease in productivity, forest decline and threats to the forest biodiversity.”]
Guthrie, S., et al., (2018). The impact of ammonia emissions from agriculture on biodiversity. RAND Corporation and The Royal Society, Cambridge, UK, p. 7. [“Common, fast-growing species adapted to high nutrient availability thrive in a nitrogen-rich environment and out-compete species which are more sensitive, smaller or rarer.”]
Krupa, S. V. (2003), p. 212.
USGS (2019) Nutrients and Eutrophication. https://www.usgs.gov/mission-areas/water-resources/science/nutrients-and-eutrophication
Preece, Sharon, et al., (2017). Ammonia Emissions from Cattle Feeding Operations, Texas A&M Agrilife Extension, E-632, p. 2.
Galloway, J. N., et al., (2003). The nitrogen cascade. Bioscience, 53(4), 341-356. [“The same atom of Nr can cause multiple effects in the atmosphere, in terrestrial ecosystems, in freshwater and marine systems, and on human health. We call this sequence of effects the nitrogen cascade.” Abstract]
For a detailed review of the literature assessing the impacts of ammonia pollution on biodiversity, see, Guthrie, S., et al., (2018). The impact of ammonia emissions from agriculture on biodiversity. [Note: Despite the many studies assessing the health impacts of PM2.5 on humans, we are not aware of studies assessing direct health impacts on wildlife, including mammals, birds, and reptiles, who presumably also experience significant respiratory and other health issues.]
Most assessments of the damages of ammonia emissions analyze the impacts on human health. There are far fewer assessments of biodiversity including plant life and forests, even though the harm can be severe.[1-3]
Research pertaining to direct effects of ammonia gas on farmed animals is usually done in the context of efficient production, though some acknowledge the inherent suffering from constantly breathing highly polluted air.[4,5]
The impact on animals of PM2.5 is not as widely studied. In lab settings, exposure has been tested on a variety of mammals, but there is limited understanding of the direct impacts on wildlife.[6] It should be self-evident, however, that any animal that breathes will be affected by PM2.5 pollution and “can suffer like humans from the potential acute and chronic effects of such exposure. The literature, although poor for animals, confirms that exposure to dusts may result in persistent inflammation, pulmonary fibrosis, and cellular and tissue remodeling in specific regions of the lung where particles tend to accumulate.”[7]
Krupa, S. V. (2003). Effects of atmospheric ammonia (NH3) on terrestrial vegetation: a review. Environmental pollution, 124(2), 179-221, p. 212. [“Natural and semi-natural ecosystems, as well as forests must be expected to be severely at risk from the current amount of N deposition.”]
Behera, S. N., et al., (2013). Ammonia in the atmosphere: a review on emission sources, atmospheric chemistry and deposition on terrestrial bodies. Environmental Science and Pollution Research, 20, 8092-8131, pp. 8121-8123. [“In general, the assimilation capacity of the plant species normally determines the degree of injury. If the assimilation capacity is not sufficiently high to detoxify NHy, acute (visible) injuries may occur.”]
Guthrie, S., et al., (2018). The impact of ammonia emissions from agriculture on biodiversity. RAND Corporation and The Royal Society, Cambridge, UK, p. 7. [“Common, fast-growing species adapted to high nutrient availability thrive in a nitrogen-rich environment and out-compete species which are more sensitive, smaller or rarer.”]
Bist, R. B., et al., (2023). Ammonia emissions, impacts, and mitigation strategies for poultry production: A critical review. Journal of Environmental Management, 328, 116919, p. 2. [“Chickens are very sensitive creatures that require precisely controlled indoor climate conditions inside poultry houses, and thus it is critical to reduce NH3 emissions or suppress indoor NH3 concentration.”]
Naseem, S. & King, A. J. (2018). Ammonia production in poultry houses can affect health of humans, birds, and the environment—techniques for its reduction during poultry production. Environmental Science and Pollution Research International, 25(16), 15269–15293, p. 15273
Shang, Y., & Sun, Q. (2018). Particulate air pollution: major research methods and applications in animal models. Environmental disease, 3(3), 57-62, p. 58. [“Experimental animal models have been extensively used to study the underlying mechanism caused by environmental exposure to ambient PM .”(abstract). “…mice, guinea pigs, and other rodents have been used in investigations related to pulmonary uptake and disposition of aerosolized particles.”]
Losacco, C., & Perillo, A. (2018). Particulate matter air pollution and respiratory impact on humans and animals. Environmental Science and Pollution Research International, 25(34), 33901–33910, p. 33906.