
In essence, no. Although the EPA is required by the Clean Air Act to determine which stationary sources “cause or contribute significantly to air pollution that may reasonably be anticipated to endanger public health or welfare,” the agency has not added AFOs or CAFOs to the list of sources for which pollution limits must be set.[1] Nor has the EPA established limits (National Ambient Air Quality Standards or “NAAQS”) for the maximum allowable concentrations of factory farm emissions.[2]
Two additional environmental laws, the Comprehensive Environmental Response, Compensation, and Liability Act (CERCLA) and the Emergency Planning and Community Right-to-Know Act (EPCRA), require reporting of releases of hazardous substances that meet or exceed reportable quantities within a 24-hour period. However, in 2018, Congress passed the FARM Act exempting “air emissions from animal waste (including decomposing animal waste) at a farm” from CERCLA release notification requirements, and the EPA has interpreted that to mean they are also exempt from EPCRA requirements.[3]
Clean Air Act 42 U.S.C. 7411(b)(1)(A)
Taft Law Bulletin (2014) Clean Air Act Does Not Require EPA to Regulate Emissions From Animal Feeding Operations. https://www.taftlaw.com/news-events/law-bulletins/clean-air-act-does-not-require-epa-to-regulate-emissions-from-animal-feeding-operations
U.S. EPA (2026) Agriculture and Air Quality – Reporting Requirement for Air Releases from Animal Waste. https://www.epa.gov/agriculture/agriculture-and-air-quality#reportingrequirements [“However, due to legislative changes in the “Fair Agricultural Reporting Method Act” or “FARM Act” in March 2018, “air emissions from animal waste at a farm, such as ammonia and hydrogen sulfide” are exempt from reporting under CERCLA. These types of releases also do not need to be reported under EPCRA.”]
The EPA has dragged its heels for the last 25 years, unable even to establish modeling methods to assess emissions from factory farms.
In 2001, with an understanding that large factory farm air pollutants negatively impact the environment and human health, the EPA issued a report that attempted “to develop a method for estimating emissions at the individual farm level that reflects the different animal production methods that are commonly used at commercial scale operations.”[1] In furtherance of that goal, both the EPA and USDA asked the National Research Council to evaluate the scientific information needed to address air emissions from animal feeding operations. The Council’s subsequent report recommended that they should “focus on the measurement and control of those emissions of major concern.” Ammonia (NH3) was identified as the sole major air emission factor on a regional and national level.[2] In addition, the Council recommended that cropland to which manure and chemical fertilizers were applied also be considered for regulatory measures.[3]
In 2005, the EPA published an agreement that participating factory farm owners would fund a study to collect emissions data for the EPA. In return, the agency would not bring any actions against the AFOs for violating the Clean Air Act or the CERCLA/EPCRA reporting requirements until the agency had finalized its Emissions Estimation Methods (EEMs). The study was to take two years.[4,5]
Nearly 20 years later, the EPA issued a draft report offering “initial emissions estimation tools for AFOs to fulfill the requirements of the Air Compliance Agreement.”[6] Although the formal comment period ended in August 2025, no further action has been taken.[7]
Many reports, petitions, and media outlets have documented the circuitous story of the EPA’s decades-long indemnification of factory farm operators and corporate meat and dairy producers.[8-10] It is clear that Congress and the federal agencies are reluctant, if not unwilling, to regulate damaging aspects of agriculture, especially that of animal ag.
U.S. EPA (2001) Emissions From Animal Feeding Operations. Emission Standards Division, EPA Contract No. 68-D6-0011, Task Order 71. p. xii.
National Research Council (2003) Air emissions from animal feeding operations: Current knowledge, future needs. National Academies Press, p. 1, p. 4, and table 8-1, p. 170.
Air emissions from animal feeding operations: Current knowledge, future needs, p. 162.
U.S. EPA Office of Inspector General (2017) Eleven Years After Agreement, EPA Has Not Developed Reliable Emission Estimation Methods to Determine Whether Animal Feeding Operations Comply With Clean Air Act and Other Statutes, Report No. 17-P-0396.
U.S. EPA (2024) Development of Emissions Estimating Methodologies for Animal Feeding Operations, Volume 1: Overview Report, pp. 3-1 to 3-6. [A brief history from the EPA covering some aspects of their stalled efforts through 2021 can be found here.]
Development of Emissions Estimating Methodologies for Animal Feeding Operations, Volume 1: Overview Report, p. 3-5.
U.S. EPA (January 2026) National Air Emissions Monitoring Study. https://www.epa.gov/afos-air/national-air-emissions-monitoring-study
U.S. EPA Office of Inspector General (2017). Eleven Years After Agreement, EPA Has Not Developed Reliable Emission Estimation Methods to Determine Whether Animal Feeding Operations Comply With Clean Air Act and Other Statutes. [The EPA was roundly criticized by the Office of Inspector General for years of disorganization and delays.]
Animal Legal Defense Fund v. EPA (2021). Petition to Rescind the Air Consent Agreement and Enforce Clean Air Laws Against Animal Feeding Operations. [Many other organizations joined in the petition.]
Madison McVan (April 20, 2023) 18 years and counting: EPA still has no method for measuring CAFO air pollution, Investigate Midwest. https://investigatemidwest.org/2023/04/20/18-years-and-counting-epa-still-has-no-method-for-measuring-cafo-air-pollution/
Factory farms typically emit ammonia (NH3), hydrogen sulfide (H2S), volatile organic compounds (VOCs), and particulate matter (PM). The compounds primarily responsible for the odors associated with factory farms are VOCs and hydrogen sulfide, with ammonia also a factor. VOCs also contribute to the formation of atmospheric ozone, which is a respiratory irritant.[1]
There are hundreds of air pollutant compounds, especially VOCs, emanating from a typical factory farm.[2,3]
U.S. EPA (2024) Development of Emissions Estimating Methodologies for Animal Feeding Operations, Volume 1: Overview Report, p. 1-1.
Aneja, V. P., et al., (2009). Effects of Agriculture upon the Air Quality and Climate: Research, Policy, and Regulations. Environmental Science & Technology, 43(12), 4234–4240, p. 4236. [“Animal production results in emissions of hundreds of identified VOCs (volatile organic compounds).”]
Ni, J. Q., et al., (2012). Volatile organic compounds at swine facilities: A critical review. Chemosphere, 89(7), 769-788, Abstract. [“More than 500 VOCs have been identified.”]
The failure to regulate ammonia (NH3) is critical since it is the central air pollutant from animal ag, and by far the most damaging to human and environmental health.[1]
The astonishingly high levels of ammonia emissions from factory farms cause damage at local, regional, and national levels.[2,3]
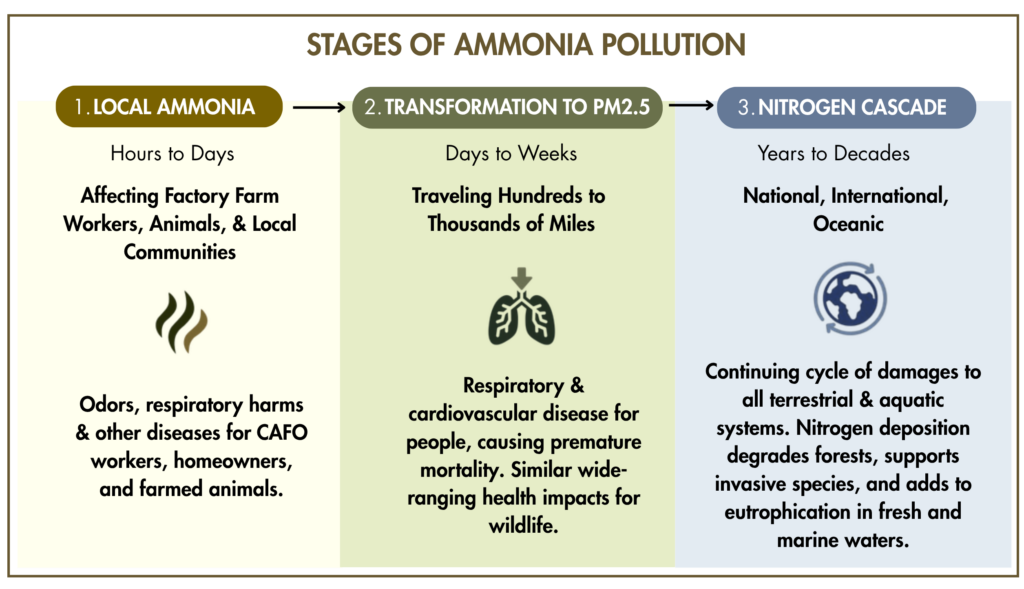
See, Air Pollution & Animal Ag Overview [question: Is ammonia the central air pollutant from animal ag?]
See, Ammonia Emissions from Animal Ag
See, Animal Ag Ammonia and Human Health and Animal Ag PM2.5 & Human Health
Yes. PM2.5 is a “criteria pollutant” considered harmful to public health and the environment, for which the EPA sets National Ambient Air Quality Standards (NAAQS), limiting how much is present in outdoor air – not how much any one facility or industry may emit.[1] The NAAQS are ambient air quality standards, measured in micrograms per cubic meter of air (µg/m3) averaged over three years.[2] Air monitoring and compliance is done by the states, Tribes, and local agencies.[3]
The current annual standard for PM2.5 is 9 micrograms per cubic meter, and 35 µg/m3 for a 24-hour period.[4] This is higher than the World Health Organization’s (WHO) recently revised guidelines of 5 µg/m3 (annual) and 15 µg/m3 (24-hour period).[5]
The EPA reports that 119 U.S. counties did not meet the average standard of 9 µg/m3 for the years from 2020-2022.[6] However, of the approximately 3,140 counties in the U.S., only 1,000 have air monitoring equipment.[7] And of the 1,000 that do, only about 540 (17% of total counties) can effectively monitor PM2.5.[8]
Under the current administration, the EPA was halted by a federal appeals court from increasing the standard, when attempting to revert to 12 µg/m3 as the annual average standard.[9]
U.S. EPA (2025) Particulate Matter (PM) Pollution. https://www.epa.gov/pm-pollution/setting-and-reviewing-standards-control-particulate-matter-pm-pollution#standards
U.S. EPA (2025) NAAQS Table. https://www.epa.gov/criteria-air-pollutants/naaqs-table
U.S. EPA ( 2025). Basic Information about Air Quality SIPs. https://www.epa.gov/air-quality-implementation-plans/basic-information-about-air-quality-sips
U.S. EPA (2025) NAAQS Table.
World Health Organization. (2021). WHO global air quality guidelines: particulate matter (PM2.5 and PM10), ozone, nitrogen dioxide, sulfur dioxide and carbon monoxide, pp. 78 & 88.[AQG or Air Quality Guideline set at 5ug/m3 for “annual mean value” and at 15ug/m3 for “short term (24 hour)” level.]
U.S. EPA (2024) Fine Particle Concentrations for Counties with Monitors Based on Air Quality Data from 2020 – 2022.
U.S. EPA (2026) Do you have outdoor air monitoring data for all counties in the U.S.? [“No, approximately 1,000 out of the roughly 3,000 U.S. counties have monitoring data.” https://www.epa.gov/outdoor-air-quality-data/do-you-have-outdoor-air-monitoring-data-all-counties-us
Wells, C., et al., (2025) Is Your County’s PM2.5 Monitor Capturing Peak Concentration? Nelson Institute Center for Sustainability and the Global Environment (SAGE), University of Wisconsin-Madison [“Valid PM₂.₅ monitoring data for 2023 were available for only 536 U.S. counties, representing approximately 17% of all counties.”]
Matthew Daly (June 2026) Appeals court rejects Trump EPA bid to abandon rule restricting deadly soot pollution. Associated Press. https://apnews.com/article/epa-soot-pollution-trump-zeldin-coal-dce0b711b208cec535de1f472079d219
Although ammonia is considered an “Extremely Hazardous Substance” under EPCRA (Emergency Planning and Community Right-to-Know Act) and a “hazardous substance” under CERCLA (Comprehensive Environmental Response, Compensation, and Liability Act), emissions are only lightly regulated.[1,2]
Facilities are required to issue notifications to the National Response Center or to state and tribal response centers regarding “reportable quantity” (RQ) releases above 100 pounds in a 24-hour period.[1,2] Releases that are continuous or stable in quantity and rate have more limited reporting requirements.[3]
Ammonia emissions from factory farms are not regulated at all.[4]
U.S. EPA (2026). Determining the amount released for Ammonia and Ammonium Hydroxide for Release Notification Requirements under CERCLA section 103 and EPCRA section 304. https://www.epa.gov/epcra/determining-amount-released-ammonia-and-ammonium-hydroxide-release-notification-requirements [“Ammonia (CAS number 7664-41-7) is an Extremely Hazardous Substance (EHS), listed at 40 CFR Part 355 Appendix A and Appendix B with a reportable quantity (RQ) of 100 lbs. Both ammonia and ammonium hydroxide (CAS number 1336-21-6) are listed as Comprehensive Environmental Response, Compensation, and Liability Act (CERCLA) hazardous substances at 40 CFR 302.4.”]
CFR Title 40, Chapter I, Subchapter J, Part 355. Emergency Planning and Notification.
https://www.ecfr.gov/current/title-40/chapter-I/subchapter-J/part-355#Appendix-A-to-Part-355U.S. EPA (2026) Emergency Planning and Community Right-to-Know Act (EPCRA) – CERCLA and EPCRA Continuous Release Reporting. https://insideanimalag.org/wp-admin/post.php?post=4027&action=elementor [“The release reporting regulations of CERCLA and EPCRA provide reduced reporting options for “continuous releases” of CERCLA hazardous substances and EPCRA Extremely Hazardous Substances (EHSs). This relief applies to facilities with releases of CERCLA hazardous substances and EPCRA EHSs that are “continuous” and “stable in quantity and rate.”]
See Question #1.
No, ambient ammonia emissions are not well monitored. Systems for measuring emissions, especially in agricultural settings, are still underdeveloped and the national total amounts are uncertain.[1-4]
In a surprisingly candid acknowledgement of the lack of precision in tallying total annual emissions, the EPA outlined its protocols in a 2023 report that assesses significant problems with its methodology.[5]
Burns, A. M., et al., (2023). Data Gap: Air Quality Networks Miss Air Pollution from Concentrated Animal Feeding Operations. Environmental Science & Technology, 57(49), 20718–20725, p. 20718 & 20721. [“In sharp contrast and despite its similar contribution to PM2.5, there is no National Ambient Air Quality Standards (NAAQS) for ammonia, and ambient concentrations are not as routinely monitored in regulatory networks. … In general, ambient NH3 is most abundant over rural agricultural land that includes both cropland and CAFOs, and where surface air quality monitoring locations are thinly distributed.”]
Li, Y., et al., (2016). Increasing importance of deposition of reduced nitrogen in the United States. PNAS, 113(21), 5874-5879, Abstract. [“Ammonia has historically not been routinely measured because there are no specific regulatory requirements for its measurement.”]
Wang, R., et al., (2023). Bridging the spatial gaps of the Ammonia Monitoring Network using satellite ammonia measurements. Atmospheric chemistry and physics, 23(20), 13217-13234, p. 13218. [“The Ammonia Monitoring Network (AMoN) is the only routine set of NH3 measurements in the United States, with 110 active AMoN sites in the contiguous United States in 2021, providing high-quality surface observations of NH3.” AMoN is not run by a U.S. government agency.]
Li, Z., et al., (2026). Ammonia emissions and depositions over the contiguous United States derived from IASI and CrIS using the directional derivative approach. Atmospheric Chemistry and Physics, 26(1), 703-721, Abstract & p. 704. [“NH3 flux estimates remain highly uncertain due to limited direct observations and complex emission–deposition processes. …large-scale ground-based measurements of NH3 emissions are sparse due to the challenges associated with accurately capturing gaseous NH3.”]
. U.S. EPA (2023) National Emissions Inventory Technical Support Document: Agriculture – Livestock Waste, p. 10-5. [“In the 2014 National Emissions Inventory (NEI), our estimates were developed by a graduate student working Carnegie Mellon University (sic). While she passed on the code and input files to EPA, when we attempted to use these in the 2017 NEI, we were not successful in reproducing some of her estimates; thus, we went to a simple ratioing (sic) technique (using meteorology changes from 2014 to 2017) to estimate emissions for this sector in the 2017 NEI. For the 2020 NEI, we were able to better reproduce the 2014 results and used the original Farm Emissions Model code provided by CMU with some improvements to estimate NH3 emissions for this sector. In this Technical Support Document (TSD), we summarize the 2020 NEI Process, leaving out a lot of the details which can be found in the 2017 NEI TSD, since they are unchanged.”]
It’s evident that the overriding reason is because any effort to constrain ammonia emissions would present a direct challenge to the factory farm system and its ability to mass produce extremely inexpensive animal-sourced foods. This is reflected in the USDA’s pushback against ammonia regulation (see next question).
In practice, ammonia mitigation efforts within the current factory farming system would necessarily raise production costs, and the USDA has argued that they could also have a potential negative impact on yield/productivity.[1]
The history of ineffective U.S. regulatory efforts aimed at animal ag’s more visible nutrient pollution of waterways offers a reality check.[2] Like most negative externalities of U.S. factory farming, there is likely no meaningful mitigation without major changes in the industrial animal ag system and its vast, widely dispersed network with varying structures and practices, confining billions of animals and their manure.
USDA (2014) Ammonia Emissions: What to Know Before You Regulate – Official White Paper of the USDA Agricultural Air Quality Task Force, p. 6. [“Two very important issues related to mitigating on-farm NH3 losses are the potential negative impacts on yield/productivity and the cost of implementing mitigation practices.”]
See, Water Pollution & Animal Ag Overview [question: Why is nutrient pollution from factory farms apparently intractable?]
There are several forces that have so far managed to thwart regulatory efforts aimed at reducing ammonia emissions:
 Agricultural exceptionalism and right-to-farm laws naturally play a role, substituting subsidies and ineffective voluntary schemes for regulation.[1-3]
The USDA has heavily pushed back on any efforts by the EPA to regulate ammonia or any agricultural gases.[4]
The complex science of counting emissions makes it unusually difficult to monitor and thus regulate, because every factory farm is different, based on housing conditions, diets, manure storage methods, and local climate.[5]
Widely varying emissions by location have given the industry a wedge that they have maximized.[6,7]
Antiregulatory zeal has further stymied complex research efforts.[8,9]
. Blattner, C. E., & Ammann, O. (2019). Agricultural exceptionalism and industrial animal food production: Exploring the human rights nexus. Journal of Food Law & Policy, 15(2), 9, p. 102. [“Agricultural exceptionalism is a belief system that fuels a range of exemptions or laws protecting agriculture from the purview of the public, including in the areas of environmental law, animal law, and property law… and is today sustained by widely held views among the public, legislators, and the judiciary that farmers do us a service by providing the public with food.”]
Diamond, D., et al., (2022). Agricultural exceptionalism, environmental injustice, and US right to farm laws. Envir. Law Report, 52, 10727-10748, p. 10742. [“Agricultural exceptionalism prevailed in March 2018 when President Donald Trump signed into law the Fair Agricultural Reporting Method Act, or the FARM Act. The FARM Act expressly exempts farms from reporting of air emissions from animal waste under CERCLA §103.159.”]
van Grinsven, H. J., et al., (2015). Losses of ammonia and nitrate from agriculture and their effect on nitrogen recovery in the European Union and the United States between 1900 and 2050. Journal of environmental quality, 44(2), 356-367, p. 356 [“Whereas the European Union imposed strict regulations on N use in agriculture, the United States relied mostly on voluntary or incentive schemes.”]
USDA (2014) Ammonia Emissions: What To Know Before You Regulate – Official White Paper of the USDA Agricultural Air Quality Task Force, p. 1. [“Nevertheless, regulation of NH3 emissions under the Clean Air Act will make it extremely difficult for EPA to consider the positive value and need for fertilizer NH3, which could have huge implications for the viability of the domestic and global food supply.”] For more, see next question.
U.S. EPA (2024) Development of Emissions Estimating Methodologies for Animal Feeding Operations Volume 1: Overview Report Draft, p. 2-1. [“The volatilization of NH3 from any AFO operation can be highly variable depending on total NH3 concentration, temperature, pH, and storage time.”]
Xiong, Y., et al., (2023) Evaluating Draft EPA Emissions Models for Laying Hen Facilities. Journal of the ASABE, 66(4): 851-863, Abstract. [“We conclude that the current draft EPA emission models cannot be used to the degree of precision that is suitable to apply to a wide range of layer facilities, particularly cage-free systems. Revisions are suggested to accommodate a greater range of climates, laying hen facility types, and inventories for practical emission estimations.” “The authors are grateful to the American Egg Board (AEB) for funding this project and to the Egg Industry Center for putting together a task force and allocating funds for this joint effort.”]
U.S. EPA (2024) Development of Emissions Estimating Methodologies for Animal Feeding Operations, p. 6. [Ammonia emissions are fugitive, vary spatially and temporally, and are readily influenced by many factors (e.g., source, climate, management practices, etc.) making it difficult to determine at a farm level, a precise emission factor. Before emissions can be quantified, a decision will have to be made as to what constitutes a ‘farm’.”]
Matthew Daly (July 19, 2025) EPA eliminates research and development office, begins layoffs. Associated Press. https://apnews.com/article/epa-zeldin-trump-reorganization-science-research-acf0ad3a649f940e138b2a917169405f
Sachi K. Mulkey (August 14, 2026) The EPA’s data on cancer risk from air pollution has gone dark. Grist. https://grist.org/regulation/the-epas-data-on-cancer-risk-from-air-pollution-has-gone-dark/ [“After more than two decades of sharing this information with the public, the Environmental Protection Agency has omitted cancer risk estimates from its latest update to national air pollution data.”]
The USDA pushed back hard against the EPA’s early efforts to regulate ammonia emissions from factory farms, including challenging the EPA’s regulatory authority under the Clean Air Act.[1-3] The USDA’s Agricultural Air Quality Task Force stood up for the industry’s ability to generate vast amounts of ammonia at levels that would require community and federal reporting from any other industry.[4] This despite a growing understanding of the health and environmental costs associated with ammonia emissions and its transformation into PM2.5.[5]
Naturally, agricultural exceptionalism has played a role, allowing the USDA to point to the burdens of regulation on small farmers and calling instead for “voluntary and incentive-based efforts to accomplish these reductions.”[6] The USDA’s annual spending is almost 50 times the EPA’s.[7] The Agricultural Air Quality Task Force maintains a website, but does not appear to have held a meeting in almost 10 years.[8]
USDA (2014) Ammonia Emissions: What To Know Before You Regulate – Official White Paper of the USDA Agricultural Air Quality Task Force, p. 1. [In this paper, the USDA used a variety of strategies to undermine the EPA’s efforts, including disinformation, agricultural exceptionalism, high levels of complexity, excessive costs, the lack of monitoring skills, and even challenges to the EPA’s regulatory authority. “EPA’s statutory authority and its organizational structure may limit its ability to adequately and appropriately address a compound like NH3. … Nevertheless, regulation of NH3 emissions under the Clean Air Act will make it extremely difficult for EPA to consider the positive value and need for fertilizer NH3, which could have huge implications for the viability of the domestic and global food supply.”]
USDA (2007) Whitepaper: PM2.5 – The Science of Gas to Particle Conversion And The Regulatory Impact to Agriculture, p. 1. [“Plans are being developed in these areas that address ammonia from agricultural operations, as a precursor or contributor to PM2.5. Yet little is actually known about the actual ammonia emissions from agricultural operations (both animal and cropland), especially from a process standpoint. Furthermore, little is known on just how ammonia reacts in the atmosphere to form fine particulates, and to what degree.”]
USDA (2007) Whitepaper: PM2.5 – The Science of Gas to Particle Conversion And The Regulatory Impact to Agriculture, p. 3. [“The increased use of State Implementation Plans to reduce ammonia emission and the handling of ammonia emission issues by state legislatures is cause for concern. The continued use of the courts and enforcement actions through consent agreements is also alarming. Because ammonia generation in this context is due to natural animal physiology and metabolism, control methodologies become increasingly complex and must take into consideration the health and well being of the animals themselves. These sorts of natural, physiological constraints to controlling ammonia are not present in any other industry currently regulated under the Clean Air Act nor do they seem to have been taken into consideration by regulators and policy makers.”]
See, Ammonia Emissions from Animal Ag
See, Animal Ag PM2.5 & Human Health
USDA (2013) EPA Reactive Nitrogen Report – AAQTF Comments on the Integrated Nitrogen Committee Report, Reactive Nitrogen in the United States: An Analysis of Inputs, Flows, Consequences, and Management Options, Agricultural Air Quality Task Force (AAQTF). [“We support the current approaches of voluntary and incentive-based efforts to accomplish these reductions and do not support an extension of EPA regulatory programs.” Although the AAQTF still maintains a website (https://www.nrcs.usda.gov/conservation-basics/air/usda-agricultural-air-quality-task-force), there is no indication of any reports or actions taken since 2018.]
USDA Spending.gov Department of Agriculture (Data thru 6/29/26). https://www.usaspending.gov/agency/department-of-agriculture?fy=2026
USDA NRCS (n.d.) USDA’s Agricultural Air Quality Task Force. Natural Resources Conservation Service. https://www.nrcs.usda.gov/conservation-basics/air/usda-agricultural-air-quality-task-force
Factory farm operators have some choice about whether to release excess manure nitrogen into the air or water.[1] Because there are some regulatory constraints on factory farm pollutants into water, operations may increase their ammonia emissions in what is known as “pollution swapping.”[2,3]
As the USDA noted, the use of manure lagoons can reduce manure’s nitrogen content through ammonia volatilization, which then allows factory farms “to apply more manure on less land without exceeding crop nutrient requirements.” [4] The lack of air regulations thus encourages some factory farms to generate ammonia emissions rather than additional water pollution.[5,6]
Aillery, M. P., et al., (2005). Managing manure to improve air and water quality. USDA Economic Research Service, Report 9, p. iii. [“To meet a water quality goal, farmers tend to use practices that increase ammonia emissions to the air. Similarly, the practices used to meet an air quality goal would tend to increase nitrogen losses from fields to ground and surface waters. Meeting both air and water quality goals would likely cost more than meeting either air or water goals.”]
van Grinsven, H. J., et al., (2015). Losses of ammonia and nitrate from agriculture and their effect on nitrogen recovery in the European Union and the United States between 1900 and 2050. Journal of environmental quality, 44(2), 356-367, p. 357. [“Ammonia is considered in concentrated animal feeding operation (CAFO) guidelines as a water quality issue in effluent. As a result, some manure management systems in CAFOs enhance NH3 volatilization to lower the N content of manure.”]
Rotz, A., et al., (2021). Environmental assessment of United States dairy farms. Journal of Cleaner Production, 315, 128153, p. 1. [“While strategies are available to reduce NH3 emissions, finding economical and sustainable solutions that do not result in pollution swapping remains a challenge for the dairy industry.” Also see Figure 2: 66% of reactive nitrogen loss from dairy farms is via ammonia emissions.]
Key, N. et al., (2011) Trends and Developments in Hog Manure Management: 1998-2009, USDA Economic Research Service, Bulletin No. 81, p. 23. [“Lagoons reduce manure’s nitrogen content through anaerobic digestion and ammonia volatilization. This allows farmers to apply more manure on less land without exceeding crop nutrient requirements, thereby lowering manure transportation costs by eliminating the need to transport manure to more distant cropland.”]
Aillery, M. P., et al., (2005), p. 13. [“Farmers faced with nitrogen application restrictions through a required nutrient management plan—but not ammonia emission restrictions—might try to reduce the nitrogen content of manure as a means of reducing the amount of land needed for spreading, and limiting hauling costs.”]
National Research Council (2003) Air emissions from animal feeding operations: Current knowledge, future needs. National Academies Press, p. 3 & p. 18. [“Finding 1: Proposed EPA regulations aimed at improving water quality may affect rates and distributions of air emissions from animal feeding operations. … Many AFOs (those currently without comprehensive nutrient management plans) likely will have more manure than they can use on their own cropland, and manure export may be cost prohibitive. Thus, AFOs will have an incentive to use crops and management practices that employ applied nitrogen inefficiently (i.e., volatilize ammonia) to decrease the nitrogen remaining after storage or increase the nitrogen requirement for crop production.”]
The damages from PM2.5 pollution are likely to gain more mainstream coverage due to increasing wildfires and the higher levels of PM2.5 from wildfire smoke that cause many thousands of deaths annually.[1-3] This, along with steady or slightly increasing emissions from factory farms, is likely reversing the long-term trend of reduced PM2.5 levels.[4-6]
Studies suggest that the most cost-effective method for reducing overall PM2.5 pollution levels is by regulating factory farm emissions.[7] Therefore, it seems possible that the growing human health risks of PM2.5 could gain some attention among the cacophony of environmental threats of the 21st century.
Abatzoglou, J. T., & Williams, A. P. (2016). Impact of anthropogenic climate change on wildfire across western US forests. PNAS, 113(42), 11770-11775, Abstract. [“We estimate that human-caused climate change contributed to an additional 4.2 million ha of forest fire area during 1984–2015, nearly doubling the forest fire area expected in its absence.”]
Zhang, M., et al., (2026). Wildfire smoke PM2. 5 and mortality rate in the contiguous United States: A causal modeling study. Science Advances, 12(6), eadw5890, Abstract. [“Wildfire smoke PM2.5 was responsible for ~24,100 all-cause deaths per year in the contiguous United States.”]
Ma, Y., et al., (2024). Long-term exposure to wildland fire smoke PM2. 5 and mortality in the contiguous United States. PNAS, 121(40), e2403960121. Abstract. [Smoke PM2.5 contributed to approximately 11,415 nonaccidental deaths per year in the contiguous United States.”]
See Animal Agriculture Share of U.S. Anthropogenic Ammonia Emissions https://docs.google.com/spreadsheets/d/1naMuMuWYGUU9cvN8FoXni9TkfM65s85DGajbWqSP7xw/edit?gid=0#gid=0 [Compared to the 5 year period from 2000 to 2004, total anthropogenic ammonia emissions for the period from 2020 to 2024 are up ~15%. Animal ag contributes ~70% of total emissions.]
Jiang, J., et al., (2026). Global warming increases ammonia emissions and reduces the efficacy of mitigation actions. Communications Earth & Environment, 7(1), 398, Abstract. [“Here, we show that global warming drives NH3 emission increases of 5-22% across plausible ranges of climate projections in 2091-2100, with > 10% regional increase in NH3 emissions per °C warming.”]
Burke, M., et al., (2023). The contribution of wildfire to PM2. 5 trends in the USA. Nature, 622(7984), 761-766, p. 6. [“We show that recent increases in wildfire smoke have substantially slowed or reversed improvements in ambient PM2.5 concentrations throughout much of the USA…”]
See, Ammonia’s Contribution to PM2.5 [question: Is the reduction of ammonia considered the most cost-effective way to reduce PM2.5 pollution?]