
Globally, PM2.5 is considered the largest or 2nd largest cause of premature death.[1,2]
In the U.S., PM2.5 air pollution is likely the number one environmental cause of premature death.[3,4]
Brauer, M., et al., (2024). Global burden and strength of evidence for 88 risk factors in 204 countries and 811 subnational locations, 1990–2021: a systematic analysis for the Global Burden of Disease Study 2021. The Lancet, 403(10440), 2162-2203, p. 2162 & Figure 2. [“Among the specific risk factors analysed for this study, particulate matter air pollution was the leading contributor to the global disease burden in 2021.”]
Health Effects Institute (2024) State of Global Air 2024. Special Report. Boston, MA, p. 3 & 13, Figure 9. [Air pollution trailing only high blood pressure, with 8.1 million total deaths in 2021. Of total air pollution deaths, 7.8 million due to PM2.5]
Tessum, C. W., et al., (2019). Inequity in consumption of goods and services adds to racial–ethnic disparities in air pollution exposure. PNAS, 116(13), 6001–6006, p. 6001. [“Fine particulate matter (PM2.5) exposure is a major health risk factor in the United States, responsible for 63% of deaths from environmental causes and 3% of deaths from all causes.”]
Note: This section treats air pollution separately from climate change. Naturally, GHG emissions are a form of air pollution, and some gases drive both pollution and climate change. Our focus on these pages is on regional and national air quality apart from climate change.
The factory farming system generates ~70% of total U.S. anthropogenic ammonia, emitted from concentrated manure and from fertilizers on feed crops.[1]
Ammonia is a central precursor gas of PM2.5. Ammonia from animal ag is likely responsible for about 15-20% of total U.S. PM2.5, with that figure possibly underestimated due to the sharply reduced shares of other precursor gases, and the steady or slightly increasing amounts from animal ag.[2]
Many studies point to the potential reduction of agricultural ammonia as the most obvious and cost-effective method for bringing down national PM2.5 levels.[3]
Since animal ag generates the great majority of total agricultural ammonia emissions, efforts to reduce factory farming’s emissions should be a high priority for the EPA. However for decades, factory farms have been exempt from all monitoring and reporting requirements, despite individual farms generating ammonia at daily levels that are regularly 10 to 50 times the levels at which any other facility must report to local and federal authorities.[4,5]
See, Ammonia Emissions from Animal Ag [question: What share of ammonia emissions come from animal agriculture?]
See, Ammonia’s Contribution to PM2.5 [question: What share of PM2.5 is attributable to animal ag?]
See, Ammonia’s Contribution to PM2.5 [question: Is ammonia reduction the most cost-effective way to reduce PM2.5 pollution?]
See, Air Pollution & Animal Ag Overview [question: How high are ammonia emissions on factory farms?]
See, Lack of Air Regulations
PM2.5 inhalation induces inflammatory responses in the lungs as well as systemically.[1] Exposure is understood to be a significant cause of cardiovascular disease, respiratory disease, cancer, and is linked to obesity, diabetes, and premature mortality generally.[2-5] It is likely a cause of neurological diseases, including Alzheimer’s and other types of dementia.[6,7]
The list of diseases in which PM2.5 is implicated is long.[8-11]
Thangavel, P., et al., (2022). Recent insights into particulate matter (PM2. 5)-mediated toxicity in humans: an overview. International journal of environmental research and public health, 19(12), 7511, p. 2 and p. 8. [“The exact mechanisms associated with the impact of PM2.5 on the human body remain unclear. It is hypothesized that inhaled PM accumulates in the lungs and activates inflammatory cells… However, when there is inflammation in the lungs due to PM2.5, the inflammation leads to oxidative stress and causes vascular dysfunction. … Current evidence suggests that translocated PM2.5 causes both systemic inflammation and sympathetic activation in the cardiovascular system.”]
Chen, J., & Hoek, G. (2020). Long-term exposure to PM and all-cause and cause-specific mortality: a systematic review and meta-analysis. Environment international, 143, 105974, p. 20. [“There is clear evidence that both PM2.5 and PM10 are associated with increased mortality from all causes, cardiovascular disease, respiratory disease, and lung cancer.”]
U.S. EPA (2022). Supplement to the 2019 Integrated Science Assessment for Particulate Matter, Office of Research and Development, EPA/600/R-22/028, Table 2-1, pp. 2-3.
Hamanaka, R. B., & Mutlu, G. M. (2018). Particulate matter air pollution: effects on the cardiovascular system. Frontiers in endocrinology, 9, 680. [“Particulate matter)has wide-ranging deleterious effects on human health, particularly on the cardiovascular system. … Chronic and acute exposure to elevated PM2.5 levels is closely associated with elevated risks for ischemic heart disease, heart failure, and cerebrovascular disease.” at p. 4. “PM also appears to be an important contributor to development of metabolic diseases including obesity and type II diabetes.” at p. 9]
Pope, C. A., et al., (2002). Lung cancer, cardiopulmonary mortality, and long-term exposure to fine particulate air pollution. Jama, 287(9), 1132-1141, Abstract. [“Long-term exposure to combustion-related fine particulate air pollution is an important environmental risk factor for cardiopulmonary and lung cancer mortality.”]
Peters, R., et al., (2019). Air pollution and dementia: a systematic review. Journal of Alzheimer’s disease, 70(s1), S145-S163, p. S146. [“Exposure to air pollution, especially fine particulate matter, is thought to increase risk of hypertension, raised lipids, atherosclerosis, oxidative stress, insulin resistance, endothelial dysfunction, enhanced propensity toward coagulation, inflammation, and stroke, all of which also raise risk of cognitive decline and dementia.”]
Huang, X., et al., (2025). A systematic review with a Burden of Proof meta-analysis of health effects of long-term ambient fine particulate matter (PM2. 5) exposure on dementia. Nature Aging, 5(5), 897-908. [“We found a significant association of PM2.5 with Alzheimer’s disease.” At Abstract. “Our study findings corroborate the positive association between PM2.5 exposure and dementia, which is supported by neuropathological studies demonstrating a biologically plausible effect of ambient PM2.5 on dementia risk. PM2.5, particularly nanoscaled particles, can penetrate the human brain via two primary pathways: a direct route through the olfactory nerve, and an indirect route through the circulation system that crosses the blood–brain barrier.” at p. 900]
Bowe, B., et al., (2019). Burden of cause-specific mortality associated with PM2.5 air pollution in the United States. JAMA network open, 2(11), e1915834, Abstract. [“In the contiguous United States, PM2.5 exposure was associated with excess burden of death due to cardiovascular disease, cerebrovascular disease, chronic kidney disease, chronic obstructive pulmonary disease, dementia, type 2 diabetes, hypertension, lung cancer, and pneumonia.”]
Burkart, K., et al., (2022). Estimates, trends, and drivers of the global burden of type 2 diabetes attributable to PM2.5 air pollution, 1990–2019: an analysis of data from the Global Burden of Disease Study 2019. The Lancet Planetary Health, 6(7), e586-e600, p. e586. [“In 2019, approximately a fifth of the global burden of type 2 diabetes was attributable to PM2.5 exposure.”]
Hamanaka, R. B., & Mutlu, G. M. (2018), p. 9. [“Emerging evidence suggests that PM exposure affects timing of puberty and reproductive health in both men and women. Furthermore, air pollution exposure may affect other systems including the central nervous system as well as the gastrointestinal tract and microbiome.”]
Alter, N. C., et al., (2024). Quantifying the association between PM2. 5 air pollution and IQ loss in children: a systematic review and meta-analysis. Environmental Health, 23(1), 101, Abstract. [“Through a systematic review and meta-analysis, we identified a statistically significant relationship between increased exposure to PM2.5 air pollution and reduced cognitive function in children…”]
More than 10,000 deaths per year are attributed to air pollution from animal ag, mostly due to ammonia generated from manure and feed crop fertilizers transforming into PM2.5.[1-6]
Domingo, N. G., et al., (2021). Air quality–related health damages of food. PNAS, 118(20), e2013637118, p. 2. [“Of food-related damages, 80% (12,700 deaths) are attributable to animal-based foods (when impacts of animal feed production are included)…” About 95% of deaths are due to NH3 and PM2.5 per Fig. 1, p.2.]
Thakrar, S. K., et al., (2020). Reducing Mortality from Air Pollution in the United States by Targeting Specific Emission Sources. Environmental Science & Technology Letters, 7(9), 639–645, Figure 3. [“Our focus is on PM2.5…” Of a total of 19,000 deaths from food and agriculture, “livestock rearing” is responsible for ~8,400 deaths and crop production adds 6,600. We estimate that half of crop production deaths are from feed crops, bringing the total to ~11,700. Calculated an alternate way, about 17,300 deaths are attributed to NH3 of which about two-thirds is generated by animal ag, equaling ~11,600.]
Tschofen, P., et al., (2019). Fine particulate matter damages and value added in the US economy. PNAS, 116(40), 19857–19862. [“Agricultural gross external damage is driven by ammonia and primary particulate matter damages, which are caused primarily by livestock emissions and fertilizer application (NH3), and field burning, as well as combustion emissions from agricultural equipment and other crop-related activities (primary PM2.5).” Agriculture responsible for about 29% (230/796) of deaths from attributed sources. Total deaths = 54,000 to 86,000 depending on the model. At 29% this = from ~16,000 to ~25,000. Again assuming about two-thirds from animal ag (50% of NH3 from manure and about 17% from crops specifically for feed) then total deaths from animal ag = ~11,000 to 17,000.]
Note: we assume that ~50% of the ammonia from crops is due to crops specifically grown for feed. This is based on our estimate that ~40% of N from chemical fertilizers is applied to crops specially grown for animal feed (see, Chemical Fertilizer Use on Feed Crops) and a broad estimate that at least an additional ~10% comes from the approximately one-third of total crop acreage (~100m acres) allocated to soybeans and alfalfa, due to nitrogen fixation (about two-thirds used for animal feed). See: U.S. EPA (2011) Reactive Nitrogen in the United States, p. 22. [ “Management of biologically fixed N, insofar as it is possible, is proportionally as critical a task as the management of synthetic N because Nr from BNF is prone to the same loss pathways as Nr from commercial fertilizers.”]
Tessum, C. W., et al., (2019). Inequity in consumption of goods and services adds to racial–ethnic disparities in air pollution exposure. PNAS, 116(13), 6001–6006, See, Supplementary Information, Table S-2. [“Agriculture (15,000 premature deaths): crop and livestock production.” ~7,800 due to livestock and manure, and 5,900 due to crop production = ~10,800 deaths, again assuming half of crop production is due to feed crops.]
Lelieveld, J., et al., (2015). The contribution of outdoor air pollution sources to premature mortality on a global scale. Nature, 525(7569), 367-371. [Estimates 29% of 55,000 deaths in 2010 due to agriculture, or approximately 16,000 deaths (Table 2). Includes agriculture-related deaths due to ozone which are ~7% of deaths. The remainder is due to PM2.5. (Table 1)]
No. A steadily growing body of evidence suggests that even at low or very low concentrations, PM2.5 is harmful to human health.[1-6]
Hamanaka, R. B., & Mutlu, G. M. (2018). Particulate matter air pollution: effects on the cardiovascular system. Frontiers in endocrinology, 9, 680. p. 9. [“The totality of the evidence suggests that there is no “safe” level of PM exposure.”]
Pinault, L., et al., (2016). Risk estimates of mortality attributed to low concentrations of ambient fine particulate matter in the Canadian community health survey cohort. Environmental health, 15(1), 18, Abstract & p. 14. [“Increased risks of non-accidental, circulatory, and respiratory mortality were observed even at very low concentrations of ambient PM2.5. …at values lower than the WHO guideline of 10 µg/m3.”]
Giannadaki, D., et al., (2018). Estimating health and economic benefits of reductions in air pollution from agriculture. The Science of the Total Environment, 622–623, 1304–1316, p. 1305. [“Fine particulates can cause health impacts even at very low concentrations. … there is no clear evidence for a safe concentration limit below which health impacts can be fully prevented.”]
Roper, C., et al., (2026). A systematic review of low-level ambient fine particulate matter (PM2. 5) exposures and adverse cardiovascular health outcomes. Environmental Pollution, 127978, Abstract. [“While not universally consistent, significant associations were observed between PM2.5 exposure and adverse cardiovascular effects, even at levels deemed compliant with current regulations.”]
U.S. EPA (2022) Supplement to the 2019 Integrated Science Assessment for Particulate Matter, p. ESii. [“Relative to the studies evaluated in the 2019 PM ISA, many of the studies report positive associations at lower PM2.5 concentrations (i.e., annual PM2.5 concentrations ranging from 5.9 to 16.5 micrograms per cubic meter (µg/m3); mean 24-hour avg PM2.5 concentrations ranging from 7.1 to 15.4 µg/m3).”]
Castillo, F., et al., (2026). Sex-Specific Associations between Long-term Air Pollution Exposure and Coronary Atherosclerosis at Cardiac CT. Radiology, 319(3), e252086, p. 9. [“The association between PM2.5 exposure and obstructive coronary artery disease (CAD) appears to be driven by longer-term, cumulative exposures. … Notably, the association between air pollution and CT-derived measures of CAD persisted even among patients exposed to air pollution concentrations below current Canadian Ambient Air Quality Standards. These findings emphasize the detrimental cardiovascular effects of air pollution, even at relatively low levels…”]
Conservatively estimated, ~15-20% of PM2.5 comes from animal agriculture. This figure is based on an estimate that agriculture is responsible for ~20-25% of PM2.5, and animal ag is responsible for ~80% of agriculture’s ammonia contributions, by far the largest agricultural precursor gas.[1,2]
This may be an underestimate due to the steady decrease in precursor gases from all other industries, along with the increase in gases, especially ammonia, from animal agriculture.[3,4]
See, Agricultural PM2.5 Pollution [question: What share of PM2.5 pollution comes from U.S. agriculture?]
See, Animal Agriculture Share of U.S. Anthropogenic Ammonia Emissions 2020. https://docs.google.com/spreadsheets/d/1naMuMuWYGUU9cvN8FoXni9TkfM65s85DGajbWqSP7xw/edit?gid=0#gid=0 [Animal ag contributes ~79% of agricultural ammonia, the central agricultural PM2.5 precursor gas.]
U.S. EPA (2022) Our Nation’s Air – Trends Through 2021. [Sulfur dioxide emissions down 92% between 1990 and 2020 with the great majority of that reduction since 2000. Nitrogen oxides down 70%, with almost all that reduction since the year 2000.]
See, Animal Agriculture Share of U.S. Anthropogenic Ammonia Emissions 2020. https://docs.google.com/spreadsheets/d/1naMuMuWYGUU9cvN8FoXni9TkfM65s85DGajbWqSP7xw/edit?gid=0#gid=0 [Ammonia emissions increased about 15% between the periods 2000-2004 and 2020-2024.]
Yes. Many studies have concluded that the reduction of ammonia from agriculture is the most urgent, sensible, and cost-effective route to an overall reduction in PM2.5 in the U.S. atmosphere.[1-6]
Since animal ag is responsible for ~70% of total U.S. ammonia emissions, any efforts to reduce ammonia must start with the factory farming system.[7]
Van Damme, M., et al., (2021). Global, regional and national trends of atmospheric ammonia derived from a decadal (2008–2018) satellite record. Environmental Research Letters, 16(5), 055017, pp. 1-2. [“In Europe, China and the U.S. in particular, reduction in emissions of nitrogen and sulfur oxides have demonstrably resulted in an increased amount of atmospheric gas-phase NH3 during the last decade [21–24]. Several studies have concluded that reducing NH3 emissions would be a cost-effective strategy to reduce PM2.5 concentrations.”]
Sutton, M. A., et al., (2020). Alkaline air: changing perspectives on nitrogen and air pollution in an ammonia-rich world. Philosophical Transactions of the Royal Society A, 378(2183), 20190315, pp. 2 & 7. [“Considering the present, across much of Europe and North America we now inherit a world where substantial emission controls have already been achieved for SO2 and NOx. … The reminder of ammonia as alkaline air is highly relevant to the present, as emissions of SO2 and NOx have decreased greatly over the last 30 years, leaving European and North American atmospheres increasingly rich in NH3.”]
Paulot, F., & Jacob, D. J., (2014). Hidden cost of US agricultural exports: particulate matter from ammonia emissions. Environmental science & technology, 48(2), 903-908. [“Previous work suggests that the average U.S. annual health cost (morbidity + mortality) of 1 kg of NH3 emitted to the atmosphere ranges from 3 to 13 US$ (2006) depending on the valuation method, 2 and 9 times greater than the cost of 1 kg of SO2 and NOx, respectively.”]
Pinder, R. W., et al., (2007). Ammonia emission controls as a cost-effective strategy for reducing atmospheric particulate matter in the eastern United States. Environ. Sci. Technol. 41, 380-386, p. 385. [“While there are definite challenges inherent in the policy options, ammonia emission reductions offer significant cost savings compared to further controls on SO2 and NOx.”]
Gu, B., et al., (2021). Abating ammonia is more cost-effective than nitrogen oxides for mitigating PM2.5 air pollution. Science, 374(6568), 758-762. [“North America has the largest benefit-to-cost ratio for NH3 mitigation, followed by Europe and Asia, suggesting reduction of NH3 emission as a favorable option to increase social benefit.” at p. 3. “The main opportunities for NH3 abatement concern agricultural sources, for which abatement measures are relatively easy and inexpensive.” at p. 4. Also see Supplementary Materials Table S-1: marginal abatement cost is less than 10% of marginal mortality cost.]
See, Animal Agriculture Share of U.S. Anthropogenic Ammonia Emissions 2020. https://docs.google.com/spreadsheets/d/1naMuMuWYGUU9cvN8FoXni9TkfM65s85DGajbWqSP7xw/edit?gid=0#gid=0 [Animal ag contributes ~71% of total U.S. anthropogenic ammonia]
Yes, the EPA reports that PM2.5 levels from 2000 to 2024 have decreased by 46%.[1]
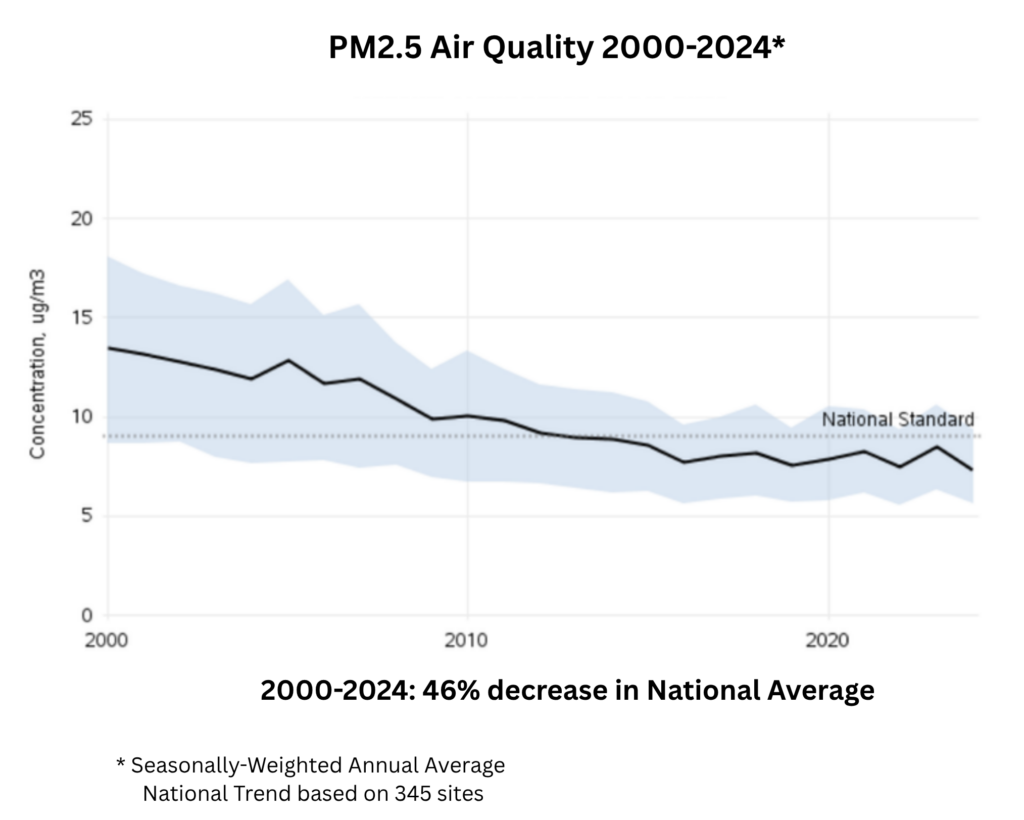
This is due to the reductions of 2 of the 3 major precursor gases – nitrogen oxides and sulfur dioxide.[2] However, steady or slightly increasing ammonia levels from animal ag along with increasing wildfires may slow or reverse this long-term trend.[3-7]
U.S. EPA (2026) Particulate Matter (PM2.5) Trends — National Trends (includes chart).
https://www.epa.gov/air-trends/particulate-matter-pm25-trendsU.S. EPA (2022) Our Nation’s Air – Trends Through 2021. [Sulphur dioxide emissions down 92% between 1990 and 2020 with the great majority of that reduction since 2000. Nitrogen oxides down 70%, with almost all of that reduction since the year 2000]
See, Animal Agriculture Share of U.S. Anthropogenic Ammonia Emissions 2020. https://docs.google.com/spreadsheets/d/1naMuMuWYGUU9cvN8FoXni9TkfM65s85DGajbWqSP7xw/edit?gid=0#gid=0 [Ammonia emissions increased about 15% between the periods 2000-2004 and 2020-2024.]
Burke, M., et al., (2023). The contribution of wildfire to PM2. 5 trends in the USA. Nature, 622(7984), 761-766, p. 6. [“We show that recent increases in wildfire smoke have substantially slowed or reversed improvements in ambient PM2.5 concentrations throughout much of the USA…”]
Zhang, D., et al., (2023). Wildland fires worsened population exposure to PM2. 5 pollution in the contiguous United States. Environmental science & technology, 57(48), 19990-19998, p. 19996. [“Under the stricter standard of 9 ug/m3, the average affected population would increase to 167.23 million without considering the effect of fire smoke and 197.68 million with the contribution of fire smoke.”]
Ma, Y., et al., (2024). Long-term exposure to wildland fire smoke PM2. 5 and mortality in the contiguous United States. PNAS, 121(40), e2403960121, Abstract. [U.S. wildfires from 2007 through 2020 reported as “contributing to approximately 5% of all-source PM2.5.”]
Lee, H., & Jaffe, D. A. (2024). Wildfire impacts on O3 in the continental United States using PM2. 5 and a generalized additive model (2018–2023). Environmental science & technology, 58(33), 14764, Abstract. [“Days with smoke have an average of 11 µg m/3 more PM2.5 and… account for 94% of all days that exceed the daily PM2.5 health standard (35 µg m/3)…”]
Yes. PM2.5 is a “criteria pollutant” considered harmful to public health and the environment, for which the EPA sets National Ambient Air Quality Standards (NAAQS), limiting how much is present in outdoor air – not how much any one facility or industry may emit.[1] The NAAQS are ambient air quality standards, measured in micrograms per cubic meter of air (µg/m3) averaged over three years.[2] Air monitoring and compliance is done by the states, Tribes, and local agencies.[3]
The current annual standard for PM2.5 is 9 micrograms per cubic meter, and 35 µg/m3 for a 24-hour period.[4] This is higher than the World Health Organization’s (WHO) recently revised guidelines of 5 µg/m3 (annual) and 15 µg/m3 (24-hour period).[5]
The EPA reports that 119 U.S. counties did not meet the average standard of 9 µg/m3 for the years from 2020-2022.[6] However, of the approximately 3,140 counties in the U.S., only 1,000 have air monitoring equipment.[7] And of the 1,000 that do, only about 540 (17% of total counties) can effectively monitor PM2.5.[8]
Under the current administration, the EPA was halted by a federal appeals court from increasing the standard, when attempting to revert to 12 µg/m3 as the annual average standard.[9]
U.S. EPA (2025) Particulate Matter (PM) Pollution. https://www.epa.gov/pm-pollution/setting-and-reviewing-standards-control-particulate-matter-pm-pollution#standards
U.S. EPA (2025) NAAQS Table. https://www.epa.gov/criteria-air-pollutants/naaqs-table
U.S. EPA ( 2025). Basic Information about Air Quality SIPs. https://www.epa.gov/air-quality-implementation-plans/basic-information-about-air-quality-sips
U.S. EPA (2025) NAAQS Table.
World Health Organization. (2021). WHO global air quality guidelines: particulate matter (PM2.5 and PM10), ozone, nitrogen dioxide, sulfur dioxide and carbon monoxide, pp. 78 & 88.[AQG or Air Quality Guideline set at 5ug/m3 for “annual mean value” and at 15ug/m3 for “short term (24 hour)” level.]
U.S. EPA (2024) Fine Particle Concentrations for Counties with Monitors Based on Air Quality Data from 2020 – 2022.
U.S. EPA (2026) Do you have outdoor air monitoring data for all counties in the U.S.? [“No, approximately 1,000 out of the roughly 3,000 U.S. counties have monitoring data.” https://www.epa.gov/outdoor-air-quality-data/do-you-have-outdoor-air-monitoring-data-all-counties-us
Wells, C., et al., (2025) Is Your County’s PM₂.₅ Monitor Capturing Peak Concentration? Nelson Institute Center for Sustainability and the Global Environment (SAGE), University of Wisconsin-Madison [“Valid PM₂.₅ monitoring data for 2023 were available for only 536 U.S. counties, representing approximately 17% of all counties.”]
Matthew Daly (June 2026) Appeals court rejects Trump EPA bid to abandon rule restricting deadly soot pollution. Associated Press. https://apnews.com/article/epa-soot-pollution-trump-zeldin-coal-dce0b711b208cec535de1f472079d219
The EPA estimates that in 2025, ~78 million Americans lived in counties with PM2.5 levels that exceeded the National Ambient Air Quality Standards (NAAQS).[1]
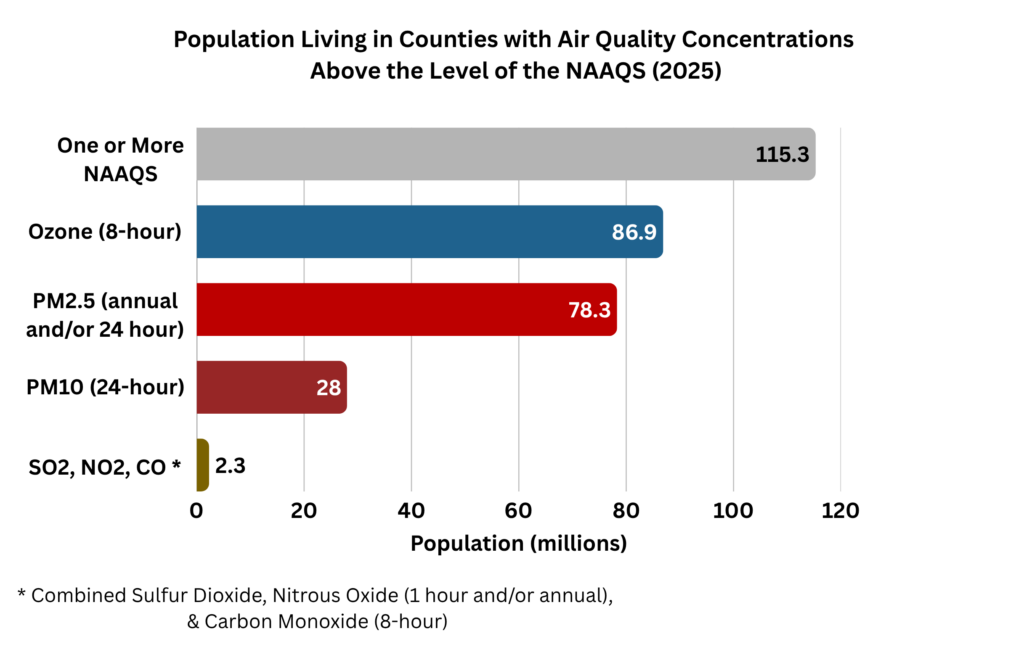
However, this may not be a full accounting because monitoring systems are not well developed, as the EPA acknowledges.[2,3] Increasing wildfire smoke along with steady or slightly increasing levels of animal ag ammonia emissions threaten to increase the number of Americans experiencing high levels of PM2.5 .[4,5]
U.S. EPA (February 19, 2026) Air Quality – National Summary, Emissions Trends
U.S. EPA (2026) Do you have outdoor air monitoring data for all counties in the U.S.? [“No, approximately 1,000 out of the roughly 3,000 U.S. counties have monitoring data.”] https://www.epa.gov/outdoor-air-quality-data/do-you-have-outdoor-air-monitoring-data-all-counties-us
Wells, C., et al., (2025) Is Your County’s PM₂.₅ Monitor Capturing Peak Concentration? Nelson Institute Center for Sustainability and the Global Environment (SAGE), University of Wisconsin-Madison .[“Valid PM₂.₅ monitoring data for 2023 were available for only 536 U.S. counties, representing approximately 17% of all counties.”]
Burke, M., et al., (2023). The contribution of wildfire to PM2. 5 trends in the USA. Nature, 622(7984), 761-766, p. 6. [“We show that recent increases in wildfire smoke have substantially slowed or reversed improvements in ambient PM2.5 concentrations throughout much of the USA…”]
See, Animal Agriculture Share of U.S. Anthropogenic Ammonia Emissions 2020. https://docs.google.com/spreadsheets/d/1naMuMuWYGUU9cvN8FoXni9TkfM65s85DGajbWqSP7xw/edit?gid=0#gid=0 [Ammonia emissions increased about 15% between the periods 2000-2004 and 2020-2024.]
Yes, by wide margins. The EPA’s PM2.5 standard for a 24-hour concentration threshold is 35 ug/m3 (35 micrograms per cubic meter).[1] Reports have estimated levels inside factory farms at 5 to 100 times that limit.[2,3] Naturally, local ambient PM2.5 levels are also higher near factory farms.[4]
U.S. EPA (2025) Timeline of Particulate Matter (PM) National Ambient Air Quality Standards (NAAQS). https://www.epa.gov/pm-pollution/timeline-particulate-matter-pm-national-ambient-air-quality-standards-naaqs
Li, Q., et al., (2011). Fine particulate matter in a high-rise layer house and its vicinity. Transactions of the ASABE, 54(6), 2299-2310, p. 2303. [“The average concentration of PM2.5 inside the house was as high as 141 ug per m-3. This high concentration may potentially compromise the health of the workers and the production efficiency of the hens, and thus the profit of the farm.”]
Bist, R. B., & Chai, L., (2022). Advanced strategies for mitigating particulate matter generations in poultry houses. Applied Sciences, 12(22), 11323, Abstract. [“To protect public health and welfare, the occupational exposure limit for PM10 and PM2.5 are suggested not to exceed 150 ug/m3 and 35 ug/m3 respectively, based on 24-h concentrations thresholds as suggested by US EPA. However, the levels of PM10 and PM2.5 in poultry houses could be 100 times higher than that limit. For instance, PM10 and PM2.5 levels in cage-free henhouses are higher than 15,000 ug/m3 and 3,500 ug/m3 in wintertime.”]
Chamanara, S., et al., (2025). Geography of animal feeding operations and their contribution to fine particulate matter pollution in vulnerable communities in the United States. Communications Earth & Environment, 6(1), 620, p. 3. [“Using geographically optimized matching, we find that AFOs raise local PM2.5 levels by 28% near cattle operations and 11% near hog farms, even after accounting for urban and industrial confounders.”]