
Escaped atmospheric ammonia (NH3) comes primarily from manure on factory farms (both livestock and poultry) and to a lesser degree from fertilizer application on crops that go to animal feed.[1,2]
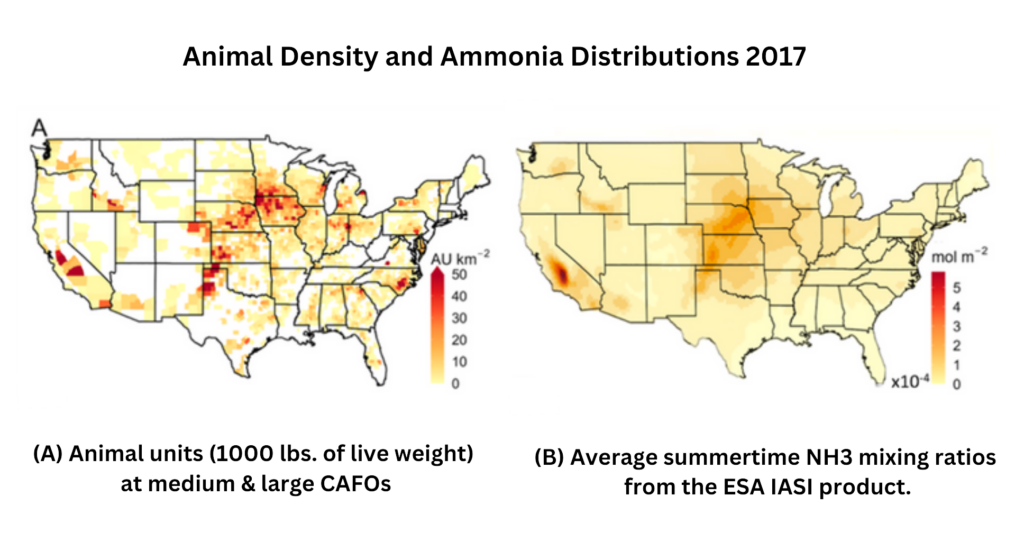
Factory farm locations correlate strongly with ammonia emission densities.[3]
U.S. EPA (2024) 2020 NEI Supporting Data and Summaries – Data Queries for Sector Summaries.[Query: National/Ammonia NH3/Livestock Waste (49.2%), fertilizer application (33.5%), agricultural field burning (2.7%) of total (5,482,484 tons)]
Giannadaki, D., et al., (2018). Estimating health and economic benefits of reductions in air pollution from agriculture. The Science of the Total Environment, 622–623, 1304–1316, p. 1305. [“The main pollutant from agricultural activity is ammonia (NH3), mainly from animal husbandry and its associated manure processing, and to a lesser extent from fertilizer use.”]
Chart from Burns, A. M., et al., (2023). Data Gap: Air Quality Networks Miss Air Pollution from Concentrated Animal Feeding Operations. Environmental Science & Technology, 57(49), 20718–20725.
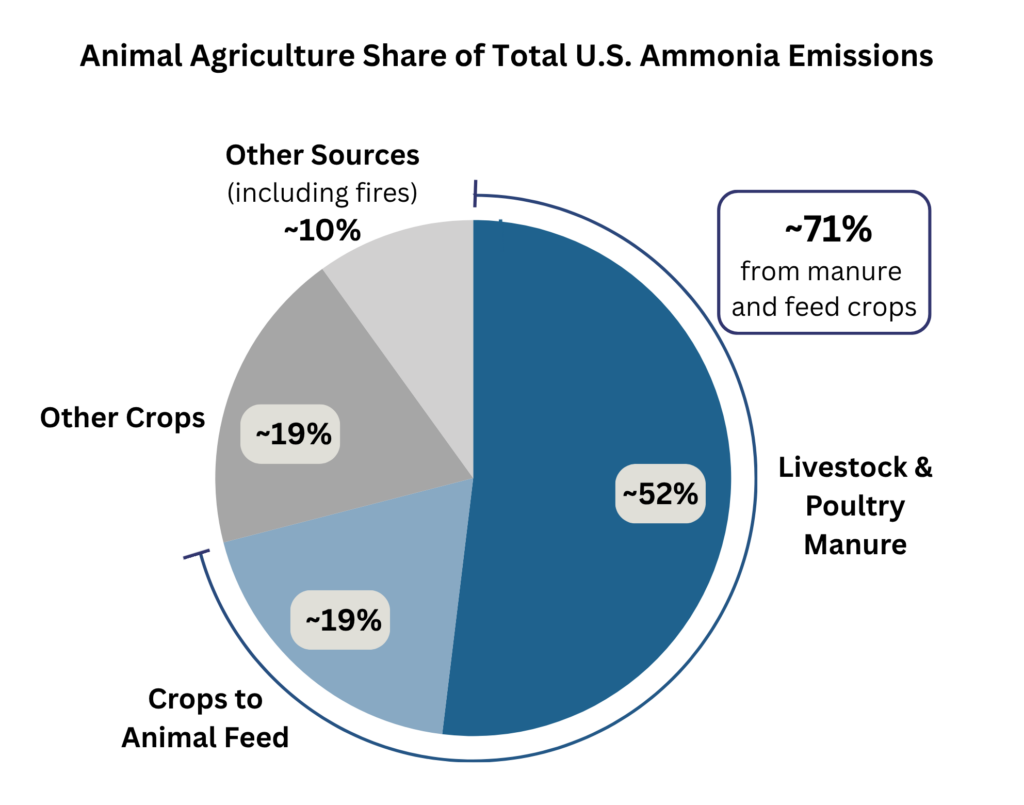
An estimated 70% of total U.S. anthropogenic ammonia emissions (NH3) is from animal ag.[1,2]
The largest source is livestock and poultry manure at ~52% of total ammonia. About 19% of animal ag emissions are generated from feed crops. (Since more than half of U.S. crops are grown for animal feed, we add half of the total ammonia that escapes from crop production (i.e., half of 38%), which includes fertilizer application and the field burning of residue.)[3]
The 2020 data from the EPA National Emissions Inventory [NEI] assesses that agriculture is responsible for ~91% of anthropogenic U.S. ammonia emissions.[4]
See Animal Agriculture Share of Anthropogenic Ammonia Emissions 2020. https://docs.google.com/spreadsheets/d/1naMuMuWYGUU9cvN8FoXni9TkfM65s85DGajbWqSP7xw/edit?gid=0#gid=0
U.S. EPA (2024) 2020 NEI Supporting Data and Summaries – Data Queries for Sector Summaries. [Query: National/Ammonia NH3/Livestock Waste (49.2%), Fertilizer Application (33.5%), Agricultural Field burning (2.7%) of total. Total ag ammonia (4,675,035) / total ammonia (5,482,484 tons) = 85.3%. EPA includes 321,482 tons of ammonia from unprescribed wildfires in total ammonia; not including this amount (thereby considering only anthropogenic) makes ag contribution ~91%. (Not included in the EPA tallies are other significant natural (non-anthropogenic) contributions of ammonia emissions including from non-agricultural soils and from oceans. See, Bouwman, A. F., et al., (1997). A global high‐resolution emission inventory for ammonia. Global biogeochemical cycles, 11(4), 561-587, Table 11)]
For calculations that crops used specifically for feed generate at least 50% of ammonia from crop production, see, Animal Ag’s Contributions to Water Pollution which shows that ~40% of N from chemical fertilizers and ~80% of N from crop fixation is from crops used specifically for feed.
See Animal Agriculture Share of Anthropogenic Ammonia Emissions 2020. https://docs.google.com/spreadsheets/d/1naMuMuWYGUU9cvN8FoXni9TkfM65s85DGajbWqSP7xw/edit?gid=0#gid=0
The EPA has ruled that any release of ammonia above 100 pounds in a 24-hour period is a “reportable quantity,” requiring immediate notification to both federal authorities and the local community.[1-3] Factory farms are exempt from all reporting requirements.[4,5]
U.S. EPA (2026) Emergency Planning and Community Right-to-Know Act (EPCRA), Determining the amount released for Ammonia and Ammonium Hydroxide for Release Notification Requirements under CERCLA section 103 and EPCRA section 304. [“Ammonia (CAS number 7664-41-7) is an Extremely Hazardous Substance (EHS), listed at 40 CFR Part 355 Appendix A and Appendix B with a reportable quantity (RQ) of 100 lbs. Both ammonia and ammonium hydroxide (CAS number 1336-21-6) are listed as Comprehensive Environmental Response, Compensation, and Liability Act (CERCLA) hazardous substances at 40 CFR 302.4. Under CERCLA, ammonia is listed with an RQ of 100 lbs and ammonium hydroxide is listed with an RQ of 1,000 lbs.”]
CFR Title 40 § 302.4, 302.4 Hazardous substances and reportable quantities.
U.S. EPA (2026) Emergency Planning and Community Right-to-Know Act (EPCRA) – Reportable Release Time Period. https://www.epa.gov/epcra/reportable-release-time-period [“Over what time period must a Reportable Quantity (RQ) of a hazardous substance be released for that release to be reportable? EPA has stated that the period during which the person in charge must measure whether an RQ or more has been released is 24 hours. Reporting must occur immediately upon knowledge of the release.”]
U.S. EPA (2021) Emission Estimation Methods for Animal Feeding Operations. Office of Air and Radiation, Office of Air Quality Planning and Standards, pp. 3-1 – 3-6. [A brief history from the EPA covering some aspects of their stalled and eventually doomed efforts to monitor and regulate ammonia emissions from factory farms. “In the years since the Air Compliance Agreement (in 2005) … EPA has finalized rulemakings to provide a reporting exemption for air emissions from animal waste at farms from both CERCLA and EPCRA.”]
Note that releases from non-exempt industries (i.e., other than factory farms) that are continuous or stable in quantity and rate have more limited reporting requirements. See: EPA (2026) Emergency Planning and Community Right-to-Know Act (EPCRA) – CERCLA and EPCRA Continuous Release Reporting. [“The release reporting regulations of CERCLA and EPCRA provide reduced reporting options for “continuous releases” of CERCLA hazardous substances and EPCRA Extremely Hazardous Substances (EHSs). This relief applies to facilities with releases of CERCLA hazardous substances and EPCRA EHSs that are “continuous” and “stable in quantity and rate.”]
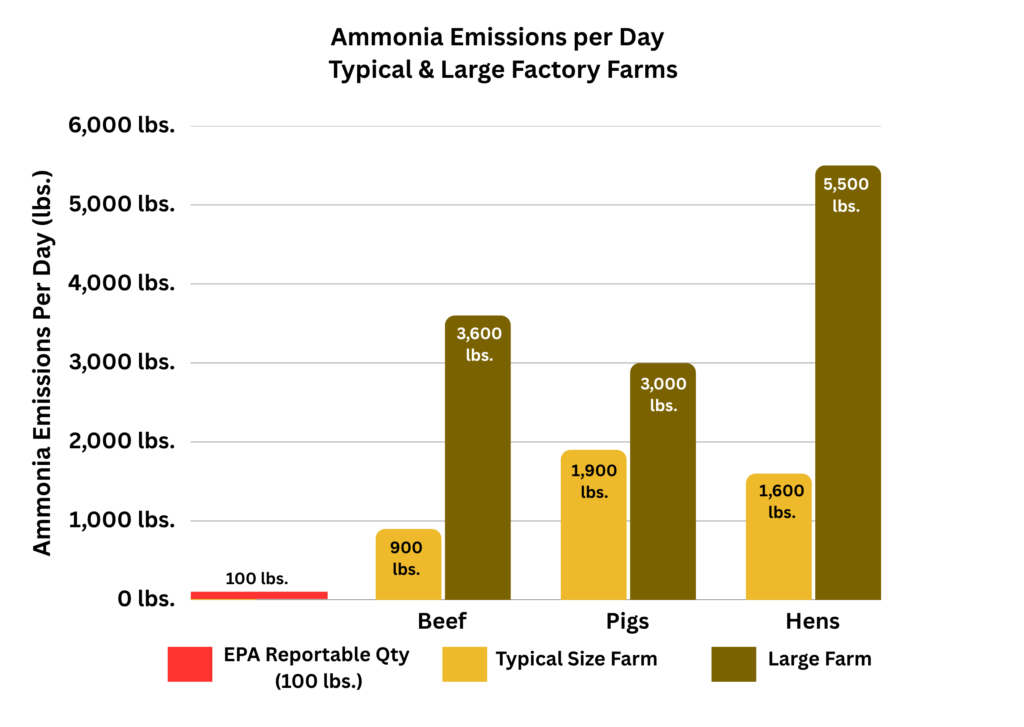
Depending on animal type, a typical factory farm generates between 100 and 2,000 pounds of ammonia per day.[1] Daily emissions of 2,000 pounds would be 20 times the EPA’s “reportable quantity” for which any other industrial facility would be required to alert both federal authorities and the local community.[2]
Large factory farms can generate more than 5,000 pounds of ammonia per day, or more than 50 times the reportable quantity.[3,4]
See Ammonia Emissions by Animal Type and Farm Size https://docs.google.com/spreadsheets/d/1kJ0hu4JYcDz3liG2iHc56zhAiMg5mxvopynve3YdxDg/edit?gid=0#gid=0 [A “typical” factory farm is defined as the approximate size (in animal numbers) for which about half of production is above that size and half below.]
See previous question.
Note: A large factory farm is defined here as among those that generate the top 5-10% of total production. There are wide variations in ammonia emissions of individual factory farms depending on species, number of confined animals, manure management systems, diets, and climate factors. See: U.S. EPA (2024) Development of Emissions Estimating Methodologies for Animal Feeding Operations, Volume 1, Overview Report Draft, p. 2-1. [“The volatilization of NH3 from any AFO operation can be highly variable depending on total NH3 concentration, temperature, pH, and storage time.”]
For further support of these figures, see: EPA (2023) Emergency Release Notification Requirements for Animal Waste Air Emissions under the Emergency Planning and Community Right-to-Know Act (EPCRA) – Technical Background Document, Table 2-6, pp. 12-13. [“If the Reportable Quantity were raised to 500 lbs, the preliminary estimated regulated universe would decrease from 37,891 to approximately 14,825 farms.” At 1,000 pounds (10 times the reportable quantity) more than 5,000 factory farms could be regulated, and at 5,000 pounds (50 times the EPA’s level for all other industries) about 860 could be regulated.]
The EPA has estimated that the number of factory farms that could be regulated if there were a minimum standard of 1,000 pounds per day, would be about 5,300 operations.[1]
At 5,000 pounds the “estimated regulated universe” would be about 860 factory farms.[2]
EPA (2023) Emergency Release Notification Requirements for Animal Waste Air Emissions under the Emergency Planning and Community Right-to-Know Act (EPCRA) – Technical Background Document, Table 2-6, pp. 12-13. [“At 1,000 lbs, the estimated regulated universe would decrease even further to approximately 5,332 reporting farms.”]
EPA (2023) Emergency Release Notification Requirements for Animal Waste Air Emissions, Table 2-5, p. 12 [Pig factory farms = ~520, egg-laying hens ~220, dairy operations ~120]
Based on 2020 EPA estimates, waste from farmed animals is responsible for about 52% of total U.S. anthropogenic ammonia (NH3) emissions, with cattle and pigs accounting for about 79% of the farmed animal share.[1,2]
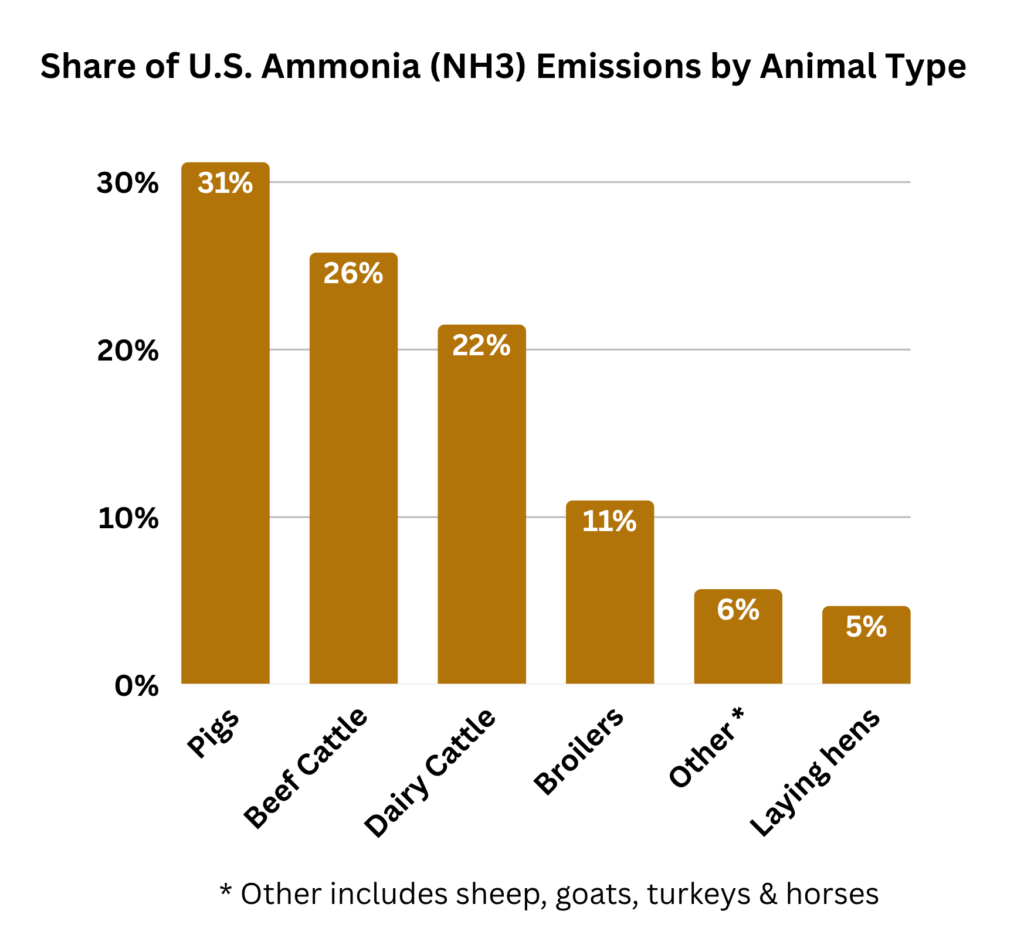
U.S. EPA (2023) 2020 National Emissions Inventory Technical Support Document: Agriculture – Livestock Waste, EPA-454/R-23-001j, Table 10-10. [NH3 emissions in tons by animal type.] And see, Ammonia Emissions by Animal Type and Farm Size https://docs.google.com/spreadsheets/d/1kJ0hu4JYcDz3liG2iHc56zhAiMg5mxvopynve3YdxDg/edit?gid=0#gid=0
Total U.S. NH3 emissions in tons at U.S. EPA (2024) 2020 NEI Supporting Data and Summaries – Data Queries for Sector Summaries. [Query: National/Ammonia NH3 for all surveyed sectors (5,482,484 tons)]
Yes. Compared to the 5 year period from 2000 to 2004, total anthropogenic ammonia emissions for the period from 2020 to 2024 are up ~15%.[1]
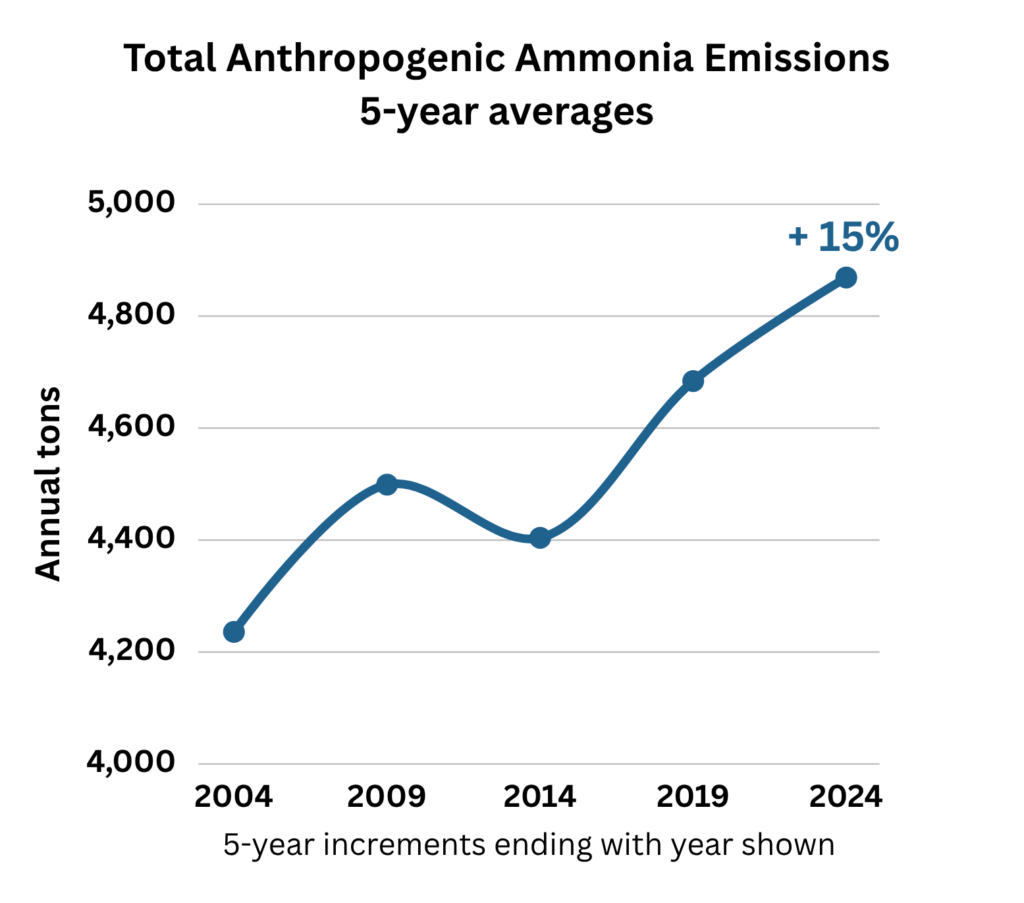
During this time, almost every other air quality indicator in the U.S. has shown a decrease.[2]
Climate change will likely contribute to increasing ammonia emissions, because emissions increase with higher temperatures.[3]
see Agriculture / Animal Ag Share of Anthropogenic Ammonia Emissions 2020 https://docs.google.com/spreadsheets/d/1naMuMuWYGUU9cvN8FoXni9TkfM65s85DGajbWqSP7xw/edit?gid=0#gid=0
U.S. EPA (2022) Our Nation’s Air, Status and Trends Through 2021. https://gispub.epa.gov/air/trendsreport/2022/documentation/AirTrends_Flyer.pdf
Jiang, J., et al., (2026). Global warming increases ammonia emissions and reduces the efficacy of mitigation actions. Communications Earth & Environment, 7(1), 398, Abstract. [“Here, we show that global warming drives NH3 emission increases of 5-22% across plausible ranges of climate projections in 2091-2100, with > 10% regional increase in NH3 emissions per °C warming.”]
Possibly, though there is still much uncertainty.[1,2] More reports point to underestimates than those that report overestimates.[3-5]
Reasons for the uncertainties and potential underestimates: Ammonia is not considered one of the 6 “criteria air pollutants” by the EPA’s National Ambient Air Quality Standards (NAAQS) and therefore it is less diligently tracked.[6]
Although the EPA monitors air quality from data acquired from thousands of monitoring sites,[7] there is no system in place to monitor ammonia emissions at factory farms, the largest NH3 emitters, since they are almost entirely unregulated.[8,9]
Because air pollution policy in the U.S. is focused on “point sources” (such as industrial plants), mobile emissions, and highly populated areas, monitoring sites are sparsely located in rural agricultural areas. “Approximately one-third of all EPA air quality sites are located in rural settings, and ~10% are in agricultural locations.”[10]
The tendency to underestimate NH3 concentrations may be in part due to a lack of accurate or standardized modeling methods and to the quick transformations of ammonia into other compounds.[11,12]
Li, Z., et al., (2026). Ammonia emissions and depositions over the contiguous United States derived from IASI and CrIS using the directional derivative approach. Atmospheric Chemistry and Physics, 26(1), 703-721. Abstract [“NH3 flux estimates remain highly uncertain due to limited direct observations and complex emission–deposition processes.”]
Van Damme, M., et al., (2018). Industrial and agricultural ammonia point sources exposed. Nature, 564(7734), 99-103. [“However, the total ammonia budget and the attribution of emissions to specific sources remain highly uncertain across different spatial scales.”]
Rotz, A., et al., (2021). Environmental assessment of United States dairy farms. Journal of Cleaner Production, 315, 128153, Table 5. [Experienced USDA researchers concluded that ammonia emissions from U.S. dairy farms were ~3 times the volume that the EPA estimated. 2,026,639 Gg = approx. 1.41 billion pounds or 704,000 tons. EPA assessment for 2014 dairy was 226,000 tons. For 2014 figure, see U.S. EPA (2023) 2020 National Emissions Inventory Technical Support Document: Agriculture – Livestock Waste, EPA-454/R-23-001j, Table 10-10 (NH3 emissions in tons by animal type)]
Balasubramanian, S., et al., (2021). The food we eat, the air we breathe: a review of the fine particulate matter-induced air quality health impacts of the global food system. Environmental Research Letters, 16(10), 103004, p. 20. [“Studies report large underestimates in total NH3 emissions over agricultural areas that are as high as 40% in China and 200%–450% across the United States (Heald et al 2012, Battye et al 2016, Bray et al 2017).”]
Driscoll, C., et al., (2024). Atmospheric reduced nitrogen: Sources, transformations, effects, and management. Journal of the Air & Waste Management Association, 74(6), 362-415, Abstract. [“Observations suggest a discrepancy between trends in emissions and deposition of reduced nitrogen in the U.S., likely due to an underestimate in emissions.”]
U.S. EPA (2024) Criteria Air Pollutants. https://www.epa.gov/criteria-air-pollutants [The 6 criteria air pollutants are ozone, particulate matter, carbon monoxide, lead, sulfur dioxide, and nitrogen dioxide.]
U.S. EPA (2024) Air Quality System (AQS), AQS Primer, 3.2 Geography [“In 2020, data was collected at 2,498 AQS sites. An AQS site is a distinct geographic location that has one or more monitors. Not every site measures the same parameters.”]
See, Lack of Air Regulations
The National Agricultural Law Center (August 2025) Federal Court Upholds Reporting Exemption for Livestock Emissions. [“Following the court’s ruling (on August 7, 2025), operators of CAFOs and other livestock facilities will continue to be exempt from both CERCLA and EPCRA notification requirements for air emissions from animal waste.”]
Burns, A. M., et al., (2023). Data Gap: Air Quality Networks Miss Air Pollution from Concentrated Animal Feeding Operations. Environmental Science & Technology, 57(49), 20718–20725, 20721.
Li, Y., et al., (2016). Increasing importance of deposition of reduced nitrogen in the United States. PNAS, 113(21), 5874-5879, Abstract. [“Ammonia has historically not been routinely measured because there are no specific regulatory requirements for its measurement.”]
Li, Z., et al., (2026), p. 704. [“However, large-scale ground-based measurements of NH3 emissions are sparse due to the challenges associated with accurately capturing gaseous NH3. Observations of NH3 fluxes are further constrained by its sharp spatial gradients and short tropospheric lifetime, typically less than 24 h.”]
The impacts of ammonia from animal ag are unusually difficult to assess.
Ammonia is a colorless, fast-moving gas emanating in large quantities from tens of thousands of locations across the nation.[1] Ammonia quickly transforms into a variety of complex compounds that continually transform and react with other compounds.[2] Nitrogen-based pollutants constantly cycle from water to soil to air and back again.[3] Ammonia causes significant, complex, and variable damages in ecosystems spanning plant life, wildlife, forests, soil, air, and water.[4,5] Once released these compounds move among countries and oceans.[6]
Because of these complexities, the long-term consequences of nitrogen pollution, especially ammonia, are difficult to assess and poorly understood on a societal level, despite impacting almost every type of ecosystem.[7-10]
EPA (2023) Emergency Release Notification Requirements for Animal Waste Air Emissions under the Emergency Planning and Community Right-to-Know Act (EPCRA) – Technical Background Document, Table 2-6, pp. 12-13. [“Table 2-3 summarizes the estimated subset of operations in each animal category that could be required to report under a potential rule, given their average inventory. EPA estimated that 37,891 operations would report, based on meeting or exceeding 100 lb Reportable Quantity for ammonia.”]
Davidson, E. A., et al., (2011). Excess nitrogen in the US environment: trends, risks, and solutions. Issues in ecology, (15). Glossary, p. 14.
Galloway, J. N., et al., (2003). The nitrogen cascade. Bioscience, 53(4), 341-356. [“The same atom of Nr can cause multiple effects in the atmosphere, in terrestrial ecosystems, in freshwater and marine systems, and on human health.” Abstract]
U.S. EPA (2011) Reactive Nitrogen in the United States: An Analysis of Inputs, Flows, Consequences, and Management Options, A Report of the EPA Science Advisory Board, p. 4. [“However, a major consequence of this nearly inexhaustible supply is that most N used in food production, and all of the new Nr produced by fossil fuel combustion, is lost to the environment where it circulates through the earth’s atmosphere, hydrosphere, geosphere, and biosphere. During this circulation, Nr contributes to a wide variety of consequences, which are magnified with time as Nr moves through the environment.”]
Krupa, S. V. (2003). Effects of atmospheric ammonia (NH3) on terrestrial vegetation: a review. Environmental pollution, 124(2), 179-221.
U.S. EPA (2011) Reactive Nitrogen in the United States: An Analysis of Inputs, Flows, Consequences, and Management Options, p. ES-6. [Of the ammonia “emitted into the U.S. atmosphere each year, about (two-thirds) are deposited onto the land and surface waters of the U.S., and about (one-third) is advected out of the U.S. via the atmosphere.”]
Sutton, M. A., et al., (2020). Alkaline air: changing perspectives on nitrogen and air pollution in an ammonia-rich world. Philosophical Transactions of the Royal Society A, 378 (2183), 20190315, p. 2. [“Over recent decades ammonia (NH3) has often seemed like the Cinderella of air pollution, as it has been given much less attention than other pollutants…”]
Guthrie, S., et al., (2018). The impact of ammonia emissions from agriculture on biodiversity. RAND Corporation and The Royal Society, Cambridge, UK, p.14. [“Firstly, it must be noted that there is very limited evidence on the effects of ammonia on animals and wider ecosystem function.”]
Einarsson, R. (2024). Nitrogen in the food system. TABLE Explainer. TABLE, University of Oxford, Swedish University of Agricultural Sciences, and Wageningen University and Research, p. 2. […the increased turnover of N in the food system has led to unprecedented quantities of N emitted into ecosystems and the atmosphere, with long-term consequences that are as yet only partially understood.”]
Van Damme, M., et al., (2014). Global distributions, time series and error characterization of atmospheric ammonia (NH3) from IASI satellite observations. Atmospheric Chemistry and Physics, 14(6), 2905–2922, p. 2906. [“This sequential process, known as the “nitrogen cascade”, has been described in theory but quantitatively large uncertainties exist on atmospheric emissions as well as chemistry, transport, and deposition of Nr. These are such that our understanding of the environmental impacts of Nr is largely incomplete. It is commonly acknowledged that the major uncertainties are related to reduced nitrogen compounds, and in particular NH3.”]
Ammonia in the atmosphere eventually returns to earth on land and water, damaging plant life, aquatic and terrestrial species, and disrupting ecosystems.
Plant life – The damage to plant life from ammonia deposition on terrestrial ecosystems, i.e., the transformation of NH3 in the atmosphere into compounds that are then incorporated into plant foliar and soil, can be severe.[1,2] This includes ongoing negative impacts on North American forests.[3-5] Some plant species thrive on higher nutrient levels, while many others are outcompeted by fast-growing species.[6] High levels of nitrogen deposition tend to encourage invasive species and negatively affect native plants.[7]
Waterways – Ammonia is also deposited into water as gas, particulates, or via precipitation, thereby contributing to the eutrophication of lakes, rivers, and coastal zones.[8] This contributes to marine dead zones and algae blooms that are toxic to fish and native aquatic plants.[9]
Wildlife – Along with aquatic species impacted by nutrient pollution and eutrophication, when N deposition changes the balance of terrestrial ecosystems, it also impacts the wild animals who rely on those habitats and food sources.[10,11]
Nitrogen cascade – These impacts are all a part of the nitrogen cascade, as ammonia and its subsequent compounds continue to cycle through air, water, and soil, causing damage over and over.[12]
Krupa, S. V. (2003). Effects of atmospheric ammonia (NH3) on terrestrial vegetation: a review. Environmental pollution, 124(2), 179-221, p. 212. [“Natural and semi-natural ecosystems, as well as forests must be expected to be severely at risk from the current amount of N deposition.”]
Behera, S. N., et al., (2013). Ammonia in the atmosphere: a review on emission sources, atmospheric chemistry and deposition on terrestrial bodies. Environmental Science and Pollution Research, 20, 8092-8131, pp. 8121-8123. [“In general, the assimilation capacity of the plant species normally determines the degree of injury. If the assimilation capacity is not sufficiently high to detoxify NHy, acute (visible) injuries may occur.”]
Bobbink, R., et al., (2010). Global assessment of nitrogen deposition effects on terrestrial plant diversity: a synthesis. Ecological applications, 20(1), 30-59, p. 36 & p. 53. [“An important implication of these thresholds is that many European and North American forests have probably already experienced significant loss of species diversity and changes in species composition. … Atmospheric N deposition in temperate and northern Europe and North America is one of the major risks to plant diversity degradation. In addition, recovery from N enrichment is a very slow process.”]
Krupa, S. V. (2003), pp. 207-208. [“N deposition must indeed be regarded as a factor severely disturbing nutrient cycling in forest ecosystems with detrimental effects for tree health.”]
Behera, S. N., et al., (2013), p. 8122. [“However, in the developed areas of Europe and North America, high N deposition has affected the health of forest ecosystems by causing several effects, including soil acidification, nutrient imbalance, decrease in productivity, forest decline and threats to the forest biodiversity.”]
Guthrie, S., et al., (2018). The impact of ammonia emissions from agriculture on biodiversity. RAND Corporation and The Royal Society, Cambridge, UK, p. 7. [“Common, fast-growing species adapted to high nutrient availability thrive in a nitrogen-rich environment and out-compete species which are more sensitive, smaller or rarer.”]
Clark, C. M., et al., (2019). Potential vulnerability of 348 herbaceous species to atmospheric deposition of nitrogen and sulfur in the United States. Nature Plants, 5(7), 697-705, p. 2. [“Although more species potentially increase than decrease with N deposition, increasers tend to be introduced, and decreasers tend to be higher-value native species.”]
USGS (2019) Nutrients and Eutrophication. https://www.usgs.gov/mission-areas/water-resources/science/nutrients-and-eutrophication
Robertson, D. M., & Saad, D. A. (2021). Nitrogen and phosphorus sources and delivery from the Mississippi/Atchafalaya River Basin: An update using 2012 SPARROW models. JAWRA Journal of the American Water Resources Association, 57(3), 406-429, p. 414. [“…about 40% of the N from atmospheric deposition originated from agricultural sources, primarily manure.”]
Wright, L. P., et al., (2018). Impacts and effects indicators of atmospheric deposition of major pollutants to various ecosystems-A review. Aerosol and Air Quality Research, 18(8), 1953-1992, Abstract. [“N enrichment directly impacts vegetative plant species cover, richness, growth rates, and susceptibility to other stressors. It indirectly impacts wildlife through changes in their habitats and food sources.”]
Guthrie, S., et al., (2018). The impact of ammonia emissions from agriculture on biodiversity. RAND Corporation and The Royal Society, Cambridge, UK.
Galloway, J. N., et al., (2003). The nitrogen cascade. Bioscience, 53(4), 341-356, Abstract. [“The same atom of Nr can cause multiple effects in the atmosphere, in terrestrial ecosystems, in freshwater and marine systems, and on human health. We call this sequence of effects the nitrogen cascade.”]