1. We estimate that there are about 65,000 factory farms as of 2022; since there is no established definition of a factory farm, we base the estimate on proposed animal number thresholds and additional factors.
2. The largest number of factory farms hold cattle on feed (~19,000), broiler chickens (~14,000), and pigs (~14,000).
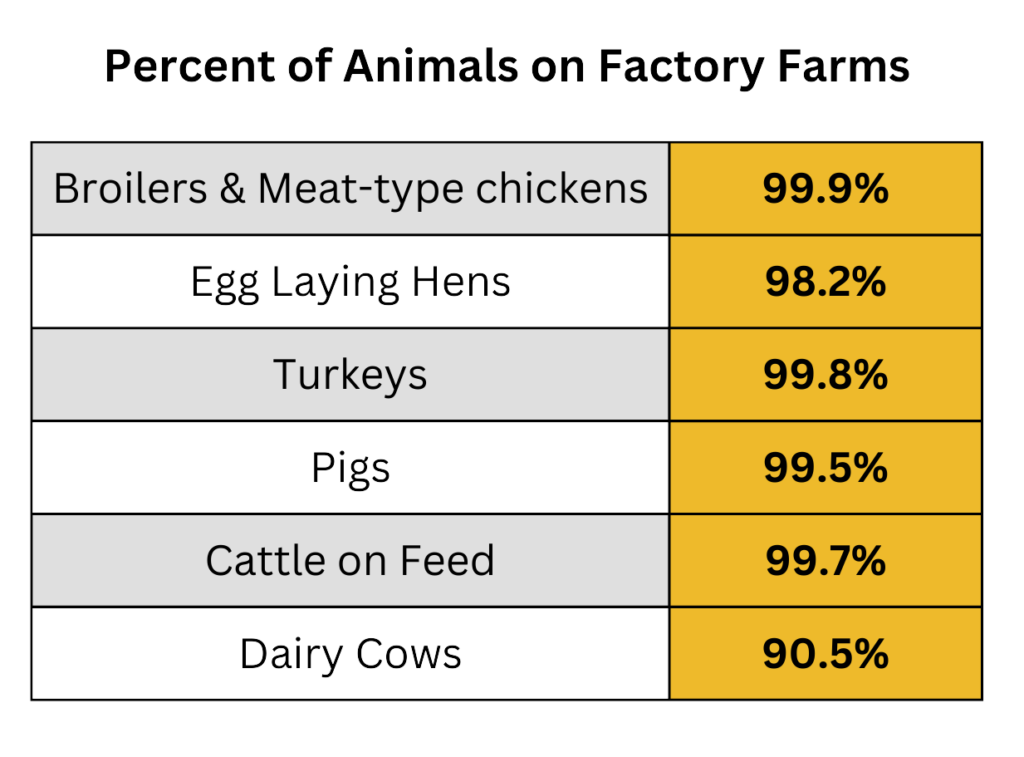
3. More than 99% of all broilers, turkeys, pigs, and cattle on feed are raised on factory farms; more than 98% of laying hens are raised on factory farms.
4. We estimate that ~90% of dairy cows are raised on factory farms based on the number that may have significant access to pasture.
No, not with authority, because there is no set definition. Individual perspectives will influence any analysis, including chosen parameters for numbers of animals, amounts of outdoor access, percentage of animal diets made up of feed crops, total amounts of manure, and prevalence of mutilations.[1] We welcome other estimates or challenges to ours.
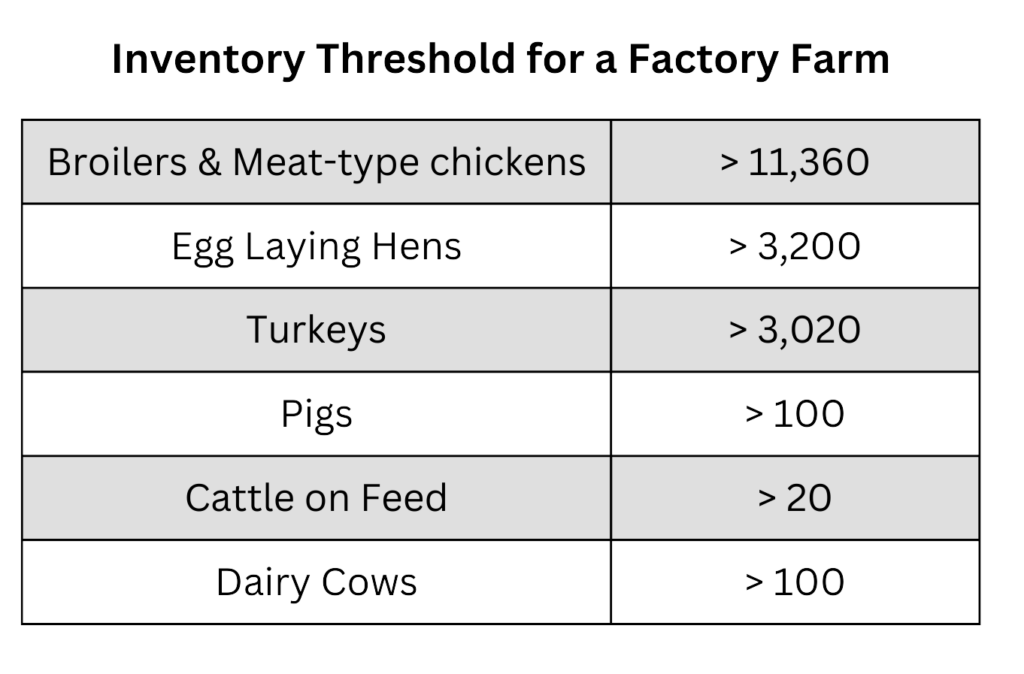
Our best estimate is that there are ~65,000 factory farms as of 2022. This is a very broad estimate based on data from the 2022 Census of Agriculture that details the number of farms producing different types of animals, and the approximate number of animals on those farms.[1-4]
See analysis: Animals on Factory Farms 2022 https://docs.google.com/spreadsheets/d/1vvN6-XC12_AL0Q0l6ooVdMW-m7LYrNdhMbs2FboKpOs/edit?gid=0#gid=0 [data from USDA (2024) 2022 Census of Agriculture. Broilers & meat-type chickens, egg-laying hens, turkeys (Table 30); Hogs & Pigs (Table 22); Cattle on feed (Table 12); Milk Cows (Table 17)]
Note: We include only 6 animal types in this assessment, and do not include the many factory farms devoted to sheep, goats, bison, and “other” farmed poultry like ducks, pheasants, quail, etc. These species add an approximate 1% to the total numbers of animals and may add a similar number of factory farms to the total. Figures are based on the Census of Ag snapshot of inventory in Dec 2022, except for broilers and turkeys, where farm size (# of animals) is provided only according to annual sales. In that case we extrapolate inventory figures by dividing the total sales by an estimate of the average number of flocks sold per year. (This assessment offers no judgment about ethical considerations regarding the farms that are not labeled factory farms and the wide range of practices on those farms.)
Jacy Reese Anthis (2024) US Factory Farming Estimates, Sentience Institute. https://www.sentienceinstitute.org/us-factory-farming-estimates [Spreadsheet on a similar subject (percentage of animals on factory farms) based on Census of Ag data and EPA definitions of CAFOs.]
FarmKind (2024) Debunking the myth of the small farm: A collaboration between FarmKind and Bryant Research. https://www.farmkind.giving/the-small-farm-myth-debunked [Analysis and spreadsheet on a similar subject (percentage of animals raised on “megafarms”) based on Census of Ag data and proposed megafarm definitions based on animal number thresholds.]

See analysis: Animals on Factory Farms 2022. https://docs.google.com/spreadsheets/d/1vvN6-XC12_AL0Q0l6ooVdMW-m7LYrNdhMbs2FboKpOs/edit?gid=0#gid=0 [data from USDA (2024) 2022 Census of Agriculture. Broilers & meat-type chickens, egg-laying hens, turkeys (Table 30); Hogs & Pigs (Table 22); Cattle on feed (Table 12); Milk Cows (Table 17)]
See analysis: Animals on Factory Farms 2022. https://docs.google.com/spreadsheets/d/1vvN6-XC12_AL0Q0l6ooVdMW-m7LYrNdhMbs2FboKpOs/edit?gid=0#gid=0 [data from USDA (2024) 2022 Census of Agriculture. Broilers & meat-type chickens, egg-laying hens, turkeys (Table 30); Hogs & Pigs (Table 22); Cattle on feed (Table 12); Milk Cows (Table 17)]
See analysis: Animal on Factory Farms 2022. https://docs.google.com/spreadsheets/d/1vvN6-XC12_AL0Q0l6ooVdMW-m7LYrNdhMbs2FboKpOs/edit?gid=0#gid=0 [data from USDA (2024) 2022 Census of Agriculture. Broilers & meat-type chickens, egg-laying hens, turkeys (Table 30); Hogs & Pigs (Table 22); Cattle on feed (Table 12); Milk Cows (Table 17)]
Note: These cattle figures only assess cattle in feedlots, therefore they are slightly different from our final assessment of total shares of animals on factory farms.
![]() The likelihood that the animals at the threshold size or larger are confined, with food from feed crops brought to the animals.[1,2]
The likelihood that the animals at the threshold size or larger are confined, with food from feed crops brought to the animals.[1,2]
![]() The likelihood that the animals are viewed strictly as economic commodities and that they are subjected to mutilations and amputations.
The likelihood that the animals are viewed strictly as economic commodities and that they are subjected to mutilations and amputations.
![]() The market share for “alternative” products from farms that allow their animals outdoor access and normal diets.
The market share for “alternative” products from farms that allow their animals outdoor access and normal diets.
![]() The assessment of an “average observer” walking through a typical operation at the animal number threshold or larger.
The assessment of an “average observer” walking through a typical operation at the animal number threshold or larger.
Kellogg, R. L., et al., (2000). Manure nutrients relative to the capacity of cropland and pastureland to assimilate nutrients. US Department of Agriculture, Natural Resources Conservation Service and Agricultural Research Service. [Tables 2 & 3, pages 5-7 would perhaps imply a much larger final figure of factory farms.]
Except feedlot cattle who are, by definition, confined.
Based on limited information, we make assumptions about the size of the markets for products from farms that allow their animals outdoor access and normal diets. We also consider the price differentials between products from standard and pasture raised operations. Additionally, for some animals, farm size distributions point to a dip in the number of farms at a particular size where both relatively large “alternative” farms and relatively small “conventional” farms both become economically unfeasible.
Broiler Chickens – about 99.9% of production on factory farms. To our knowledge, there is little information available about the market share for (genuinely) pasture-raised meat chickens.[1] The average cost of pasture-raised chicken meat is ~5 times the cost of factory farmed meat.[2] Because of this, we think the “alternative” market is very small. Given our chosen inventory threshold of ~11,000 broilers, it is likely that the number of alternative farms with more broilers and factory farms with fewer broilers is about the same.
Egg-Laying Hens – about 98% of production. Pasture-raised eggs have a much larger market share, due to (and reflected in) a much smaller price differential than chicken meat. This is partially because of a heightened consumer awareness of the dismal conditions under which factory farmed hens are kept.[3,4]
Turkeys – 99.8% of production. We have little info about pasture-raised turkey production. The cost differential is about the same as for chicken meat.[5]
Pigs – 99.4% of production. The price differential is slightly smaller than that for chickens and turkeys; it’s about 3 to 1 or 4 to 1.[6]
Cattle on Feed – 99.7% of production. Since all feedlot cattle are, by definition, confined and eating feed crop diets, the threshold is solely based on animal numbers.
Dairy Cows – about 90% of production. Despite ongoing dairy farm consolidation, there are still large numbers of dairy cows that have access to pasture. It’s likely that ~5% of dairy cows are primarily kept on pasture and a larger percentage have some access to pasture.[7]
Rothrock Jr, M. J., et al., (2019). Pastured poultry production in the united states: strategies to balance system sustainability and environmental impact. Frontiers in Sustainable Food Systems, 3, 74, p. 2. [“Currently, the actual number of pastured poultry producers in the U.S. is unknown as no databases are available through the USDA National Agricultural Statistics Service; however, 750 farms are currently registered to the American Pasture Poultry Production Association (APPPA) (American Pasture Poultry Production Association (APPPA), 2019).”]
USDA (February 23, 2024) National Monthly Pasture Raised Poultry Report. [It must be noted that the difference between the living conditions attested to on labels and the actual conditions may be significant.]
USDA (February 23, 2024) National Monthly Pasture Raised Poultry Report.
USDA (March 29, 2024) Egg Markets Overview, U.S. Table Egg Layer Flock Estimates. [Total number of hens estimated to be “pasture-raised” = 8.2 million or 2.6% of inventory.]
USDA (February 23, 2024) National Monthly Pasture Raised Poultry Report.
USDA (March 29, 2024) National Monthly Pasture Raised Pork Report.
See, Grazing Animal Numbers
Though the current correlation between organic certification and non-factory farm conditions is relatively weak, the size of the organic market may be an indicator of the levels of consumer interest in “alternative” (non-confined) living conditions.[1]

USDA NASS (2022) Certified Organic Survey 2021 Summary, Table 17. [We compare ending animal inventory as of December 2021 with inventory figures from Census of Ag 2022 (reported one year later) to arrive at a “market share” based strictly on animal inventory. Note: Beef cattle are not included since we have only considered cattle on feedlots who are, by definition, confined.]
Compared to the USDA estimate for 2012 of about 170,000 AFOs, this estimate is much smaller. Even after projecting a reduction of the 2012 number to about 145,000 in 2022, it is still less than half the number. For the purposes of this analysis, we did not include many thousands of farms that may confine relatively small numbers of animals.
Others can manipulate the thresholds to reach different conclusions. We welcome further information and calculations.