1. The numbers of AFOs and CAFOs in the U.S. are necessarily broad estimates since no federal agency tracks them with regularity or precision.
2. There are likely 140,000 to 150,000 AFOs in the U.S.
3. The number of AFOs has declined significantly due to consolidation of livestock and poultry farms, with more animals on fewer farms.
4. The EPA reports that there are 21,29 CAFOs in the U.S. There are undoubtedly many more that meet both the animal number thresholds and the “discharging of pollutants” requirement.
5. Because the potential to pollute waterways is a defining factor for CAFO designation and the EPA acknowledges that it doesn’t know how many operations are in fact polluting, the agency cannot make an accurate determination on the number of CAFOs.
According to the 2022 Census of Agriculture, there were 1,900,487 farms in the U.S. A farm is defined as “any place from which $1,000 or more of agricultural products were produced and sold, or normally would have been sold, during the census year.”[1]
USDA (2024) 2022 Census of Agriculture, Table 1, p. 3. [This is a 7% decrease from the 2017 figure of 2,042,220 farms.]
In 2022, a total of 867,844 farms produced and sold “livestock, poultry, and their products.”[1]
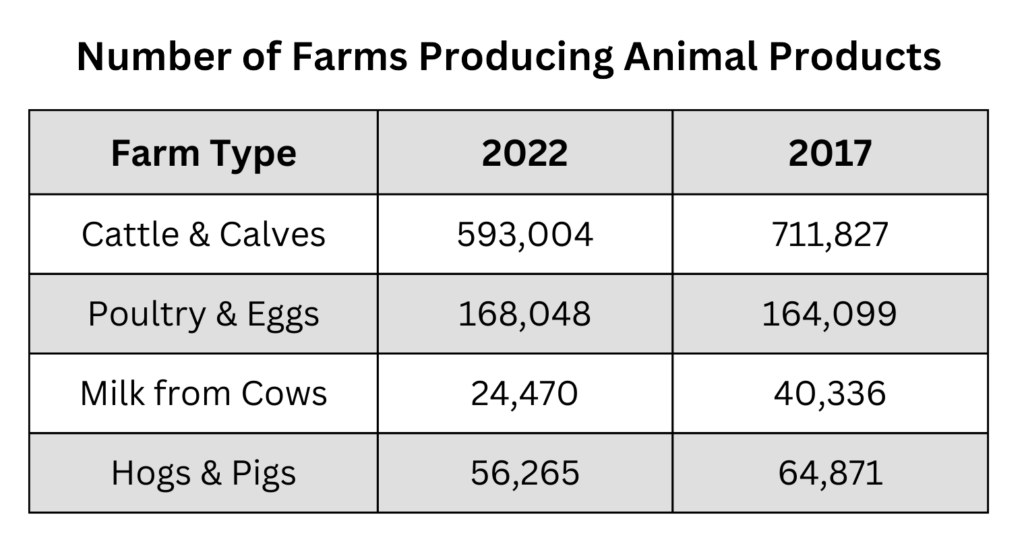
USDA (2024) 2022 Census of Agriculture, Table 2, pp. 5-6. [This is a 12% decrease from the 2017 figure of 986,790 farms]
The most recent credible estimate of total AFOs is 170,144. This is from a USDA 2016 report that analyzes data from the 2012 Census of Agriculture.[1] Because of the continuing consolidation of the industry, the corresponding figure for the 2022 Census would probably be between 140,000 and 150,000.[2]
No federal agency tracks this figure with regularity or precision. The most recent EPA count is from 2012, estimating “that about 212,000 of those farms [all farms with livestock] are likely to be AFOs…”[3] However, the agency does not explain how it arrived at that figure.
An old and inaccurate figure of 450,000 AFOs is regularly quoted in recent journal reports and is still on the CDC website. This outdated figure comes from a 1995 GAO report based on the 1992 U.S. Census of Agriculture.[4]
Gollehon, N., et al., (2016) Estimates of Recoverable and Non-Recoverable Manure Nutrients Based on the Census of Agriculture—2012 Results, USDA/NRCS, Beltsville, MD, Table 1, p. 4. https://www.nrcs.usda.gov/sites/default/files/2022-10/ManRpt_KelMofGol_2012_supplement.pdf
Gollehon, N., et al., (2016), p. i. [“The number of AFO farms decreased by 10 percent, with the greatest decline in small AFOs, continuing a long-term trend of a declining number of AFOs.”]
US EPA (2012) NPDES Permit Writers’ Manual for Concentrated Animal Feeding Operations, EPA 833-F-12-001, pp. 1-2.
U.S. General Accounting Office (1995) Animal Agriculture: Information on Waste Management and Water Quality Issues, GAO/RCED-95-200BR, pp. 60-61.
The researchers did an in-depth analysis of data from the 2012 Census of Agriculture. The report’s estimates of total AFOs listed by size designations are based on an assessment of the number of farms with confined animals per operation that totaled more than 12 animal units (AUs).[1]
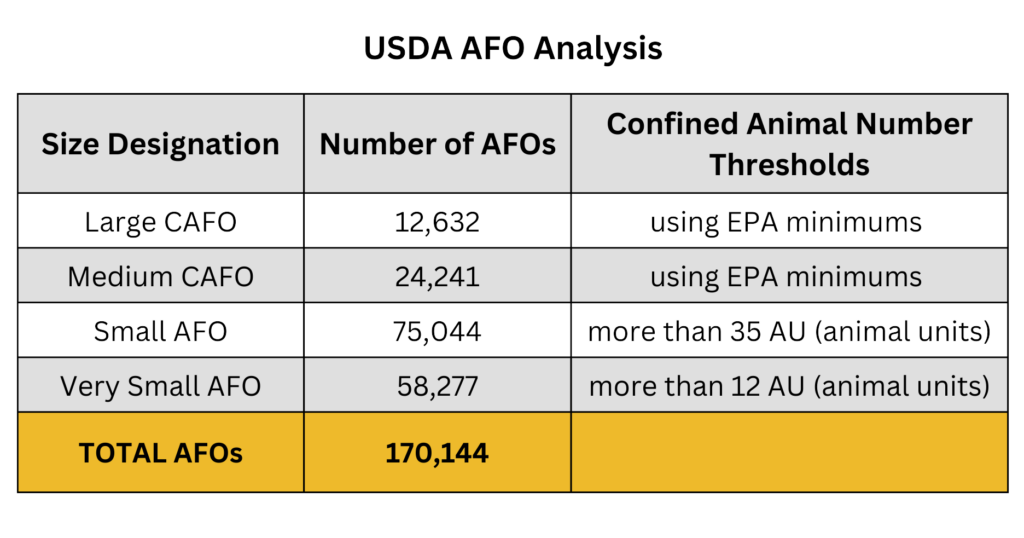
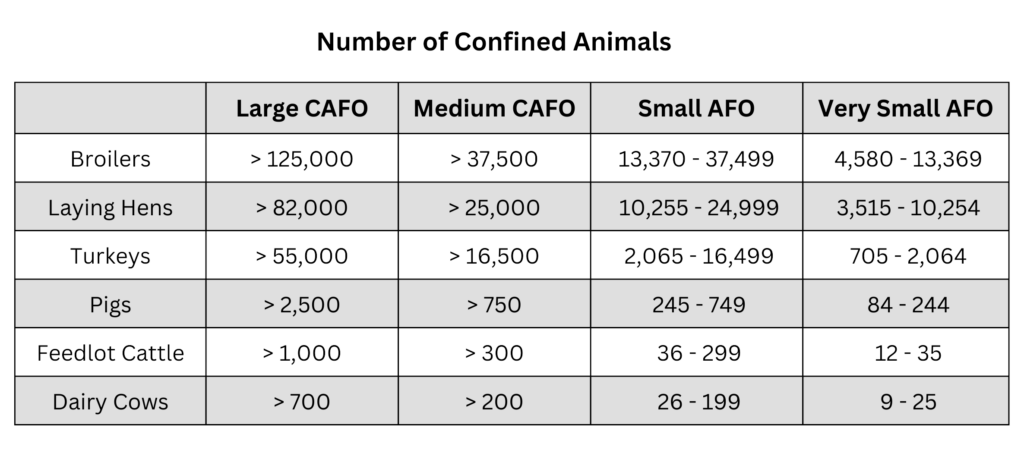
Below are the USDA’s minimum animal number thresholds used to determine the AFO designations: [2,3]
Gollehon, N., et al., (2016). Estimates of Recoverable and Non-Recoverable Manure Nutrients Based on the Census of Agriculture—2012 Results, USDA/NRCS, Beltsville, MD, Table 1, p. 4. [Along with the animal unit threshold, the report also used the criteria of “40 or more tons of manure at hauling weight produced by confined livestock types on the farm in a year.”]
Gollehon, N., et al., (2016), pp. 2-3. [For the number of confined animals the analysis uses the EPA thresholds for Large and Medium CAFOs, a lower limit of 35 Animal Units (AUs) for “Small AFOs” and a lower limit of 12 AUs for “Very Small AFOs.” An AU as used in this analysis equals approximately 1,000 pounds of average annual live animal weight. Note that only farms with “confined livestock” (including poultry) were considered to be AFOs.]
Kellogg, R., et al., (2014). Estimates of Recoverable and Non-Recoverable Manure Nutrients Based on the Census of Agriculture, USDA/NRCS, Beltsville, MD, Table 1, p. 4.
As a very broad estimate, there are currently about 140,000 to 150,000 AFOs. Based on the trends since 1982 documented in the USDA 2016 analysis, a more recent USDA analysis of ongoing consolidations, and looking at the total numbers of livestock and poultry farms from the 2022 Census of Ag, we broadly estimate a reduction in the total number of AFOs of about 15% from 2012 to 2022.[1,2]

Due to the increasing numbers of animals on fewer and larger farms, the total number of AFOs is steadily shrinking. We are not aware of any credible estimate of the number of AFOs since the USDA analysis of the 2012 Census of Agriculture.
Gollehon, N., et al., (2016). Estimates of Recoverable and Non-Recoverable Manure Nutrients Based on the Census of Agriculture—2012 Results, USDA/NRCS, Beltsville, MD, Table 1, p. 28.
This 15% estimated reduction for 2022 is a broad estimate based on the USDA Gollehon analysis of reductions from 1982 thru 2012, along with the figures from MacDonald (below) indicating that for most species (excluding cattle), steep consolidations occurred between 1997 and 2007, with the trends slowing from 2007 to 2017. [see, MacDonald, J. M. (2020). Tracking the consolidation of US agriculture. Applied Economic Perspectives and Policy, 42(3), 361-379, Table 3, p. 370. Also considering the 14% reduction from 2012 thru 2022 in total number of farms that produced and sold “livestock, poultry, and their products.” See US Census of Ag 2022 and 2017 showing a reduction from 1,004,564 farms in 2012 to 867,844 in 2022 – a reduction of 13.6%]
There is no federal agency tasked with regularly keeping track of the number of AFOs. Even with the detailed farm data provided in the Census of Agriculture, the EPA definition is not sufficient to determine which farms are AFOs.[1]
Since the categorization of a farm as an AFO involves subjectivity, any government figures should be viewed as general estimates.
Gollehon, N., et al., (2016) Estimates of Recoverable and Non-Recoverable Manure Nutrients Based on the Census of Agriculture—2012 Results, USDA/NRCS, Beltsville, MD, p. 2. [“Consequently, it is not possible to identify whether or not a farm in the census database is an AFO using the EPA definition.”]
The EPA puts out a yearly report that lists the agency’s understanding of the total number of CAFOs and those CAFOs with NPDES permits. For 2024, the total number of CAFOs is reported to be 21,279.[1] The total number of CAFOs with NPDES permits is 6,772. Any factory farm that discharges pollutants into waters of the U.S. must apply for a permit.[2]
A USDA report, based on the 2012 Census of Agriculture, estimated that 36,873 farms met the animal number thresholds for Large and Medium CAFOs.[3] This figure included 12,632 farms that met the Large CAFO animal threshold and 24,241 farms that met the Medium CAFO animal threshold. However, a farm that meets the Medium CAFO animal number threshold is not technically a CAFO as defined by the EPA, unless the farm is discharging pollutants into U.S. waterways.
US EPA (July 2025) NPDES CAFO Permitting Status Report: National Summary, End year 2024.
For information on NPDES permits See, NPDES for CAFOs
Gollehon, N., et al., (2016) Estimates of Recoverable and Non-Recoverable Manure Nutrients Based on the Census of Agriculture—2012 Results, USDA/NRCS, Beltsville, MD, Table 1, p. 2.
An accurate assessment of the number of total CAFOs (that includes the number of EPA-established Large CAFOs) requires, in most cases, a determination about whether an operation, regardless of its animal numbers, is a significant contributor of pollutants into U.S. waterways, and no agency is making these determinations on a national basis.[1,2]
Even the EPA feels hamstrung in this regard, stating, “while many waters are affected by pollutants from CAFOs, many CAFOs often claim that they do not discharge, and EPA and state permitting agencies lack the resources to regularly inspect these facilities to assess these claims, particularly since discharges often only occur during certain weather conditions. In addition, the regulations contain definitions, thresholds and limitations that make it difficult to compel permit coverage, limit the discharge of pollutants under certain circumstances, and enforce requirements even when discharges have been established.”[3]
U.S. Government Accountability Office (2008) Concentrated Animal Feeding Operations: EPA Needs More Information and a Clearly Defined Strategy to Protect Air and Water Quality From Pollutants of Concern, GAO-08-1177T, p. i. [“because no federal agency collects accurate and consistent data on the number, size, and location of CAFOs, GAO could not determine the exact trends for these operations.”]
U.S. EPA (2012) NPDES Permit Writers’ Manual for Concentrated Animal Feeding Operations, EPA 833-F-12-001, pp. 2-12. [AFOs can be “designated as a CAFO if the appropriate authority determines that the operation is a significant contributor of pollutants to waters of the U.S.”]
U.S. EPA (May 2022) EPA Legal Tools to Advance Environmental Justice, EPA Publication No. 360R22001, p. 75.