According to the EPA 2023 NPDES Permitting Status Report, the following is a ranked list of the top 10 states in which EPA-defined CAFOs are concentrated, along with the numbers of CAFOs with permits in those states.[1]
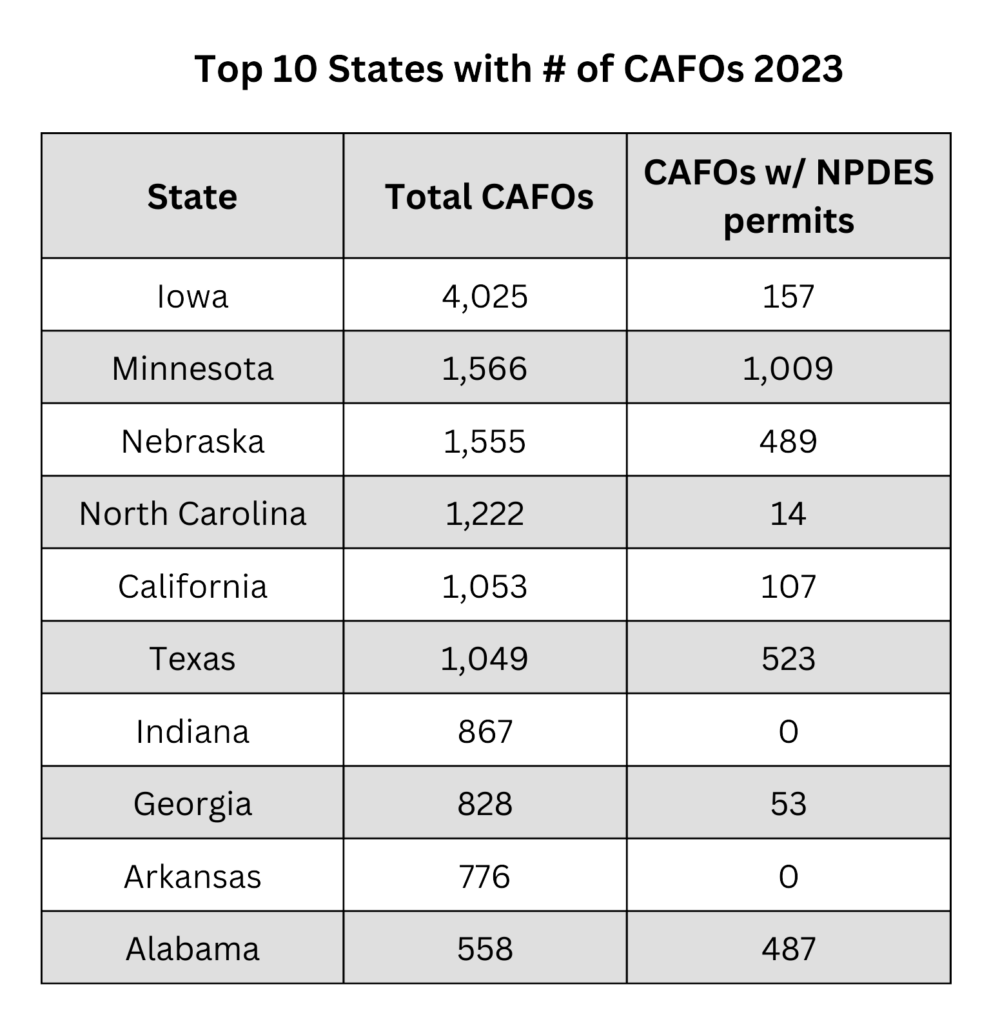
Although the total numbers are a small proportion of total factory farms, they are likely a good indication of where large factory farms are concentrated, especially when combined with the animal production lists by state (in the following question).
U.S. EPA (May 2024) NPDES CAFO Permitting Status Report: National Summary, End year 2023.
[“Reports include the total number of CAFOs, and the number of CAFOs with NPDES permits for each state.”]
Broilers: In 2023, the top three broiler production states were Georgia, Alabama, and Arkansas, accounting for ~39% of broilers produced.[1]
Laying Hens: As of December 2023, the top three states with chickens (excluding broilers) in inventory were Iowa, Ohio, and Indiana, accounting for ~32% of all chicken inventory.[2]
Turkeys: As of December 2023, the top three states raising turkeys were Minnesota, North Carolina, and Arkansas, accounting for ~43% of all turkeys raised.[3]
Pigs: As of December 1, 2023, the top three states with pig inventory were Iowa, Minnesota, and North Carolina, accounting for ~54% of all pigs in inventory.[3] Iowa alone accounted for ~32%.[4]
Cattle: The states with the most cattle are Texas, Nebraska, and Kansas. This includes beef and dairy cattle, accounting for ~28% of cattle raised.[5]
USDA NASS (2024) Poultry – Production and Value 2023 Summary, Broiler Production and Value, 7. [Georgia 1,336.7 million, Alabama 1,200 million, Arkansas 1,033.6 million = 3,570.3 million / 9,155 million U.S. total == 38.9%]
USDA NASS QuickStats: Query Chickens (excluding Broilers) avg inventory by state and nationally 2023. [Iowa 44.4 million, Ohio 39.9 million, Indiana 36.2 million = 120.5 million / US Total 382.3 million == ~31.5%]
USDA NASS (2024) Poultry – Production and Value 2023 Summary, Turkey Production and Value, p. 9. [Minnesota 38.5 million, North Carolina 29 million, Arkansas 27 million = 94.5 million / 218 million == 43.3%]
USDA NASS QuickStats: Query Hogs, inventory by state and nationally 2023 as of Dec 1. [Iowa 25 million, 9.3 million, North Carolina 7.9 million = 42.2 million / US Total 78 million = 54.1%]
USDA NASS Cattle (2024) ISSN: 1948-9099, Cattle Inventory by Class 2023, p 5. [Texas 12.5 million, Nebraska 6.5 million, Kansas 6.2 million = 25.2 million / 88.8 million U.S. total == 28.4%]
Little has changed since 2008 when the Government Accountability Office reported, “No federal agency collects accurate and consistent data on the number, size, and location of CAFOs,” and that “without a systematic and coordinated process for collecting and maintaining accurate and complete information on the number, size, and location of permitted CAFOs, EPA does not have the information that it needs to effectively regulate these operations.”[1] The EPA has been hampered by the courts in its efforts to collect this information.[2]
For instance, in response to a FOIA request in 2013, the EPA released records to a nonprofit seeking information about the locations (as well as other information) of all CAFOs.[3] The disclosed information which the EPA had collected from 28 states included the names, mailing addresses, and telephone numbers of the CAFOs’ legal owners. A federal court ruled that this disclosure violated a FOIA provision that exempts the release of such personal information as an unwarranted invasion of personal privacy.[4] Subsequently, in 2017 under former EPA administrator Scott Pruitt, the EPA signed a settlement agreement with industry groups severely limiting the scope of any future information releases.[5]
According to a group of researchers using historical satellite imagery to document the ages and locations of manure lagoons, “Beyond the USEPA NPDES permit records, no accurate databases exist with the locations of CAFOs. In the USA, the most spatially comprehensive documentation of animal production is through the U.S. Department of Agriculture’s (USDA) Census of Agriculture, which reports the number of animals housed and processed in most counties across the USA every five years. Yet, these data are only available at the county-scale, leaving gaps in our understanding of exact CAFO locations.”[6]
U.S. Government Accountability Office (2008) Report to Congressional Requesters, Concentrated Animal Feeding Operations: EPA Needs More Information and a Clearly Defined Strategy to Protect Air and Water Quality from Pollutants of Concern, GAO-08-944, pp. 4-5.
Madison McVan, Midwest Center for Investigative Reporting (February 25, 2021) Information on factory farms is spotty at best. The government has been hogtied from doing more. https://investigatemidwest.org/2021/02/25/information-on-factory-farms-is-spotty-at-best-the-government-has-been-hogtied-from-doing-more/
Miller, D. and Muren, G. (2019) CAFOs: What We Don’t Know is Hurting Us, National Resources Defense Council, p. 5.
American Farm Bureau Fed’n v. EPA, 836 F.3d 963 (8th Cir. 2016).
Miller, D. and Muren, G. (2019), p. 5.
Montefiore, L.R., et al., (2022). Reconstructing the historical expansion of industrial swine production from Landsat imagery. Scientific Reports, 12(1), 1736–1736, p. 2.
With environmental concerns in the forefront, individual scientists and researchers have begun using satellite images and other methodologies to map and evaluate the impacts of factory farming operations. This work is primarily at the regional level.[1-4]
Handan-Nader, C., & Ho, D. (2019) Deep learning to map concentrated animal feeding operations. Nature Sustainability. Vol 2, 298-306, p. 298. [satellite imagery for pig and poultry CAFOs in North Carolina]
Montefiore, L., et al., (2022). Reconstructing the historical expansion of industrial swine production from Landsat imagery. Scientific Reports, 12(1), 1736–1736. high-resolution images provided by Google Earth Pro and Landsat 5 Surface Refectance Tier 1 collection through Google Earth Engine for swine waste lagoons in North Carolina]
Miralha, L., et al., (2021). Spatiotemporal land use change and environmental degradation surrounding CAFOs in Michigan and North Carolina. The Science of the Total Environment, 800, 149391–149391. [Moderate Resolution Imaging Spectrometer (MODIS) images for liquid waste CAFOs in North Carolina and Michigan]
Robinson, C., et al., (2022). Mapping industrial poultry operations at scale with deep learning and aerial imagery. IEEE Journal of Selected Topics in Applied Earth Observations and Remote Sensing, 15, 1–14. [U.S. Department of Agriculture’s National Agricultural Imagery Program aerial imagery for poultry facilities]