1. Broadly estimated, ~90% of the key nutrients (N & P) in manure are dispersed into the environment.
2. About 10% of the total manure nitrogen (N) from factory farms is applied to crops, with an even smaller share effectively incorporated into the soil.
3. About a third to a half of all manure nitrogen (N) volatizes into ammonia during storage.
4. Large volumes of manure are still being spread on croplands, lacking the most valuable ingredients (especially nitrogen) but including large portions of contaminants like pathogens, heavy metals, antimicrobials, and hormones.
We broadly estimate that ~90% of the key nutrients (N & P) in manure are dispersed into the environment. Conversely, it is likely that ~10% of the N & P in manure is effectively incorporated into crops.[1,2]
For total amounts of nutrients in chemical fertilizers and manure, see, Total Manure Nutrient Volumes
Note: we are not aware of national assessments for the total amounts of manure nutrients effectively applied to crops, or the inverse – the total amounts of manure nutrients escaping to the environment. We make these estimates based on an analysis of data from federal agency reports (EPA and USDA) and their research scientists.
There are 5 steps:
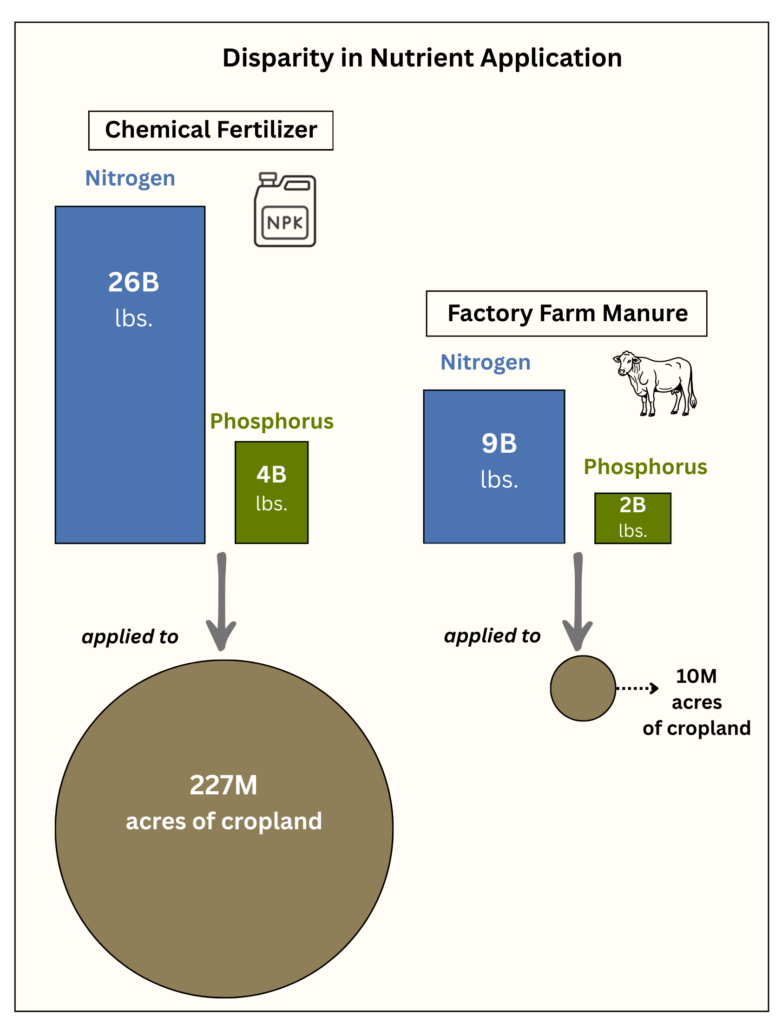
1. The nutrients in factory farm manure equal ~40% of the total nutrients in all chemical fertilizers.[1]
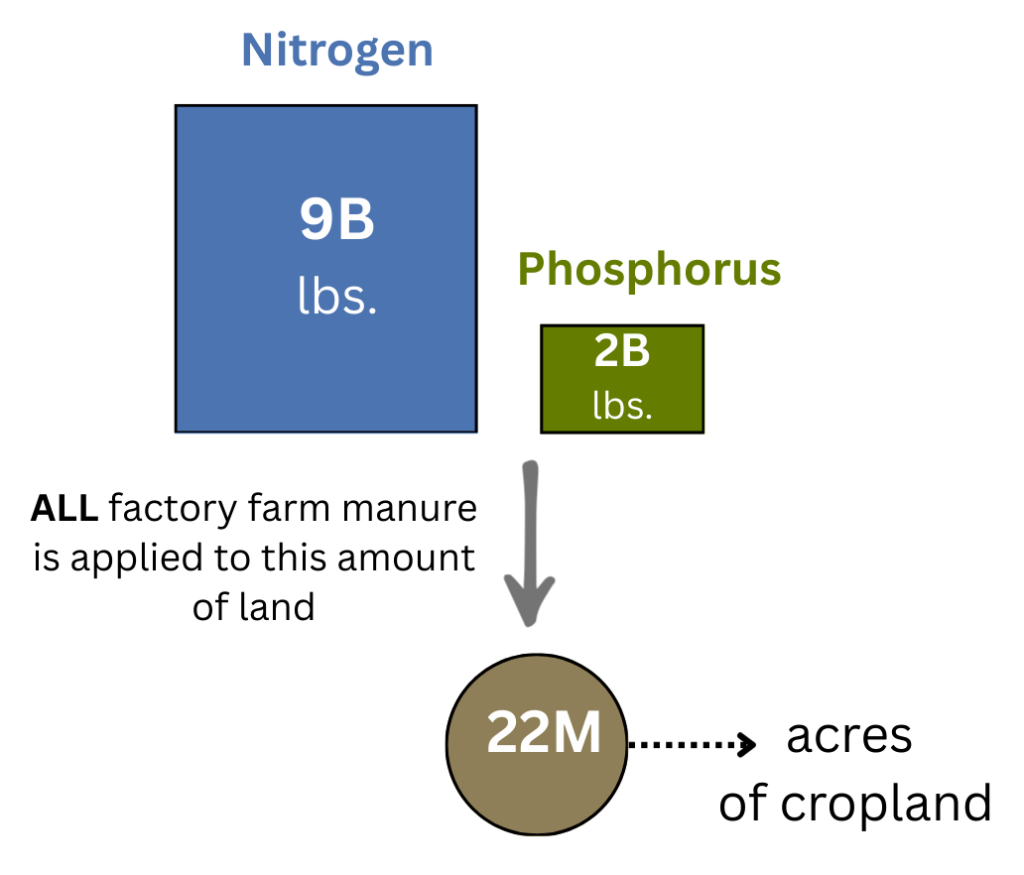
2. Manure is applied to ~22 million acres of cropland, compared to chemical fertilizers which are applied to 237 million acres of cropland.[2] Obviously, the huge amount of manure nutrients cannot be used on this comparatively small acreage.
3. Probably about half of the manure applied to those 22 million acres is applied in addition to the full application of chemical fertilizers. This is wasted application.[3-5] We therefore estimate that, in essence, manure is applied to about 12 million acres.
4. Moreover, most manure is applied to croplands via surface application methods that guarantee runoff and ineffective incorporation into the soil.[6,7] We therefore assess that ~10 million acres or fewer have manure effectively applied.[8,9]

5. If the original volume of factory farm manure nutrients is equal to ~40% of the nutrients in chemical fertilizers, while being effectively applied to only ~4% of the acreage of chemical fertilizers, then it is implied that ~90% of nutrients are lost to the environment at various stages of excretion, storage, transportation, application, and post-application dispersal.[8]
In other words, if the original nutrients present in manure would be applied at almost 10 times the rate of chemical fertilizers, it means that the nutrients are no longer present in the manure and have already been dispersed, or they are being applied to land that does not need further fertilization and are essentially being dispersed through land application. Either before or after application, ~90% of the nutrients are dispersed into the environment.[9]
See, Total Manure Nutrient Volumes
USDA (2024) 2022 Census of Agriculture, United States Summary and State Data, Vol 1, Part 51, Table 46, p. 52. [22,169,010 acres versus 236,771,914 acres]
Lim, T., et al., (2023). Increasing the Value of Animal Manure for Farmers, USDA ERS, p. 12. [“USDA ARMS data indicate that only 44 percent of farmers who applied manure to corn also reduced commercial fertilizer applications to corn because of manure applications.” About 80% of manure is applied to corn. (at p. 13)]
Hellerstein, D., et al., (2019). Agricultural resources and environmental indicators, 2019. USDA ERS, Bulletin 208, p. 77 and Table 2-14-2 on p. 78. [“About 43 percent of all dairy operations adjusted their fertilizer nutrients, compared to 31 percent of hog operations and 14 percent of broiler operations.” In other words, about two-thirds of operations applied the full application of chemical fertilizers, despite adding manure nutrients.]
Leytem, A. et al., (2021). Cycling Phosphorus and Nitrogen through Cropping Systems in an Intensive Dairy Production Region. Agronomy (Basel), 11(5), 1005, p. 10. [“This suggests that not only are manure nutrients undervalued but they are not likely included in calculating nutrient budgets, which can lead to overapplication of N and P, particularly on fields receiving manure.”]
Lim, T., et al., (2023), p. 22 and Figure 9. [“For all types of manure, surface application with or without incorporation is the most frequently used method of application… Less than 30 percent of surface-applied manure is incorporated into the soil.” More than 80% of corn applications are surface applied. About 80% of manure is applied to corn. (at p. 13)]
Rotz, C. A. (2004). Management to reduce nitrogen losses in animal production. Journal of animal science, 82 (suppl_13), E119-E137, Abstract. [“Irrigation and surface spreading of manure without soil incorporation often ensures the loss of all remaining nonorganic nitrogen (typically, 20 to 40% of remaining nitrogen).”]
Calculation: 10M acres / 227M = 4.4% of land. Therefore, 40% of nutrients applied to 4.4% of land = ~9 times the application rate of chemical fertilizers. That would mean about 89% (8/9) of nutrients were not present or wasted. Naturally, these are broad estimates.
Note: this figure should probably be estimated at ~5 million acres rather than ~10 million, based on the low incorporation rates documented above. However, we aim to be more conservative in assessment and also acknowledge that some small portion of manure nutrients are applied and incorporated into grasslands and pasture. It is a minor point because a) these are not crops, and b) the nutrients in forage for cattle are mostly excreted in manure again, with a very low incorporation into crops or the human food chain. See: Rotz, C. A. (2004), p. E121. [Reports incorporated nitrogen of pasture-raised beef at less than 10%, feedlot beef ~10%, pastured dairy cattle at ~20% (Table 4). Therefore, the overall nitrogen loss from grazing cattle is very high.]
Focusing specifically on nitrogen, about 10% of the total manure nitrogen (N) from factory farms is applied to crops, with an even smaller share effectively incorporated into the soil. The great majority of nitrogen in factory farm manure escapes into the environment. This broad estimate is based entirely on federal agency reports and data from USDA scientists, as follows:
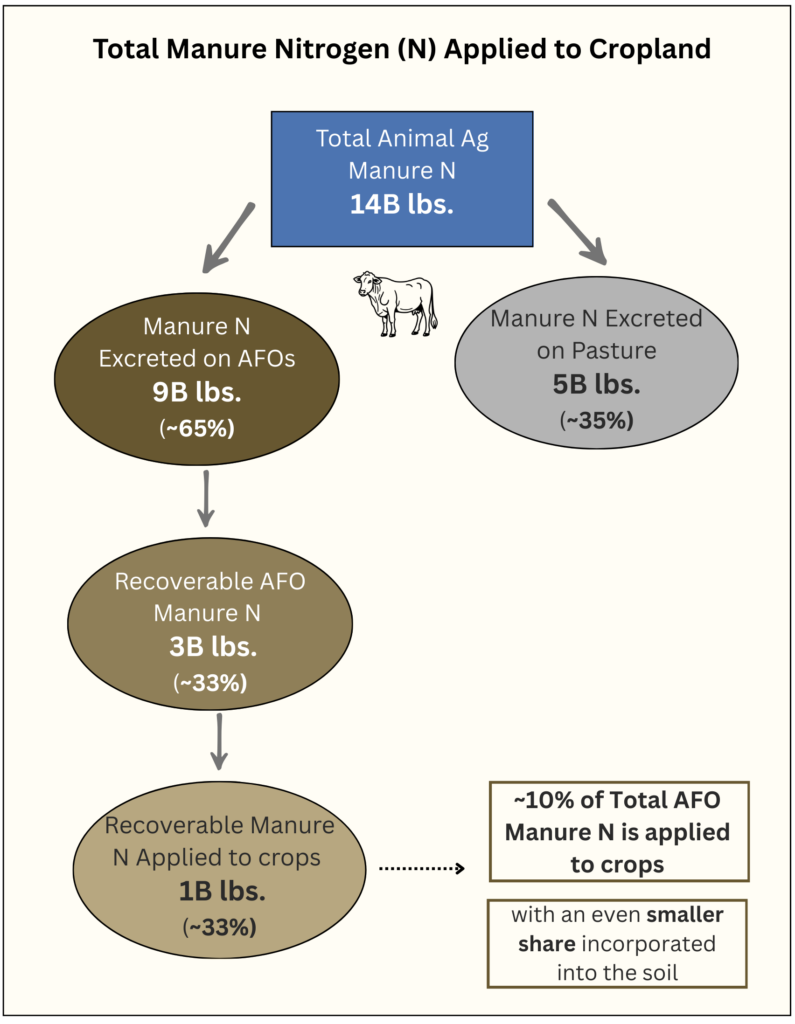
![]() The EPA estimates that ~14 billion lbs. of manure nitrogen (N) were generated in 2017 from all animal agriculture.[1]
The EPA estimates that ~14 billion lbs. of manure nitrogen (N) were generated in 2017 from all animal agriculture.[1]
![]() About 65% (or 9 billion lbs.) was from factory farms, with the rest generated by animals that were not confined (mostly grazing cattle).[2]
About 65% (or 9 billion lbs.) was from factory farms, with the rest generated by animals that were not confined (mostly grazing cattle).[2]
![]() Of the 9 billion lbs. of manure nitrogen from factory farms, about one-third is considered “recoverable.” The rest is lost during “collection, transfer, storage, and treatment.”[3]
Of the 9 billion lbs. of manure nitrogen from factory farms, about one-third is considered “recoverable.” The rest is lost during “collection, transfer, storage, and treatment.”[3]
![]() Of the ~3 billion lbs. recoverable, the USDA estimates that about 1 billion lbs. of manure nitrogen (N) is land-applied to crops.[4]
Of the ~3 billion lbs. recoverable, the USDA estimates that about 1 billion lbs. of manure nitrogen (N) is land-applied to crops.[4]
![]() Of the 1 billion lbs. of land-applied manure nitrogen, perhaps about half, is incorporated into crops.[5-7]
Of the 1 billion lbs. of land-applied manure nitrogen, perhaps about half, is incorporated into crops.[5-7]
Broadly estimated, ~10% of manure nitrogen from factory farms is applied to crops.[8,9] The land application of manure on crops, despite being intensively researched, subsidized, and highly touted, brings very little nitrogen (N) to crops in practice. Almost all the nitrogen from manure from factory farming is entering and damaging ecosystems throughout the country.[10]
U.S. EPA (2023). Estimated Animal Agriculture Nitrogen and Phosphorus from Manure.
https://www.epa.gov/nutrientpollution/estimated-animal-agriculture-nitrogen-and-phosphorus-manure [2017 totals: 14,201,994,389 pounds of N]Gollehon, N. R., et al., (2016). Estimates of recoverable and non-recoverable manure nutrients based on the census of agriculture – 2012 results. USDA Natural Resources Conservation Services, Washington, DC, p. 11. [63.5% of manure nitrogen from AFOs (see, Table 3). Calculation: 14.2 billion pounds x .635 = 9.0. In this analysis we equate “factory farming” with Gollehon’s “AFOs” since less than 2% of total manure nitrogen was from “very small AFOs” that might not meet the “factory farm” definition. See Table A-2. All AFOs in this report are defined by “confined animals.” The concentration of animals has obviously intensified since this report.]
Gollehon, N. R., et al., (2016), p. 11. [“The amount of recoverable manure nitrogen was 34 percent…”]
Lim, T., et al., (2023). Increasing the Value of Animal Manure for Farmers, USDA ERS, p. 13. [“Corn acres received more than 410,000 tons of manure nitrogen, 81 percent of total applied nitrogen.” 820,000,000 lbs. / .81 = 1.01 billion lbs.]
Lim, T., et al., (2023), p. 12. [“USDA ARMS data indicate that only 44 percent of farmers who applied manure to corn also reduced commercial fertilizer applications to corn because of manure applications.” About 80% of manure is applied to corn. (at p. 13)]
Hellerstein, D., et al., (2019). Agricultural resources and environmental indicators, 2019. USDA ERS, Bulletin 208, p. 77 and Table 2-14-2 on p. 78. [“About 43 percent of all dairy operations adjusted their fertilizer nutrients, compared to 31 percent of hog operations and 14 percent of broiler operations.” In other words, about two-thirds of operations applied the full application of chemical fertilizers, despite adding manure nutrients.]
USDA NRCS (2017). Effects of Conservation Practices on Nitrogen Loss from Farm Fields: A National Assessment Based on the 2003-06 CEAP Survey and APEX Modeling Databases. [“Total nitrogen losses were highest for acres receiving manure. The average annual estimate of total nitrogen loss for acres receiving manure was 56 pounds per acre per year, compared to the average annual amount lost for acres not receiving manure of 32 pounds per acre per year.” (at p. 13) A loss of 56 pounds / average of 117 pounds applied = 48% loss. High loss rates are common because the manure is often applied in addition to the full application of chemical fertilizers.]
Calculation: 1 billion pounds / 9 billion pounds = ~11%.
Note that there is some share of manure applied to hay and grassland that is not included in this tally. See, Lim, T., et al., (2023), p. 12. [“Hay acreage and grassland also receive manure. USDA data from 2006 shows that 26 percent of manured acres were hay and grass acres.”] Including this amount would change the 1 billion pound estimate to ~1.4 billion lbs. However, grass is not a crop and both grass and forage for cattle have very low rates of eventual nutrient incorporation into crops or food. The nutrients in forage for cattle are mostly excreted in manure again, with a very low incorporation into crops or the human food chain. See, Rotz, C. A. (2004). Management to reduce nitrogen losses in animal production. Journal of animal science, 82 (suppl_13), E119-E137. [Report notes incorporated nitrogen of pasture-raised beef at less than 10%, feedlot beef ~10%, pastured dairy cattle at ~20% (Table 4). Therefore, the overall nitrogen loss from grazing cattle is very high. (at p. E121)]
See, Economics of Manure for the many reasons that manure is not valued, regularly dispersed, applied on top of full shares of chemical fertilizers, and over-applied on land owned or managed by factory farm operations as a way to get rid of a waste product.
A 2021 USGS study of watersheds covering all or parts of 31 agricultural states throughout the Midwest is likely the closest to a national assessment of the sources of nutrient losses. It shows that manure is a major contributor to both N & P dispersal into the environment.[1]
![]() Nitrogen – Manure was identified as the number one source of nitrogen (29% of the total). This was more than chemical fertilizers.
Nitrogen – Manure was identified as the number one source of nitrogen (29% of the total). This was more than chemical fertilizers. ![]() Phosphorus – Manure contributed just less than a quarter (24%) of total anthropogenic sources of phosphorus – about half as much as chemical fertilizers.
Phosphorus – Manure contributed just less than a quarter (24%) of total anthropogenic sources of phosphorus – about half as much as chemical fertilizers.
This figure for nitrogen includes large amounts of nitrogen escaping from manure through volatilization into ammonia, causing major air quality damages and eventually through deposition creating additional damage to terrestrial and aquatic ecosystems.[2]
Robertson, D. M. & Saad, D. A. (2021). Nitrogen and phosphorus sources and delivery from the Mississippi/Atchafalaya River basin: An update using 2012 SPARROW models. JAWRA Journal of the American Water Resources Association, 57(3), 406-429. Table 2, p. 415; Table 4, p. 420; Figure 5, p. 418. [N = 28.9%. P = 18.2% / 77.3% anthropogenic = 23.5%]
See details regarding manure, ammonia emissions, and impacts on air quality at:
Nitrogen and Air Quality and Animal Ag Ammonia & PM2.5
There are many regional studies that document the damaging flows of nutrients from factory farms to air and water.[1-6]
Mallin, M. A., et al., (2015). Industrial swine and poultry production causes chronic nutrient and fecal microbial stream pollution. Water, Air, & Soil Pollution, 226(12), 407, p. 9. [“Thus, the principal sources of nitrate are swine CAFO waste (either runoff from sprayfields, or subsurface movement into the stream), poultry litter spread on fields, and cattle manure deposited on land.”]
Jones, C. S. (2019). Livestock manure driving stream nitrate. Ambio, 48(10), 1143-1153, Abstract. [“Our analysis shows much higher stream nitrate in the two watersheds where livestock concentration has been greatest, and little difference in commercial fertilizer inputs with the widespread availability of manure N.”]
Porter, S. A. & James, D. E. (2020). Using a spatially explicit approach to assess the contribution of livestock manure to Minnesota’s agricultural nitrogen budget. Agronomy, 10(4), 480, p. 12. [“At a minimum, this suggests that significant over-application of N fertilizer is occurring throughout the state”]
Long, C. M., et al., (2018). Use of manure nutrients from concentrated animal feeding operations. Journal of Great Lakes Research, 44(2), 245-252, Abstract. [“CAFOs applied excess manure nutrients to cropland by applying to fields with soil phosphorus test levels N50 ppm(42% of all cases), applying to soybeans (7% of all cases), over-estimating crop yields in calculating plant nutrient requirements (67% of all cases), and applying beyond what is allowed by state permits (26% of all cases).”]
Waller, D. M., et al., (2021). Shifts in precipitation and agricultural intensity increase phosphorus concentrations and loads in an agricultural watershed. Journal of Environmental Management, 284, 112019, Abstract. [“Compared to upstream total phosphorus loads, those downstream from the CAFOs increased by 91% after the expansions – over four times that of concentration increases – implying that the rate of downstream phosphorus transfer has increased due to CAFO expansion.”]
Brown, C., et al., (2020). Tracing nutrient pollution from industrialized animal production in a large coastal watershed. Environmental Monitoring and Assessment, 192(8), 515–515, p. 15. [“…nitrogen inputs in the Northeast Cape Fear River, Black River, and the Cape Fear River are largely derived from CAFO swine effluent, with additional contributions from human discharges.”]
In total, manure nitrogen losses to ammonia are probably in the range of a third to a half of all manure nitrogen.[1] These occur during storage and manure management and during and after land application. (Emissions vary greatly depending on the type of animal and the manure storage systems.)
Storage and manure management – Factory farm manure nitrogen starts to volatize into ammonia (NH3) soon after excretion. Perhaps a quarter to a third escapes into the environment within hours or days, and losses continue through all stages of manure management.[2-4]
Land application – Losses increase dramatically during and after land application.[5-8]
U.S. EPA (2002). Non-Water Quality Impact Estimates for Animal Feeding Operations, pp. 1-2. [“Nitrogen losses from animal manure as ammonia can easily exceed 50 percent.”]
Leytem, A. B., et al., (2021). Cycling phosphorus and nitrogen through cropping systems in an intensive dairy production region. Agronomy, 11(5), 1005, p. 6. [“Based on these studies, we used a value of 37% of total N excreted being volatilized on-farm from housing, manure handling, and storage.”]
Rotz, C. A. (2004). Management to reduce nitrogen losses in animal production. Journal of animal science, 82 (suppl_13), E119-E137, Table 2. [“Volatile loss begins soon after excretion, and it continues through all manure handling processes until the manure nutrients are incorporated into soil.” (at p. E-120.) “Up to half of the excreted nitrogen is lost from the housing facility…” (at p. E-119). See, Table 2 for losses by animal type and manure handling method. Most nitrogen loss at the facility is in the form of ammonia. (see, footnote b)]
Pagliari, P., et al., (2020). Animal manure production and utilization: Impact of modern concentrated animal feeding operations. In Animal manure: Production, characteristics, environmental concerns, and management, 67, 1-14, p. 3. [“For example, approximately 25%, 10%, 26%, and 53% of nitrogen can be lost as ammonia before manure is land applied in dairy, beef, poultry, and swine operations, respectively.”]
Bouwman, A. F., et al., (2002). Estimation of global NH3 volatilization loss from synthetic fertilizers and animal manure applied to arable lands and grasslands. Global biogeochemical cycles, 16(2), 8-1, Abstract. [For land application losses, “The estimated NH3 loss from animal manure is 21% in industrialized and 26% in developing countries.”]
Lim, T., et al., (2023). Increasing the Value of Animal Manure for Farmers, USDA ERS, p. 22 and Figure 9. [“For all types of manure, surface application with or without incorporation is the most frequently used method of application… Less than 30 percent of surface-applied manure is incorporated into the soil.”]
Meisinger, J. J. & Jokela, W. E. (2000). Ammonia volatilization from dairy and poultry manure. Managing nutrients and pathogens from animal agriculture. NRAES-130. Natural Resource, Agriculture, and Engineering Service, Ithaca, NY, 334-354. [Ammonia loss estimates for non-incorporated land-applied dairy and poultry manure in the Northeast between 40-100%. (at p.13 Table 1)] [Note: most manure is broadcast sprayed and not incorporated into the soil. See: Leng, T., et al., (2023). Increasing the Value of Animal Manure for Farmers, USDA ERS, pp. 19- 23 and Figures 9-10.]
Chastain, J. P. (2019). Ammonia volatilization losses during irrigation of liquid animal manure. Sustainability, 11(21), 6168, p. 1. [“Broadcast application of liquid or slurry manure without incorporation can result in ammonia losses ranging from 11% to 70% of applied total ammoniacal nitrogen.”]
No. Large volumes of manure are being spread but containing only small portions of the most valuable ingredients – the nutrients. Factory farms still need to get rid of the manure since they have limited storage space and, in most cases, it is not legal to simply dump it into waterways.
The nutrients may be greatly reduced, but contaminants are still present, along with many other problems including odors, dangerous gases, and GHG emissions.[1-4]
U.S. EPA (2013). Literature Review of Contaminants in Livestock and Poultry Manure and Implications for Water Quality, EPA 820-R-13-002, p. 1. [“Manure often contains pathogens (many of which can be infectious to humans), heavy metals, antimicrobials, and hormones that can enter surface water and ground water through runoff and infiltration potentially impacting aquatic life, recreational waters, and drinking water systems.”]
Ni, J. Q., et al., (2012). Volatile organic compounds at swine facilities: A critical review. Chemosphere, 89(7), 769-788, Abstract. [“More than 500 VOCs (volatile organic compounds) have been identified.”]
Aneja, V. P., et al., (2009). Effects of Agriculture upon the Air Quality and Climate: Research, Policy, and Regulations. Environmental Science & Technology, 43(12), 4234–4240, p. 4236. [Reviews the many air quality issues emanating from concentrated manure including GHG gases.]
Schiffman, S. S., et al., (2001). Quantification of odors and odorants from swine operations in North Carolina. Agricultural and Forest Meteorology, 108(3), 213-240.