
Air pollution, and specifically PM2.5 air pollution, is the number one environmental cause of human deaths in the U.S.[1]
Globally, PM2.5 air pollution is the environmental factor responsible for most human deaths.[2] In fact, of all causes of premature death, it is considered the largest or 2nd largest.[3-5]
Tessum, C. W., et al., (2019). Inequity in consumption of goods and services adds to racial–ethnic disparities in air pollution exposure. PNAS, 116(13), 6001–6006, p. 6001. [“Fine particulate matter (PM2.5) exposure is a major health risk factor in the United States, responsible for 63% of deaths from environmental causes and 3% of deaths from all causes.”]
United Nations Environment Programme (2021). Actions on Air Quality: A Global Summary of Policies and Programmes to Reduce Air Pollution. Nairobi, p. 13. [Air pollution is “The single greatest environmental risk factor for premature death globally.”]
Brauer, M., et al., (2024). Global burden and strength of evidence for 88 risk factors in 204 countries and 811 subnational locations, 1990–2021: a systematic analysis for the Global Burden of Disease Study 2021. The Lancet, 403(10440), 2162-2203. [“Among the specific risk factors analysed for this study, particulate matter air pollution was the leading contributor to the global disease burden in 2021.” at p. 2162 & Figure 2]
Health Effects Institute (2024) State of Global Air 2024. Special Report. Boston, MA. [Air pollution trailing only high blood pressure, with 8.1 million total deaths in 2021. Of total air pollution deaths, 7.8 million due to PM2.5. at p. 3 & 13, Figure 9]
This section treats air pollution separately from climate change. Naturally, GHG emissions are a form of air pollution, and some gases drive both pollution and climate change. Our focus on these pages is on regional and national air quality apart from climate change.
There is a lack of societal awareness of the air quality issues of food systems in general.[1] Animal ag emissions are particularly obscured:
 The number and complexity of factory farm gases and compounds defy analysis.[2,3]
Animal ag emissions, especially ammonia, are in a constant state of chemical transition.[4]
Current research is limited, especially in comparison to other major sources of air pollution.[5,6]
Pollution in air is fast moving and highly reactive, making attribution challenging.[7,8]
Air emissions from animal ag are almost completely unregulated.[9] This allows emissions to continue unabated without reporting and with limited monitoring.[10]
Factory farm ammonia emissions can be at levels 10 to 50 times or more the EPA’s “reportable quantities.”[11,12] Both the USDA and the industry have pushed back hard on regulation proposals, recognizing that any constraints would be a threat to the viability of the factory farming system.[13]
The impacts from fertilizers on feed crops (the nation’s largest crops) are not generally recognized as attributable to animal ag.
Balasubramanian, S., et al., (2021). The food we eat, the air we breathe: a review of the fine particulate matter-induced air quality health impacts of the global food system. Environmental Research Letters, 16(10), 103004, p. 20. [“The global food system is essential for the health and wellbeing of society, but is also a major cause of environmental damage. Some impacts, such as on climate change, have been the subject of intense recent inquiry, but others, such as on air quality, are not as well understood.”]
Schiffman, S. S., et al., (2001). Quantification of odors and odorants from swine operations in North Carolina. Agricultural and Forest Meteorology, 108(3), 213-240, p. 220. [“A total of 331 different VOCs and fixed gases were found at swine facilities in North Carolina.” Of all documented compounds, more than 150 were determined to be “irritants.”]
U.S. EPA Office of Inspector General (2017) Eleven Years After Agreement, EPA Has Not Developed Reliable Emission Estimation Methods to Determine Whether Animal Feeding Operations Comply With Clean Air Act and Other Statutes, p. 3. [“AFOs can have many and varied sources of air emissions… Each of these emission sources can emit a variety of air pollutants, and emission rates can fluctuate depending on climate and geographical conditions… Further, characterizing AFO air emissions requires expertise in multiple scientific disciplines, including animal nutrition, AFO practices and atmospheric chemistry.”]
U.S. EPA (2011) Reactive Nitrogen in the United States: An Analysis of Inputs, Flows, Consequences, and Management Options, A Report of the EPA Science Advisory Board, p. 4. [“Unlike other element-based pollution problems, the N cascade links the negative impacts, where one N-containing molecule can in sequence contribute to all the environmental issues mentioned above.”]
Congressional Research Service (2016) Air Quality Issues and Animal Agriculture: A Primer, RL32948, p. 1. [“Resolving those questions is hindered by a lack of adequate, accurate, scientifically credible data on air emissions from AFOs, data that are needed to gauge possible adverse impacts and subsequent implementation of control measures.”]
Lavaine, E., et al., (2020). Health, air pollution, and animal agriculture. Review of Agricultural, Food and Environmental Studies, 101, 517-528. [Few economic analyses exist regarding air pollution from agriculture compared to energy or transport (see, Figure 3)]
Krupa, S. V. (2003). Effects of atmospheric ammonia (NH3) on terrestrial vegetation: a review. Environmental pollution, 124(2), 179-221, p. 181. [Ammonia life span of several hours to perhaps 1 to 4 days and a reach of ~.5 to 3 miles]
Aneja, V. P., et al., (2008). Ammonia assessment from agriculture: US status and needs. Journal of Environmental Quality, 37(2), 515-520. [“ammonium aerosols might travel as far as 2500 km…”]
The National Agricultural Law Center (2025). Federal Court Upholds Reporting Exemption for Livestock Emissions.
https://nationalaglawcenter.org/federal-court-upholds-reporting-exemption-for-livestock-emissions/
[“Following the court’s ruling (on August 7, 2025), operators of CAFOs and other livestock facilities will continue to be exempt from both CERCLA and EPCRA notification requirements for air emissions from animal waste.”] For further info, see Lack of Air RegulationsBurns, A. M., et al., (2023). Data Gap: Air Quality Networks Miss Air Pollution from Concentrated Animal Feeding Operations. Environmental Science & Technology, 57(49), 20718–20725, p. 20722. [“For example, in national and regional assessments, the EPA documents improving surface air quality. However, those assessments have an implicit bias that largely excludes agricultural locations, even for predominantly rural areas.”]
U.S. EPA (2023) Emergency Release Notification Requirements for Animal Waste Air Emissions under the Emergency Planning and Community Right-to-Know Act (EPCRA) – Technical Background Document, Table 2-6, pp. 12-13. [“If the Reportable Quantity were raised to 500 lbs, the preliminary estimated regulated universe would decrease from 37,891 to approximately 14,825 farms.” At 1,000 pounds (10 times the reportable quantity) more than 5,000 factory farms could be regulated, and at 5,000 pounds more than 850 could be regulated.]
See, Ammonia Emissions by Animal Type and Farm Size https://docs.google.com/spreadsheets/d/1kJ0hu4JYcDz3liG2iHc56zhAiMg5mxvopynve3YdxDg/edit?gid=0#gid=0google
See, Lack of Air Regulations [question: How has the USDA fought against ammonia regulations?]
Most of the negative air quality impacts from the factory farming system stem from ammonia emissions and the role ammonia plays in PM2.5 creation.[1] A focus on these 2 factors can cull down a complicated subject to its most crucial parts.
An acknowledgment of the severe negative effects of ammonia emissions would benefit society while presenting a significant challenge to the intense concentration of animals. Extraordinarily high levels of ammonia generation are built into the system due to the massive amounts of concentrated manure.
See subsequent question: Is ammonia the central air pollutant from animal ag?
There are hundreds of air pollutants from animal ag.[1,2] One study identified a total of 331 different gases and volatile organic compounds (VOCs) at pig factory farms in North Carolina.[3] That’s too many gases to name and far too many to include in these pages.
We focus primarily on the effects of ammonia (NH3) because it is by far the most damaging.
Aneja, V. P., et al., (2009). Effects of Agriculture upon the Air Quality and Climate: Research, Policy, and Regulations. Environmental Science & Technology, 43(12), 4234–4240, p. 4236. [“Animal production results in emissions of hundreds of identified VOCs (volatile organic compounds).”]
Ni, J. Q., et al., (2012). Volatile organic compounds at swine facilities: A critical review. Chemosphere, 89(7), 769-788, Abstract. [“More than 500 VOCs have been identified.”]
Schiffman, S. S., et al., (2001). Quantification of odors and odorants from swine operations in North Carolina. Agricultural and Forest Meteorology, 108(3), 213-240.
In volume, importance, and damage, ammonia (NH3) created from excess nitrogen is the central air pollutant of animal ag.[1-4] Of all ammonia emissions in the U.S., about 70% originate from animal ag.[5]
On factory farms, high levels of ammonia can be damaging to farmed animals, workers and local communities.[6-8] Ammonia is also a primary precursor gas contributing to the creation of PM2.5, the largest cause of human health-related damage from air pollution.[9,10] Escaped nitrogen in any form, including ammonia, continues to react with other compounds on a long journey of environmental and health damages, moving from one ecosystem to another. This is known as the nitrogen cascade.[11]
U.S. EPA (2024) 2020 NEI Supporting Data and Summaries – Data Queries for Sector Summaries.
[Total nitrous oxide from all agriculture at ~1.1 million tons versus ~5.5 million tons ammonia (mostly from animal ag)]Rotz, C. A., et al., (2014). Ammonia emission model for whole farm evaluation of dairy production systems. Journal of environmental quality, 43(4), 1143-1158, p. 1143. [“Emissions (from animal agriculture) include greenhouse gases, volatile organic compounds, and specific toxic compounds, of which ammonia (NH3) is the most important.”]
Giannadaki, D., et al., (2018). Estimating health and economic benefits of reductions in air pollution from agriculture. The Science of the Total Environment, 622–623, 1304–1316, p. 1305. [“The main pollutant from agricultural activity is ammonia (NH3)…”]
Hill, J., et al., (2019). Air-quality-related health damages of maize. Nature Sustainability, 2(5), 397-403. [Report estimates the PM2.5 pollution costs of corn production (the primary animal feed) at ~8 times the GHG damages of corn production.]
U.S. EPA (2024) 2020 NEI Supporting Data and Summaries – Data Queries for Sector Summaries.
[Query: National/Ammonia NH3/Livestock Waste (49.2%), fertilizer application (33.5%), agricultural field burning (2.7%) of total (5,482,484 tons). Of the 36.2% due to crop production, we estimate at least half is from feed crops. For calculations of anthropogenic emissions, excluding wildfires, see Animal Agriculture Share of Anthropogenic Ammonia Emissions. https://docs.google.com/spreadsheets/d/1naMuMuWYGUU9cvN8FoXni9TkfM65s85DGajbWqSP7xw/edit?gid=0#gid=0Naseem, S., & King, A. J. (2018). Ammonia production in poultry houses can affect health of humans, birds, and the environment—techniques for its reduction during poultry production. Environmental Science and Pollution Research International, 25(16), 15269–15293, p. 15271.
Schultz, A. A., et al., (2019). Residential proximity to concentrated animal feeding operations and allergic and respiratory disease. Environment international, 130, 104911. p. 5. [“Associations between residential proximity within 3 miles of a CAFO and increased prevalence of allergies, asthma, and decreased lung function were observed.”]
U.S. EPA (2024) Development of Emissions Estimating Methodologies for Animal Feeding Operations, Volume 1: Overview Report, p. 1-1. [“Ammonia also is a source of odor from AFOs, but to a lesser degree because NH3 rapidly disperses in the air.”]
Wyer, K. E., et al., (2022). Ammonia emissions from agriculture and their contribution to fine particulate matter: A review of implications for human health. Journal of Environmental Management, 323, 116285–116285, p. 1. [“There is currently a chain that exists between NH3 emissions, the formation of PM2.5, and the subsequent impacts that this PM2.5 has on human health.” (See, pp. 5-6 for details regarding those transformations)]
Tessum, C. W., et al., (2019). Inequity in consumption of goods and services adds to racial–ethnic disparities in air pollution exposure. PNAS, 116(13), 6001–6006, p. 6001. [“Fine particulate matter (PM2.5) exposure is a major health risk factor in the United States, responsible for 63% of deaths from environmental causes and 3% of deaths from all causes.”]
Galloway, J. N., et al., (2003). The nitrogen cascade. Bioscience, 53(4), 341-356, Abstract. [“The same atom of Nr can cause multiple effects in the atmosphere, in terrestrial ecosystems, in freshwater and marine systems, and on human health. We call this sequence of effects the nitrogen cascade.”]
More than 10,000 U.S. deaths per year are attributed to air pollution specifically from animal ag, mostly due to ammonia generated from manure and feed crop fertilizers transforming into PM2.5.[1-6]
Domingo, N. G., et al., (2021). Air quality–related health damages of food. PNAS, 118(20), e2013637118, p. 2. [“Of food-related damages, 80% (12,700 deaths) are attributable to animal-based foods (when impacts of animal feed production are included)…” About 95% of deaths are due to NH3 and PM2.5 per Fig. 1, p. 2]
Thakrar, S. K., et al., (2020). Reducing Mortality from Air Pollution in the United States by Targeting Specific Emission Sources. Environmental Science & Technology Letters, 7(9), 639–645, Figure 3. [“Our focus is on PM2.5…” Of a total of 19,000 deaths from food and agriculture, “livestock rearing” is responsible for ~8,400 deaths and crop production adds 6,600. We estimate that half of crop production deaths are from feed crops, bringing the total to ~11,700. Calculated an alternate way, about 17,300 deaths are attributed to NH3 of which ~70% is generated by animal ag, equaling ~12,100.]
Tschofen, P., et al., (2019). Fine particulate matter damages and value added in the US economy. PNAS, 116(40), 19857–19862. [“Agricultural gross external damage is driven by ammonia and primary particulate matter damages, which are caused primarily by livestock emissions and fertilizer application (NH3), and field burning, as well as combustion emissions from agricultural equipment and other crop-related activities (primary PM2.5).” Agriculture responsible for about 29% (230/796) of deaths from attributed sources. Total deaths = 54,000 to 86,000 depending on the model. At 29% this = from ~16,000 to ~25,000. Again assuming about two-thirds from animal ag (50% of NH3 from manure and about 17% from crops specifically for feed) then total deaths from animal ag = ~11,000 to 17,000.]
Note: we assume that ~50% of the ammonia from crops is due to crops specifically grown for feed. This is based on our estimate that ~40% of N from chemical fertilizers is applied to crops specially grown for animal feed (see, Chemical Fertilizer Use on Feed Crops) and a broad estimate that at least an additional ~10% comes from the acreage allocated to soybeans and alfalfa, due to nitrogen fixation (about two-thirds used for animal feed). See, U.S. EPA (2011) Reactive Nitrogen in the United States, p. 22. [“Management of biologically fixed N, insofar as it is possible, is proportionally as critical a task as the management of synthetic N because Nr from BNF is prone to the same loss pathways as Nr from commercial fertilizers.”]
Tessum, C. W., et al., (2019). Inequity in consumption of goods and services adds to racial–ethnic disparities in air pollution exposure. PNAS, 116(13), 6001–6006. [“Agriculture (15,000 premature deaths): crop and livestock production.” ~7,800 due to livestock and manure, and 5,900 due to crop production = ~10,800 deaths, again assuming half of crop production is due to feed crops. See Supplementary Information, Table S-2]
Lelieveld, J., et al., (2015). The contribution of outdoor air pollution sources to premature mortality on a global scale. Nature, 525(7569), 367-371, Table 1. [Estimates 29% of 55,000 deaths in 2010 due to agriculture, or approximately 16,000 deaths (Table 2). Includes agriculture-related deaths due to ozone which are ~7% of deaths. The remainder is due to PM2.5.]
Ammonia emissions generated by typical size factory farms reach levels that are 10 to 20 times the level at which the EPA requires both federal and community notice for all other industries. On very large factory farms these levels regularly reach 30 to 50 times those levels.[1,2]
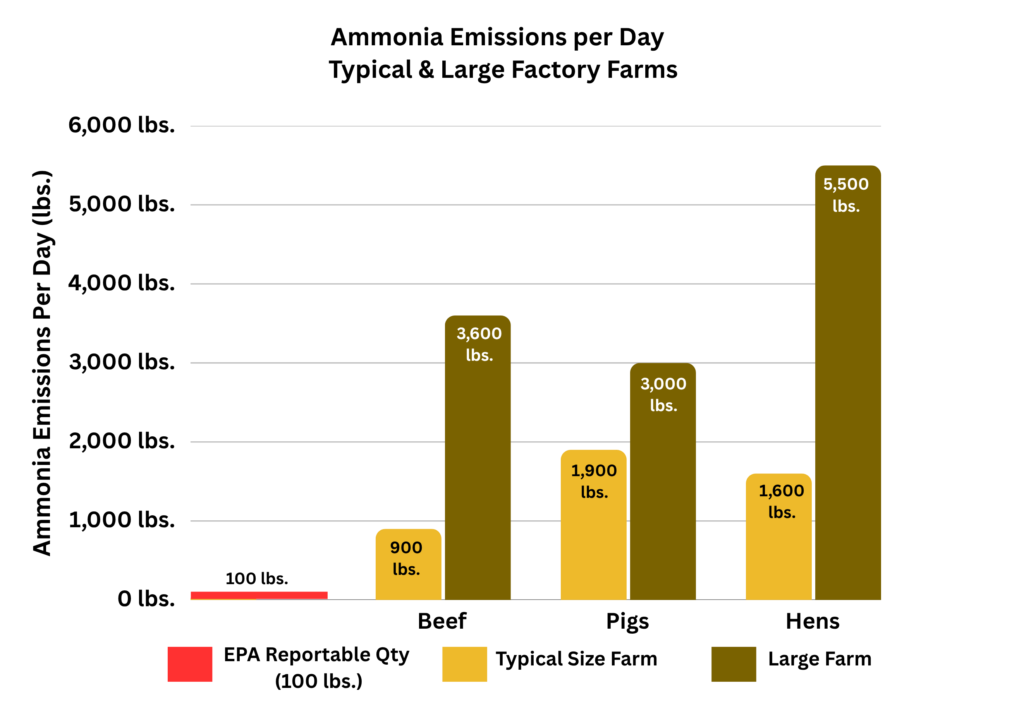
The EPA’s “reportable quantity” is 100 pounds in a 24-hr period.[3] Factory farms can exceed 5,000 pounds without reporting.[4]
See, Ammonia Emission by Animal Type and Farm Size. https://docs.google.com/spreadsheets/d/1kJ0hu4JYcDz3liG2iHc56zhAiMg5mxvopynve3YdxDg/edit?gid=0#gid=0
For further support of these figures, see, U.S. EPA (2023) Emergency Release Notification Requirements for Animal Waste Air Emissions under the Emergency Planning and Community Right-to-Know Act (EPCRA) – Technical Background Document, Table 2-6, pp. 12-13. [“[“If the Reportable Quantity were raised to 500 lbs, the preliminary estimated regulated universe would decrease from 37,891 to approximately 14,825 farms.” At 1,000 pounds (10 times the reportable quantity) more than 5,000 factory farms could be regulated, and at 5,000 pounds (50 times the EPA’s level for all other industries) more than 850 could be regulated.]
U.S. EPA (2026) Emergency Planning and Community Right-to-Know Act (EPCRA) – Determining the amount released for Ammonia and Ammonium Hydroxide for Release Notification Requirements under CERCLA section 103 and EPCRA section 304. https://www.epa.gov/epcra/emergency-release-notifications [“The release of a reportable quantity (RQ) of an Extremely Hazardous Substance (EHS) or CERCLA hazardous substance within any 24-hour period triggers the emergency release notification requirements.”]
For further info about the lack of regulations for factory farms, see, Lack of Air Regulations
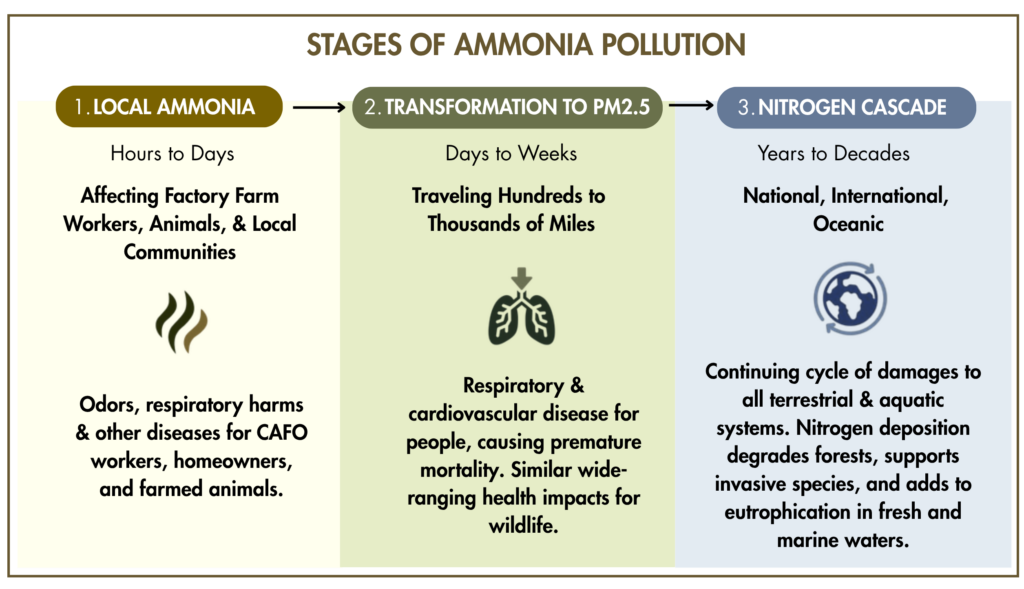
Initially, ammonia pollutes at the factory farm and local community level. Then, it pollutes on a regional level after creating PM2.5. Since nitrogen is highly reactive, it continues to form various compounds, circulating between air, water and soil.
Local – Most air-borne ammonia is short lived and will be deposited in a day or two within 2 or 3 miles of its source.[1,2] Yet at the factory farm level, ammonia causes respiratory and other diseases for farmed animals, workers, and nearby residents, and is a component of factory farm odors.[3-5]
Regional – In a second stage, some portion of ammonia reacts with aerosols to create PM2.5 which can create damage locally and drift hundreds or even a thousand miles or more from the source.[6-8] Human respiratory and cardiovascular diseases are well documented, with more than 10,000 U.S. deaths per year attributed to ammonia’s role in PM2.5.[9] Atmospheric deposition onto terrestrial and aquatic ecosystems cause degradation of plant communities (including forests) and the eutrophication of waterways.[10]
National – There is a third stage of ammonia pollution, much less predictable and harder to study. Escaped nitrogen in any form, including ammonia, continues to react with other compounds on a long journey of environmental and health damages, moving from one ecosystem to another. This is known as the nitrogen cascade.[11] The eventual impacts include: biodiversity loss, forest decline, acidification of surface waters, hypoxia of coastal waters, harmful algal blooms, and the spread of invasive species.[12]
About a third of the ammonia that escapes into the environment yearly is advected beyond the U.S “to other nations or to the global atmospheric or ocean commons.”[13]
Krupa, S. V. (2003). Effects of atmospheric ammonia (NH3) on terrestrial vegetation: a review. Environmental pollution, 124(2), 179-221, p. 181. [Ammonia lifespan of several hours to perhaps 1 to 4 days and a reach of ~.5 to 3 or 4 miles. PM2.5 assumed lifespan of about a week.]
Nair, A. A., & Yu, F. (2020). Quantification of Atmospheric Ammonia Concentrations: A Review of Its Measurement and Modeling. Atmosphere, 11(10), 1092, p. 2. [“While ammonia itself has a very short atmospheric lifetime of a few hours to a day owing to rapid deposition and particle uptake, its particulate forms too have relatively short atmospheric lifetimes of under a week…”]
Naseem, S., & King, A. J. (2018). Ammonia production in poultry houses can affect health of humans, birds, and the environment—techniques for its reduction during poultry production. Environmental Science and Pollution Research International, 25(16), 15269–15293, p. 15271.
Schultz, A. A., et al., (2019). Residential proximity to concentrated animal feeding operations and allergic and respiratory disease. Environment international, 130, 104911, p. 5. [“Associations between residential proximity within 3 miles of a CAFO and increased prevalence of allergies, asthma, and decreased lung function were observed.”]
U.S. EPA (2024) Development of Emissions Estimating Methodologies for Animal Feeding Operations, Volume 1: Overview Report, p. 1-1. [“Ammonia also is a source of odor from AFOs, but to a lesser degree because NH3 rapidly disperses in the air.”]Chamanara, S., et al., (2025). Geography of animal feeding operations and their contribution to fine particulate matter pollution in vulnerable communities in the United States. Communications Earth & Environment, 6(1), 620, Abstract. [“… we find that AFOs raise local PM2.5 levels by 28% near cattle operations and 11% near hog farms, even after accounting for urban and industrial confounders.”]
Goodkind, A. L., et al., (2019). Fine-scale damage estimates of particulate matter air pollution reveal opportunities for location-specific mitigation of emissions. PNAS, 116(18), 8775-8780, Abstract. [“We find that 33% of damages occur within 8 km of emission sources, but 25% occur more than 256 km away…”]
Chamanara, S., et al., (2025). Geography of animal feeding operations and their contribution to fine particulate matter pollution in vulnerable communities in the United States. Communications Earth & Environment, 6(1), 620, Abstract. [“… we find that AFOs raise local PM2.5 levels by 28% near cattle operations and 11% near hog farms, even after accounting for urban and industrial confounders.”]
Aneja, V. P., et al., (2008). Ammonia assessment from agriculture: US status and needs. Journal of Environmental Quality, 37(2), 515-520. [With a lifespan of about 1 to 15 days, “ammonium aerosols might travel as far as 2500 km…”]
See previous question and Animal Ag Ammonia and Human Health for further info.
Behera, S. N., et al., (2013). Ammonia in the atmosphere: a review on emission sources, atmospheric chemistry and deposition on terrestrial bodies. Environmental Science and Pollution Research, 20, 8092-8131, pp. 8121–8124, p. 8108. [“After particulate formation and with the advantage of atmospheric lifetimes of the order of 1–15 days, NH4 salts have the tendency to be transported and deposited at larger distances from emission sources, contributing to soil acidification, forest decline and eutrophication of waterways.”]
Galloway, J. N., et al., (2003). The nitrogen cascade. Bioscience, 53(4), 341-356, Abstract. [“The same atom of Nr can cause multiple effects in the atmosphere, in terrestrial ecosystems, in freshwater and marine systems, and on human health. We call this sequence of effects the nitrogen cascade.”]
U.S. EPA (2011) Reactive Nitrogen in the United States: An Analysis of Inputs, Flows, Consequences, and Management Options, A Report of the EPA Science Advisory Board, p. 4. [“Unlike other element-based pollution problems, the N cascade links the negative impacts, where one N-containing molecule can in sequence contribute to all the environmental issues mentioned above.”] [See also, Table ES-1 and pp. 41-42]
U.S. EPA (2011) Reactive Nitrogen in the United States, p. ES-6. [Of total NH3 emissions, “about 1 Tg N/yr (of a total of 3.1 Tg N) is advected out of the U.S. via the atmosphere.”]
The two largest sources of newly created anthropogenic reactive nitrogen are chemical fertilizers applied to crops and the fixation of nitrogen from legume production (mostly from soybeans and alfalfa/hay).[1,2] Approximately two-thirds of that nitrogen is incorporated into plants and about a third of the nitrogen escapes into the air, water, and soil.[3,4]
The nitrogen taken up by the plants and thus retained in feed crops is ingested by farmed animals. The animals retain on average ~30% of the nitrogen, while ~70% of the nitrogen is excreted in manure.[5,6] Most of the nitrogen in manure is lost to the environment.[7] Of the total “leaked” nitrogen, about 15-20% escapes into the air as ammonia.[8,9]
About 90% of anthropogenic ammonia comes from agriculture, with animal ag responsible for the majority.[10]
Ammonia is a “precursor gas” that turns into PM2.5 – the most damaging component of air pollution to human health. Broadly estimated, agriculture is responsible for ~20-25% of the PM2.5 in the U.S., with most of that share due to ammonia emissions.[11]
U.S. EPA (2011) Reactive Nitrogen in the United States: An Analysis of Inputs, Flows, Consequences, and Management Options, A Report of the EPA Science Advisory Board- 2011, p. ES-5. [Anthropogenic sources = 18.7 Tg N / 28.5 = ~65% from agricultural sources. Reactive nitrogen includes any nitrogen compound on earth that is not N2, the nitrogen that makes up about 78% of the air.][65% from agricultural sources.]
Sobota, D. J., et al., (2013). Reactive nitrogen inputs to US lands and waterways: how certain are we about sources and fluxes? Frontiers in Ecology and the Environment, 11(2), 82-90, Table 2. [~69% from agricultural sources]
Davidson, E. A., et al., (2011). Excess nitrogen in the US environment: trends, risks, and solutions. Issues in ecology, (15), p. 2. [“A large fraction of nitrogen fertilizer applied to cropland – often over half – is not used by the crops and is lost to air, water, and downstream and downwind habitats, polluting landscapes and waterscapes.”]
Zhang, X., et al., (2015). Managing nitrogen for sustainable development. Nature, 528(7580), 51-59. [Cites nitrogen use efficiency for U.S. and Canada at 68%. See Table 1, p. 55]
Davidson, E. A., et al., (2011), p. 10. [“Most livestock only utilize about 30% of the nitrogen in their feed; the rest is excreted in manure (feces and urine).”]
Rotz, C. A. (2004). Management to reduce nitrogen losses in animal production. Journal of animal science, 82(suppl_13), E119-E137, p. E121. [Dairy 20 to 30%, feedlot beef 10%, pigs and poultry 30 to 40%.]
See, Total Manure Nutrient Pollution
Houlton, B. Z., et al., (2013). Intentional versus unintentional nitrogen use in the United States: trends, efficiency and implications. Biogeochemistry, 114, 11-23, Figure 3. [Estimate is 13% of total N lost to the environment via NH3. Of anthropogenic N creation this would be about 16%.]
Sobota, D. J., et al., (2015). Cost of reactive nitrogen release from human activities to the environment in the United States. Environmental Research Letters, 10(2), 025006, p. 6 and Figure 4B. [At the national scale, N leakages per year = 4.8 Tg N surface freshwater, 4.2 groundwater, 3.0 ammonia, 1.9 coastal zones, 1.4 fossil fuel combustion. Calculation: 3.0 Tg N / 15.3 = 19.6%. Ammonia emissions have grown to ~5.5 million tons (~5 Tg N) per the EPA, so the 15-20% figure could be an underestimate.]
U.S. EPA (2024) 2020 NEI Supporting Data and Summaries – Data Queries for Sector Summaries.
[Query: National/Ammonia NH3/Livestock Waste (49.2%), Fertilizer Application (33.5%), Agricultural Field burning (2.7%) of total. Total ag ammonia (4,675,035) / total ammonia (5,482,484 tons) = 85.3%. EPA includes 321,482 tons of ammonia from unprescribed wildfires in total ammonia; not including this amount (thereby considering only anthropogenic) makes ag contribution ~91%.]Lelieveld, J., et al., (2015). The contribution of outdoor air pollution sources to premature mortality on a global scale. Nature, 525(7569), 367-371, Table 2. [Estimates 29% from agriculture in U.S. in 2010, with more than 90% due to PM2.5. There are varied estimates of this figure; for more sources see, Agricultural PM2.5 Pollution.]
The primary impacts of ammonia on the environment are from nitrogen deposition – the transformation of ammonia from air-based compounds to nitrogen-based pollutants returning to water and land. The effects of this form of nutrient pollution on plant life and forests can be severe, often favoring invasive species that thrive on higher levels of nitrogen.[1-3]
Nitrogen deposition in waterways adds to nutrient pollution, eutrophication, and biodiversity loss.[4-6]
Additionally, it is likely that many wild species are compromised by PM2.5, similar to the health effects on humans.[7]
Krupa, S. V. (2003). Effects of atmospheric ammonia (NH3) on terrestrial vegetation: a review. Environmental pollution, 124(2), 179-221, p. 212 [“Natural and semi-natural ecosystems, as well as forests must be expected to be severely at risk from the current amount of N deposition. Agricultural crops appear to be the only systems not negatively influenced at present, since high productivity and turnover prevent the accumulation of N.”]
Behera, S. N., et al., (2013). Ammonia in the atmosphere: a review on emission sources, atmospheric chemistry and deposition on terrestrial bodies. Environmental Science and Pollution Research, 20, 8092-8131, pp. 8121–8124.
Guthrie, S., et al., (2018). The impact of ammonia emissions from agriculture on biodiversity. RAND Corporation and The Royal Society, Cambridge, UK, p. 7. [“Common, fast-growing species adapted to high nutrient availability thrive in a nitrogen-rich environment and out-compete species which are more sensitive, smaller or rarer.”]
Robertson, D. M., & Saad, D. A. (2021). Nitrogen and phosphorus sources and delivery from the Mississippi/Atchafalaya River Basin: An update using 2012 SPARROW models. JAWRA Journal of the American Water Resources Association, 57(3), 406-429, p. 414. [“…about 40% of the N from atmospheric deposition originated from agricultural sources, primarily manure.”]
Clark, C. M., et al., (2017). Nitrogen‐induced terrestrial eutrophication: cascading effects and impacts on ecosystem services. Ecosphere, 8(7), e01877, Abstract & p. 23. [“Human activity has significantly increased the deposition of nitrogen (N) on terrestrial ecosystems over pre-industrial levels leading to a multitude of effects including losses of biodiversity, changes in ecosystem functioning, and impacts on human well-being. … Species of interest are lost, community composition changes, and secondary effects occur, including changes in fire regimes, runoff and aquifer recharge, carbon sequestration, and habitat of high-value species.”]
For additional info on environmental impacts, see, Ammonia Emissions from Animal Ag [question: What are the environmental damages of ammonia from animal ag?]
For info on the PM2.5 impacts on wild animals, see, Ammonia’s Contribution to PM2.5 [question: What is the impact of PM2.5 on wild and farmed animals?]
The highest levels of ammonia emissions are inside factory farm sheds and on feedlots. Most affected are the animals who live daily with the fumes.[1]
Chickens, and especially egg-laying hens, endure particularly high ammonia levels with accompanying respiratory symptoms.[2-5]
Respiratory diseases in pigs are also common and a source of production losses.[6,7] Ammonia levels tend to be high in pig facilities due to the large accumulations of manure; high levels are a cause of pig respiratory diseases.[8,9] The most common diseases in feedlot cattle are respiratory.[10]
The levels of PM2.5 on factory farms can far exceed the EPA’s standards.[11,12]
For a helpful chart outlining factory farm ammonia levels and impacts, see, Ni, J. Q., et al., (2018). Ammonia and hydrogen sulfide in swine production. In Air Quality and Livestock Production, Banzhazi et al. (Eds.), London, UK, CRC Press, 29-47. [Table 1]
Liu, S., et al., (2019). Modeling of dynamic ammonia concentrations in two commercial layer hen houses. Journal of Environmental Informatics, 33(1), 56-67. [“Ammonia (NH3) concentrations in confined layer hen houses are the highest among buildings of different animal species and are of great concern to indoor air quality and animal welfare.” at Abstract]
David, B., et al., (2015). Air quality in alternative housing systems may have an impact on laying hen welfare. Part II—Ammonia. Animals, 5(3), 886-896, p. 888. [Cage-free housing facilities tend to have higher ammonia levels. Levels in winter tend to be higher, probably to save on heating costs by reducing ventilation.]
Naseem, & King, A. J. (2018). Ammonia production in poultry houses can affect health of humans, birds, and the environment—techniques for its reduction during poultry production. Environmental Science and Pollution Research International, 25(16), 15269–15293. [See, Table 4 for a list of negative health impacts on poultry due to high ammonia levels.]
USDA APHIS (2014) Layers 2013, Part I: Reference of Health and Management Practices on Table-Egg Farms in the United States, 2013, p. 42. [On large farms, respiratory disease is the 2nd largest health issue.]
USDA APHIS (2016) Swine 2012, Part II: Reference of Swine Health and Health Management in the United States, 2012, p. 57 and 86. [PRRS (porcine reproductive and respiratory syndrome) is most common disease with influenza second]
Opriessnig, T., et al., (2011). Polymicrobial respiratory disease in pigs. Animal Health Research Reviews, 12(2), 133-148.
Ni, J. Q., et al., (2018), p. 1. [“Typical NH3 concentrations at swine facilities range from 0 to 40 ppm and are usually higher than at dairy and beef facilities, but lower than in poultry houses. The highest values are generally found in the finishing buildings.”]
Samaneh Azarpajouh (October 2022) Impact on pigs of chronic exposure to ammonia. Pig Progress. https://www.pigprogress.net/health-nutrition/health/exposure-to-ammonia-on-pigs/
USDA APHIS (2013) Feedlot 2011, Part IV: Health and Health Management on U.S. Feedlots with a Capacity of 1,000 or More Head, p. 18. [“Shipping fever, or bovine respiratory disease complex, is the most common morbidity and mortality event among feedlot cattle.”]
Bist, R. B., & Chai, L. (2022). Advanced strategies for mitigating particulate matter generations in poultry houses. Applied Sciences, 12(22), 11323, Abstract. [“To protect public health and welfare, the occupational exposure limit for PM10 and PM2.5 are suggested not to exceed 150 ug/m3 and 35 ug/m3 respectively, based on 24-h concentrations thresholds as suggested by US. EPA. However, the levels of PM10 and PM2.5 in poultry houses could be 100 times higher than that limit. For instance, PM10 and PM2.5 levels in cage-free henhouses are higher than 15,000 ug/m3 and 3,500 ug/m3 in wintertime.”]
Li, Q., et al., (2011). Fine particulate matter in a high-rise layer house and its vicinity. Transactions of the ASABE, 54(6), 2299-2310, p. 2303. [“The average concentration of PM2.5 inside the house was as high as 141 ug per m-3. This high concentration may potentially compromise the health of the workers and the production efficiency of the hens, and thus the profit of the farm.”]
To some degree, yes. Water quality goals and air quality goals can be in conflict, and operators have some influence over which type of emissions they allow.[1] Some degree of “pollution swapping” is likely occurring.[2,3]
The largest source of ammonia comes from farmed animal manure.[4] Ammonia starts escaping from feces and urine as soon as it is excreted and continues through all stages of handling.[5] Storing manure in lagoons greatly increases ammonia volatilization.[6] As the USDA noted many years ago, lower nitrogen levels can in some cases allow factory farms “to apply more manure on less land without exceeding crop nutrient requirements, thereby lowering manure transportation costs by eliminating the need to transport manure to more distant cropland.”[7]
Some factory farms are likely choosing to generate air pollution rather than water pollution.[8] Air pollution regulations for factory farms are generally even weaker than water pollution regulations.[9]
Aillery, M. P., et al., (2005). Managing manure to improve air and water quality. USDA Economic Research Service, Report 9, p. iii. [“To meet a water quality goal, farmers tend to use practices that increase ammonia emissions to the air. Similarly, the practices used to meet an air quality goal would tend to increase nitrogen losses from fields to ground and surface waters. Meeting both air and water quality goals would likely cost more than meeting either air or water goals.”]
Rotz, A., et al., (2021). Environmental assessment of United States dairy farms. Journal of Cleaner Production, 315, 128153. [“While strategies are available to reduce NH3 emissions, finding economical and sustainable solutions that do not result in pollution swapping remains a challenge for the dairy industry.” (p. 1) Also see Figure 2: 66% of reactive nitrogen loss from dairy farms is via ammonia emissions (which are mostly unregulated).]
van Grinsven, H. J., et al., (2015). Losses of ammonia and nitrate from agriculture and their effect on nitrogen recovery in the European Union and the United States between 1900 and 2050. Journal of environmental quality, 44(2), 356-367, p. 357. [“Ammonia is considered in concentrated animal feeding operation (CAFO) guidelines as a water quality issue in effluent. As a result, some manure management systems in CAFOs enhance NH3 volatilization to lower the N content of manure.”]
U.S. EPA (2024). 2020 NEI Supporting Data and Summaries – Data Queries for Sector Summaries. [Query: National/Ammonia NH3/Livestock Waste (49.2%), fertilizer application (33.5%) of total (54,82,484 tons)]
Rotz, C. A. (2004). Management to reduce nitrogen losses in animal production. Journal of animal science, 82(suppl_13), E119-E137. [“Volatile loss begins soon after excretion, and it continues through all manure handling processes until the manure nutrients are incorporated into soil.”]
Rotz, C. A. (2004), p. E119. [“At least 70% of the nitrogen entering anaerobic lagoons is typically lost.”]
Key, N. et al., (2011). Trends and Developments in Hog Manure Management: 1998-2009, USDA Economic Research Service, Bulletin No. 81, p. 23. [Lagoons reduce manure’s nitrogen content through anaerobic digestion and ammonia volatilization. This allows farmers to apply more manure on less land without exceeding crop nutrient requirements, thereby lowering manure transportation costs by eliminating the need to transport manure to more distant cropland.”]
Aillery, M. P., et al., (2005), p. 13. [“Farmers faced with nitrogen application restrictions through a required nutrient management plan—but not ammonia emission restrictions—might try to reduce the nitrogen content of manure as a means of reducing the amount of land needed for spreading, and limiting hauling costs.”]
Madison McVan (April 20, 2023). 18 years and counting: EPA still has no method for measuring CAFO air pollution. Investigate MidWest. https://investigatemidwest.org/2023/04/20/18-years-and-counting-epa-still-has-no-method-for-measuring-cafo-air-pollution/