The EPA reports that in 2023, agriculture was responsible for 10.5% of total U.S. anthropogenic greenhouse gas emissions.[1-3] This figure includes on-farm energy use.[4]
EPA (2025) Inventory of U.S. Greenhouse Gas Emissions and Sinks: 1990-2023, EPA 430-R-25-003. p. ES-23. (Hereafter: “EPA (2025) Inventory GHG 2023”)[“Activities related to agriculture accounted for 10.5 percent of emissions…”]
See, Agricultural GHG Emissions for the possible EPA-based answers to this question and why we choose this number.
Note: For GHG emissions for the entire “food system” or “food supply chain,” the figure rises to about 15-18%. See, Agricultural GHG Emissions [question: What share of total U.S. GHG emissions comes from the entire U.S. food system?]
EPA (2025) Inventory GHG 2023, p. ES-22. [“The agriculture economic sector includes emissions from fossil fuel combustion and electricity use within the agriculture sector.”]
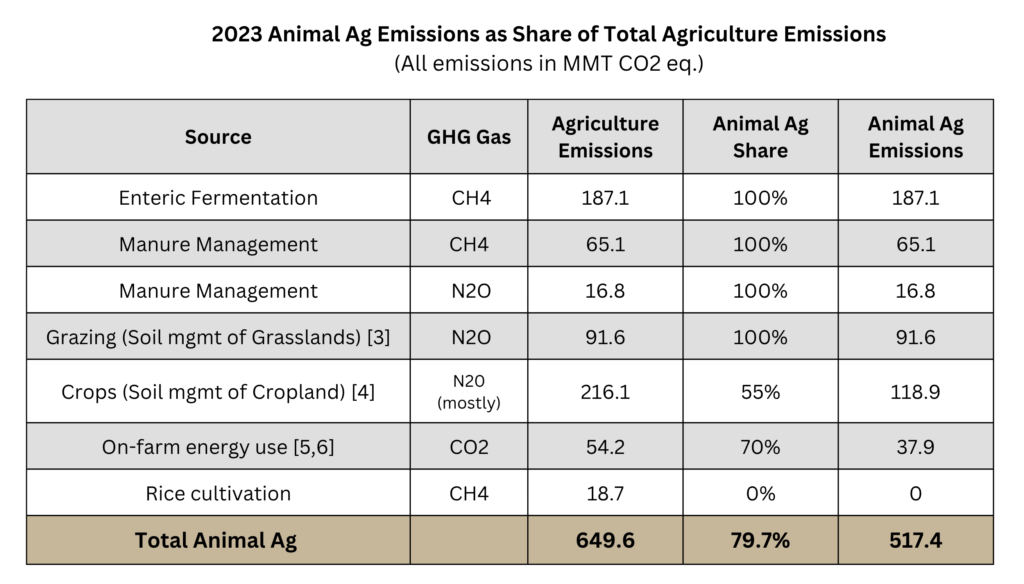
Animal ag emissions, including emissions from feed crops and grazing, are broadly estimated at ~80% of total agricultural emissions, using EPA data as a baseline.[1,2]
These figures include the share directly attributable to livestock, plus the share attributed to feed crops, based on our estimate that ~55% of U.S. cropland is specifically allocated to crops going to animal feed.[3-6]
See, GHG Emissions from Animal Ag 2023 https://docs.google.com/spreadsheets/d/1q7424dog66xtGiS8w_Xc1fCVy4z9fESZwE1yCUora04/edit?gid=0#gid=0
EPA (2025) Inventory GHG 2023, Table 5-1. [The EPA does not aggregate these categories under “animal agriculture,” nor does it make the calculation that 80% of emissions can be attributed to animal ag; that’s our calculation. However, it is based solely on EPA figures and an assessment of the shares attributable to animal ag. The EPA tends to obscure the breadth of animal ag’s impacts. There is little mention, for example, of the role of feed crops; grazing land is generally referred to as “grasslands” with minimal explanation of the connection. Still, we base our main assessment on EPA figures as the most credible national inventory, calculating the shares of each agricultural category attributable to animal ag.
Note on Grazing: We add N2O from “Soil Management of Grassland” to animal ag emissions since we estimate that it is entirely attributable to grazing management practices. This is based on a close reading of: EPA (2025). Inventory GHG 2023, Section 5.4 Agricultural Soil Management pp. 5-34 to 5-56. “Grassland includes pasture and rangeland that produce grass or mixed grass/legume forage primarily for livestock grazing.” (at p. 5-50) Also see: USDA Office of the Chief Economist (2022). Greenhouse Gas Inventory 1990-2018, Technical Bulletin No. 1957, which clearly connects all EPA “grassland” emissions to “grazing land.” See Table 2-6 on p. 23 and section on Grazed Lands pp. 24-28. This report enumerates the types of emissions counted, including some due to land use change. Land use change emissions are not included in the EPA estimates of Agricultural Soil Management emissions, nor the totals for agriculture.
Note on Crops: Our figure for Soil management of Cropland is the share of emissions from crops specifically used for animal feed. We use 55% of emissions from cropland practices as the total attributed to animal ag, given our assessment that more than 55% of U.S. cropland is allocated to crops specifically going to animal feed (see, Total Feed Crops Share) Emissions from crops are mostly N2O from agricultural soils. We also include 55% of other minor emissions categories typically from croplands: Urea Fertilization, Liming, and Field Burning Residue. Rice is excluded from crop emission calculations because it is treated as a separate category by the EPA due to its high methane emissions.
U.S. Energy Information Administration (October 17, 2014). Energy for growing and harvesting crops is a large component of farm operating costs. [Based on this and the following reports, we use 70% as an estimate of animal ag’s fuel and electricity usage. See approximated graph figures: 290 + 490 = 780; 290 / 780 = 37.2%; 490 / 780 = 62.8%; 62.8 * .55 = 34.5%; 34.5 + 37.2 = ~72%. The figure .55 reflects our assessment that ~55% of cropland is devoted to feed crops.]
Miranowski, J. (2005). Agriculture as a Producer and Consumer of Energy, In Energy consumption in US Agriculture, 1, 68-111, p. 75. [“Livestock farms accounted for US$2.72 billion of fuel and lubricant and US$1.59 billion of electricity expenditures, or 39% of total farm fuel purchases and 47% of electricity purchases.” Therefore, livestock farms used ~42% of total energy, crop farms ~58%. Therefore 42 + (.55 * 58) = 32 + 42 = ~74%. The figure .55 reflects our assessment that ~55% of cropland is devoted to feed crops.]
Animal ag’s share of total U.S. emissions is a little more than 8%, including feed crops and grazing land. This figure is estimated using EPA data as a baseline, and the calculations and assumptions noted above.[1]
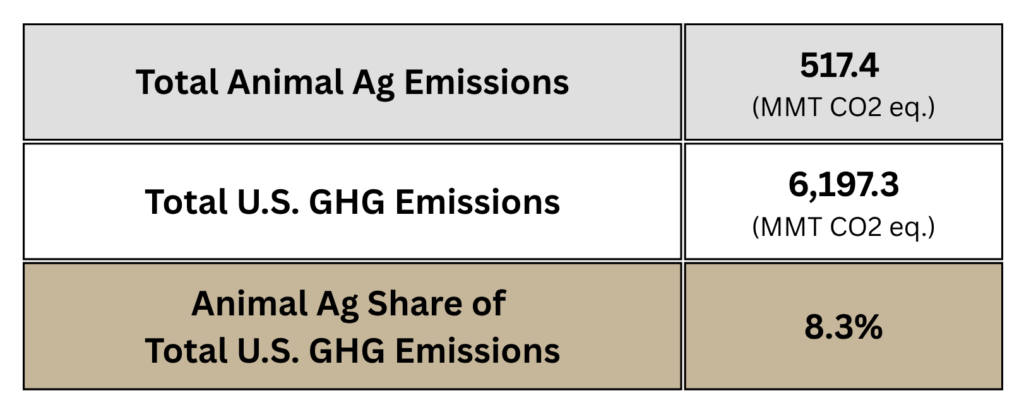
See, GHG Emissions from Animal Ag 2023 https://docs.google.com/spreadsheets/d/1q7424dog66xtGiS8w_Xc1fCVy4z9fESZwE1yCUora04/edit?gid=0#gid=0
Industry sources and industry-aligned researchers have claimed that animal agriculture is responsible for about 4% of U.S. GHG emissions.[1-5] That feed crops and grazing are excluded from this figure is misleading.
Frank Mitloehner (October 25, 2018). Yes, Eating Meat Affects the Environment, but Cows are Not Killing the Climate. CLEAR Center UC Davis. [“All of animal agriculture contributes less than half of this amount, representing 3.9 percent of total U.S. greenhouse gas emissions.”
Michelle Miller (April 30, 2024). Agriculture Decreased GHG emissions by Almost 2% in Just One Year, American Biogas Council. [“GHG emissions from livestock totaled 4.3 percent of all emissions, which is 274 million metric tons and is down 2.1 percent from 2021.”]
American Farm Bureau Federation (2026). Sustainability. [“Although livestock emissions get a lot of attention in discussions around sustainability, they make up 4.3% of overall emissions in the U.S., and those numbers are declining thanks to improvements in feed and production.”]
The Poultry Site (June 2016). How Much Does Animal Agriculture Contribute to US Greenhouse Gas Emissions? [“Leading scientists throughout the US, as well as the US Environmental Protection Agency have quantified the impacts of animal production in the US, which accounts for 4.2 per cent of all GHG emissions, very far from the 18-51 per cent range that advocates often cite.”]
Dr. Sarah Place (April 2023). Annual Inventory of U.S. Greenhouse Gas Emissions and Sinks, Colorado State University, Figure 5. [Greenhouse gas emissions from US agriculture in 2021 expressed as a percentage of total US emissions from the US EPA Greenhouse Gas Inventory of Emissions and Sinks. Animal Agriculture = 4.4%.]
Of the ~80% of total agricultural GHG emissions attributed to animal agriculture, enteric fermentation is the largest category at almost 30% of agricultural emissions.
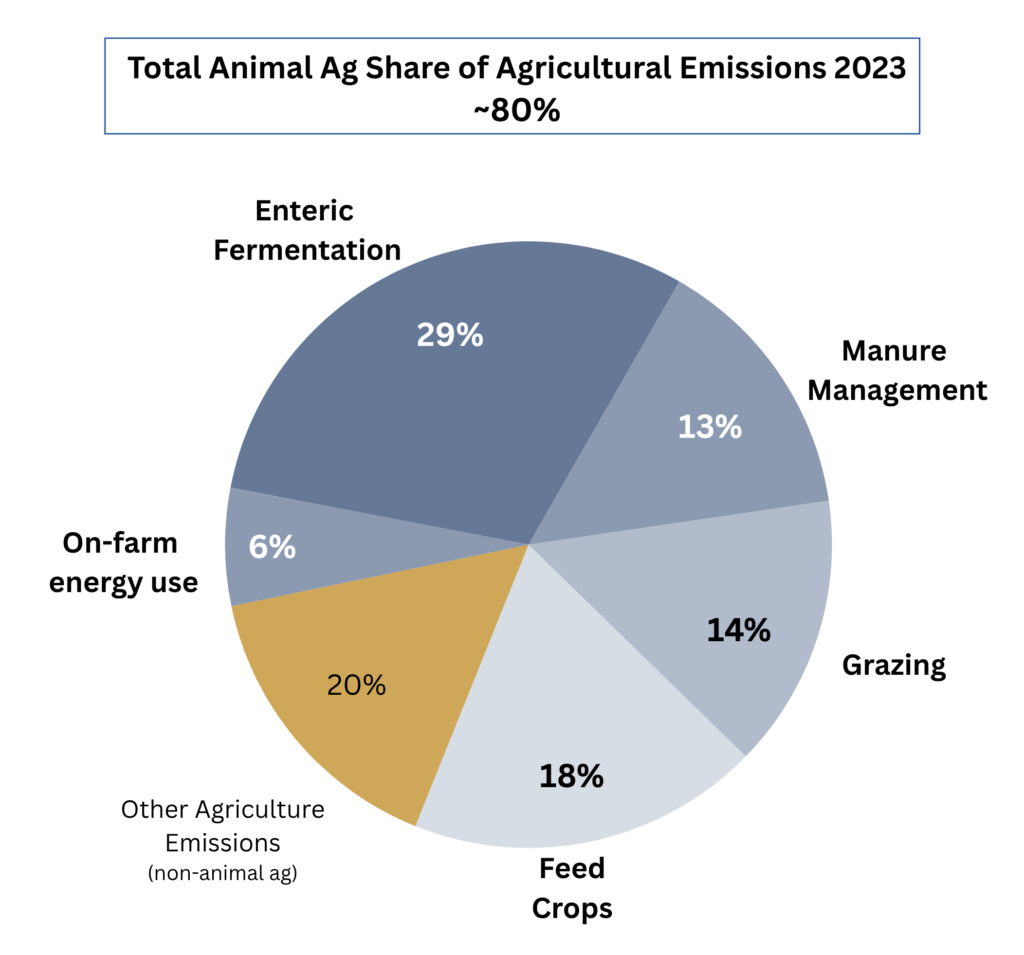
See, Animal Ag Share of Agriculture Emissions by Category 2023 https://docs.google.com/spreadsheets/d/18Qo04i9EFGpavRvj_cm0d1tTrCnxsTMuZPKF2k1vho4/edit?gid=0#gid=0
Based on: EPA (2025) Inventory GHG 2023. See question above for calculations and assumptions: What is animal ag’s share of agriculture’s GHG emissions?
More than 90% of animal ag’s emissions (in CO2 eq.) are in the form of methane (CH4) and nitrous oxide (N2O).[1] For the U.S. overall, CO2 has by far the largest impact.[2] Within agriculture its impacts are small.
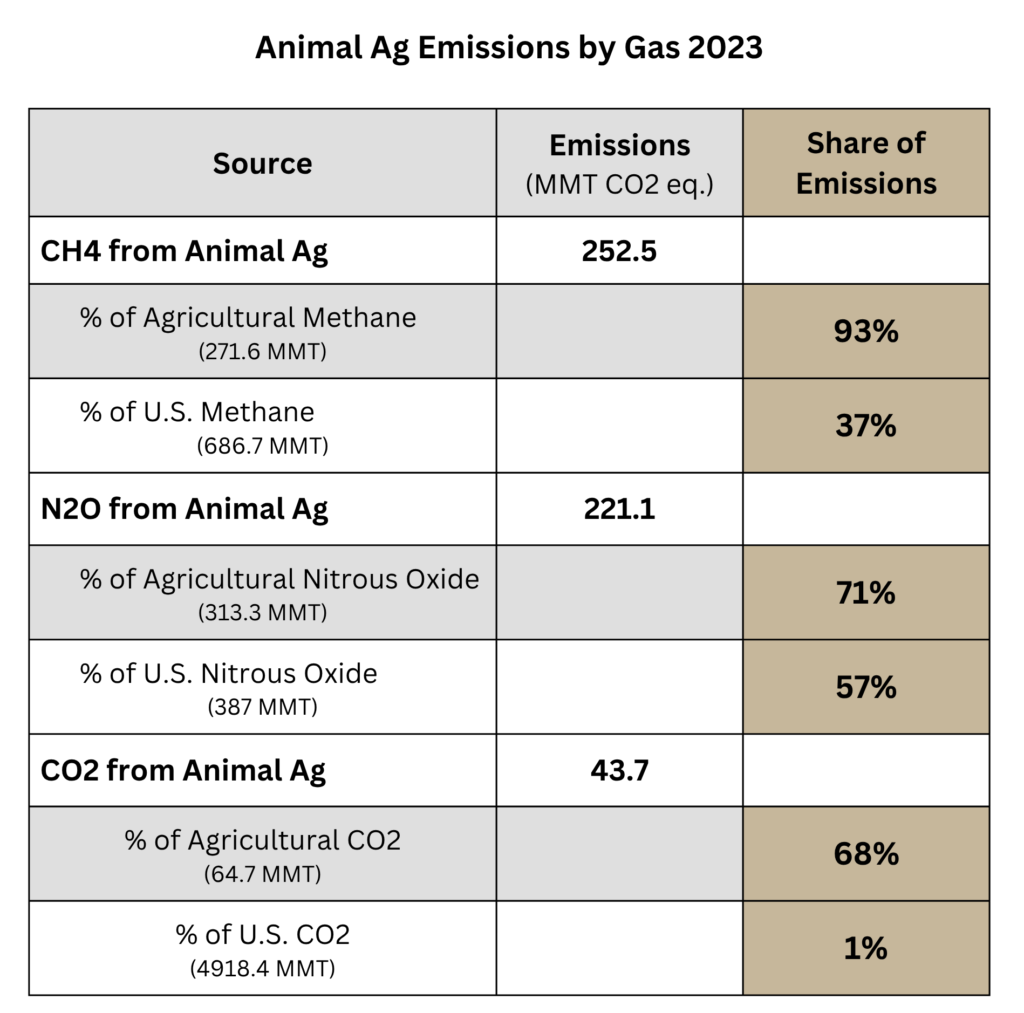
EPA (2025) Inventory GHG 2023, Table 5-1, p. 5-3 and Table ES-5, p. 22. And see, https://docs.google.com/spreadsheets/d/1q7424dog66xtGiS8w_Xc1fCVy4z9fESZwE1yCUora04/edit?gid=0#gid=0
EPA (2025) Inventory GHG 2023, Table 2-1, p. 2-4. [CO2 = 4,918.4 / 6,197.3 = 79.4%.]
Since the great majority of agriculture’s emissions are from animal ag (~80%) we repeat from the agriculture page the reasons why agricultural emissions are uncertain and/or underestimated.
Large uncertainties and potential underestimates of emissions from U.S. agriculture are due to the outsized influence of methane and nitrous oxide, the difficulties in assigning precise impacts to those gases, the vast territory over which those widely varying impacts unfold, the uncountable and unmonitored sources, and the climate-changing legacies from centuries of agricultural land transformation.[1] In more detail:
![]() Uncertainty regarding equivalencies – Because 90% of U.S. agricultural emissions are made up of gases other than CO2 (methane and nitrous oxide) with high potency, the methodologies for determining equivalencies take on extra importance, especially given their inherent uncertainties.[2]
Uncertainty regarding equivalencies – Because 90% of U.S. agricultural emissions are made up of gases other than CO2 (methane and nitrous oxide) with high potency, the methodologies for determining equivalencies take on extra importance, especially given their inherent uncertainties.[2]
![]() Underestimated quantities – Some researchers suggest that methane and nitrous oxide are methodically underestimated.[3,4] Assessing myriad non-point sources across the country presents unique challenges.[5,6]
Underestimated quantities – Some researchers suggest that methane and nitrous oxide are methodically underestimated.[3,4] Assessing myriad non-point sources across the country presents unique challenges.[5,6]
![]() Land use changes – Because of IPCC protocols, the EPA does not consider agricultural land use changes under agriculture.[7,8] Agriculture uses ~45% of U.S. contiguous land, so the protocols involving land uses and land transformations have large impacts on agricultural estimates.[9]
Land use changes – Because of IPCC protocols, the EPA does not consider agricultural land use changes under agriculture.[7,8] Agriculture uses ~45% of U.S. contiguous land, so the protocols involving land uses and land transformations have large impacts on agricultural estimates.[9]
![]() Land use legacies – Most assessments consider current agricultural land use areas as a baseline, rather than considering the opportunity costs of ongoing land usage decisions and the GHG reductions that could be gained from converting crop and grazing land back to natural environments that could store more carbon.[10,11]
Land use legacies – Most assessments consider current agricultural land use areas as a baseline, rather than considering the opportunity costs of ongoing land usage decisions and the GHG reductions that could be gained from converting crop and grazing land back to natural environments that could store more carbon.[10,11]
![]() Overlooked inputs and processes – Some inputs to agricultural production are counted in other categories, such as the energy use of fertilizer production.[12,13] Because of the wide range of agricultural activities, particular emission-generating processes are sometimes found to be underestimated or overlooked.[14]
Overlooked inputs and processes – Some inputs to agricultural production are counted in other categories, such as the energy use of fertilizer production.[12,13] Because of the wide range of agricultural activities, particular emission-generating processes are sometimes found to be underestimated or overlooked.[14]
![]() Agricultural exceptionalism – Underestimates may also reflect a cultural bias that tends to protect agricultural interests from environmental constraints.[15,16]
Agricultural exceptionalism – Underestimates may also reflect a cultural bias that tends to protect agricultural interests from environmental constraints.[15,16]
Lehner, P. H. & Rosenberg, N. A. (2022). The climate crisis and agriculture. Environmental Law Reporter, 52, 10096, p. 10104. [This report explores many of these factors.]
Lynch, J., et al., (2021). Agriculture’s contribution to climate change and role in mitigation is distinct from predominantly fossil CO2-emitting sectors. Frontiers in sustainable food systems, 4, 518039, p. 7. [“There is no satisfactory means by which a single pulse-emissions-based weighting can be used to describe a physical “equivalence” between gases, so our common reporting measure of GWP100 CO2e, which is built on this approach, cannot provide clear climatic inference.”]
Hayek, M. N. & Miller, S. M. (2021). Underestimates of methane from intensively raised animals could undermine goals of sustainable development. Environmental Research Letters, 16(6), 063006, p. 5. [“The difference is much greater in the United States; at least four top-down estimates of the contiguous US, representative of emissions occurring over at least one full year, indicate that direct animal methane emissions are 39%–90% higher than bottom-up models predict.”]
Del Grosso, S. J. et al., (2022). A gap in nitrous oxide emission reporting complicates long-term climate mitigation. PNAS, 119(31), e2200354119. Abstract [“We show that both atmospheric inversions and newly implemented bottom-up modeling approaches exhibit large N2O pulses in the north central region of the United States during early spring and this increases annual N2O emissions from croplands and grasslands reported in the national GHG inventory by 6 to 16%.”]
The Greenhouse Gas Monitoring & Measurement Interagency Working Group (2023). Federal Strategy to Advance Greenhouse Gas Emissions Measurement and Monitoring for the Agriculture and Forest Sectors, p. 3 & p. 5. [“Many of the source and sink categories within the agriculture and forest sectors are complex and heterogeneous, making GHG quantification challenging. … Monitoring and reporting land use and land conversions requires sustained observation networks that are maintained over time…”]
Lawrence, N. C., et al. (2021). Nitrous oxide emissions from agricultural soils challenge climate sustainability in the US Corn Belt. PNAS, 118(46), e2112108118, p. 1. [“Despite decades of measurements, the sources and magnitudes of agricultural N2O emissions remain difficult to estimate.”]
EPA (2025) Inventory GHG 2023, Table ES-4, p. ES-20. [“Throughout this report, emission and sink estimates are grouped into five reporting sectors… and are calculated using methods that are consistent with the 2006 Intergovernmental Panel on Climate Change (IPCC) Guidelines for National Greenhouse Gas Inventories (2006 IPCC Guidelines) and, where appropriate, its supplements and refinements.” at p. ES-1.]
Tubiello, F. N., et al., (2021). Greenhouse gas emissions from food systems: building the evidence base. Environmental Research Letters, 16(6), 065007. [“Our findings also highlight that conventional IPCC categories, used by countries to report emissions in the National GHG inventory, systematically underestimate the contribution of the food system to total anthropogenic emissions. … Additionally, large amounts of CO2 emissions, which stem from processes at the conversion boundaries between farmland and natural ecosystems, including emissions from tropical deforestation and tropical peatland fires (Prosperi et al 2020), are also excluded from agriculture in National GHG inventory accounting.”]
See, Land Use for Agriculture [Grazing land = ~35% of contiguous U.S. land. Croplands = ~10%.]
Hayek, M. N., et al., (2021). The carbon opportunity cost of animal-sourced food production on land. Nature Sustainability, 4(1), 21-24, p. 21. [“Restoration of native ecosystems, including forests, is a land-based option for atmospheric carbon dioxide (CO2) removal. Ecosystem restoration is constrained largely by land requirements of food production, the largest human use of land globally.”]
Lehner, P. H. & Rosenberg, N. A. (2022). The climate crisis and agriculture. Environmental Law Reporter, 52, 10096, p. 10104 [“Most agricultural land before development was grassland or forest land, which both stored and annually sequestered large amounts of carbon. This lost sequestration capacity of agricultural land is a very real climate impact of agriculture, although one rarely considered.” This report offers an overview of the range of factors that are underestimated or overlooked.]
EPA (2025) Inventory GHG 2023. [Ammonia – “Agriculture continues to drive demand for nitrogen fertilizers, accounting for approximately 88 percent of domestic ammonia consumption.” at p. 4-37. Nitric Acid – “Nitrous oxide (N2O) is emitted during the production of nitric acid (HNO3), an inorganic compound used primarily to make synthetic commercial fertilizers.” at p. 4-46]
Daramola, D. A. & Hatzell, M. C. (2023). Energy demand of nitrogen and phosphorus based fertilizers and approaches to circularity. ACS Energy Letters, 8(3), 1493-1501. [“Ammonia synthesis is widely recognized as an energy intensive process and is currently the fourth largest energy consumer in the chemical manufacturing sector in the United States.” at p. 1493]
Yang, S., et al., (2024). Forage conservation is a neglected nitrous oxide source. PNAS Nexus 3, pgae373, p. 6. [“…the total N2O emission potential amounts to 5.3 MMT CO2 eq. This makes forage conservation the third largest N2O emitter in the agricultural sector, surpassing the field burning of agricultural residues by a factor of 30.”]
Schneider, S. A. (2009). A reconsideration of agricultural law: a call for the law of food, farming, and sustainability. Wm. & Mary Envtl. L. & Pol’y Rev., 34, 935. [Agricultural exceptionalism, “i.e., the use of legal exceptions to protect the agricultural industry, is pervasive. …the concept is evident throughout the law.”]
Ruhl, J.B. (2000) Farms, Their Environmental Harms, and Environmental Law. Ecology Law Quarterly, 27(2), 263, p. 269. [“One would be hard pressed to identify another industry with as poor an environmental record and as light a regulatory burden.”]
Most likely, yes.[1,2] Corn and soybeans, the primary feed crops, use about half the total chemical nitrogen fertilizer applied in the U.S.[3] Nitrogen in chemical fertilizers and the fixation of nitrogen by soybeans and hay are the largest sources of nitrogen on croplands.[4,5] Excess nitrogen stimulates nitrous oxide emissions, the primary greenhouse gas emitted from croplands.[6]
USDA (2022) Greenhouse Gas Inventory 1990-2018, p. 64. [“Emissions are highest from row crops (mostly corn and soybean) because row crops cover the largest land area and nitrogen inputs are often high from fertilization in rows crops, such as corn, and due to biological fixation in legumes that are grown as row crops, such as soybeans.”]
EPA (2025) Inventory GHG 2023, p. 5-36. [“Direct N2O emissions from croplands occur throughout all of the cropland regions but tend to be high in the Midwestern Corn Belt Region (particularly, Illinois, Iowa, Kansas, Minnesota, Nebraska), where a large portion of the land is used for growing highly fertilized corn and nitrogen-fixing soybean crops.”]
See, Chemical Fertilizer Use on Feed Crops
U.S. EPA (2011). Reactive Nitrogen in the United States: An Analysis of Inputs, Flows, Consequences, and Management Options, A Report of the EPA Science Advisory Board, p. 12, Table 1.
EPA Inventory GHG 2023, pp. 5-2 to 5-3. [“Emissions of N2O by agricultural soil management through activities such as fertilizer application and other agricultural practices that increased nitrogen availability in the soil was the largest source of U.S. N2O emissions…”]
USDA Office of the Chief Economist (2022) Greenhouse Gas Inventory 1990-2018, Technical Bulletin No. 1957, p. 59. [“Nitrous oxide emissions from soils are the largest anthropogenic source in the United States because of nitrogen management practices. Large amounts of nitrogen are added to crops from fertilizer amendments and legume cropping, which stimulate N2O production.”]