There are two fundamental differences:
![]() Climate change impacts are global. Other negative externalities of animal ag are either mostly or exclusively regional or national. One ton of CO2 emissions from the U.S. is evenly mixed throughout the earth’s atmosphere in about a year.[1,2] Climate change needs to be understood within a global context.
Climate change impacts are global. Other negative externalities of animal ag are either mostly or exclusively regional or national. One ton of CO2 emissions from the U.S. is evenly mixed throughout the earth’s atmosphere in about a year.[1,2] Climate change needs to be understood within a global context.
![]() The impacts of climate change will persist for more than a thousand years, with some portion of CO2 emissions remaining for hundreds of thousands of years.[3-5] Only the impacts of biodiversity loss will endure for longer periods.
The impacts of climate change will persist for more than a thousand years, with some portion of CO2 emissions remaining for hundreds of thousands of years.[3-5] Only the impacts of biodiversity loss will endure for longer periods.
National Oceanic and Atmospheric Administration (NOAA) Global Monitoring Laboratory, What is the Global Greenhouse Gas Reference Network? [CO2 emissions “from any location mix throughout the atmosphere in about one year.”]
U.S. EPA (2024). Overview of Greenhouse Gases. https://www.epa.gov/ghgemissions/overview-greenhouse-gases [“All these gases remain in the atmosphere long enough to become well mixed, meaning that the amount that is measured in the atmosphere is roughly the same all over the world, regardless of the source of the emissions.”]
EPA (2025). Inventory of U.S. Greenhouse Gas Emissions and Sinks: 1990-2023, EPA 430-R-25-003, p. 1-10. [Hereafter “EPA (2025) Inventory GHG. 2023”] [“For a given amount of CO2 emitted, some fraction of the atmospheric increase in concentration is quickly absorbed by the oceans and terrestrial vegetation, some fraction of the atmospheric increase will only slowly decrease over a number of years, and a small portion of the increase will remain for many centuries or more.”]
IPCC (2013) Climate Change 2013: The Physical Science Basis. Contribution of Working Group I to the Fifth Assessment Report of the Intergovernmental Panel on Climate Change. Stocker, T.F., et al., (eds.). Cambridge University Press, Cambridge, United Kingdom and New York, NY, USA, Chapter 6, Box 6.1, pp. 472-473. [The removal of some portions of CO2 are completed “within several hundred thousand years…”]
NOAA Research (May 23, 2023) NOAA index tracks how greenhouse gas pollution amplified global warming in 2022. [“A substantial fraction of CO2 emitted today will persist in the atmosphere for more than 1,000 years.”]
Yes. Given the size of the threat, incentives to reduce GHG emissions are relatively weak. This is due to the globally diluted impacts, the invisibility of the gases, and their slowly compounding impacts. According to some researchers and philosophers, these factors heighten the role of morality in effective reduction strategies.[1-3]
GHG emissions can be viewed as a prime example of the “tragedy of the commons,” where the common resource is the earth’s air quality and climate.[4] Given that a global effort is required, new paradigms may be needed to incentivize behavioral changes.[5,6]
Reckoning with U.S. current and cumulative contributions adds another dimension to the moral aspects of the issue, especially when “vulnerable communities who have historically contributed the least to current climate change are disproportionately affected.”[7]
Peeters, W., et al., (2019). Moral disengagement and the motivational gap in climate change. Ethical Theory and Moral Practice, 22, 425-447.
Hourdequin, M. (2010). Climate, collective action and individual ethical obligations. Environmental Values, 19(4), 443-464.
Baatz, C. (2014). Climate change and individual duties to reduce GHG emissions. Ethics, Policy & Environment, 17(1), 1-19.
Andrew Barkley & Paul W. Barkley (2013). Principles of Agricultural Economics, Routledge, Taylor & Francis Group, London & New York, p. 331. [A concept known as the tragedy of the commons is “a situation in which a group of individuals, acting rationally and in their own self-interest, deplete a shared limited resource, resulting in destruction of the resource and a negative outcome for all parties.”]
Brown, K., et al., (2018). Moving climate change beyond the tragedy of the commons. Global Environmental Change 54, 61-63.
Walter Robinson (2024). Climate change and the “tragedy of the commons.” NC State University, Climate Change & Society at NC State University. [An optimistic view that unlike most tragedies of the commons, where resources unused by one party will simply be used by another party, reducing emissions of heat trapping gases will either have no effect on other party’s emissions, or more likely, will encourage restraint from them as well.]
Climate Change 2023: Synthesis Report (2023) Contribution of Working Groups I, II and III to the Sixth Assessment Report of the Intergovernmental Panel on Climate Change [Core Writing Team, H. Lee and J. Romero (eds.)]. IPCC, Geneva, Switzerland, p. 42.
In 2024, the U.S was responsible for the 2nd largest share at ~11% of global GHG emissions.[1] China contributes by far the largest share at ~29% of the total.
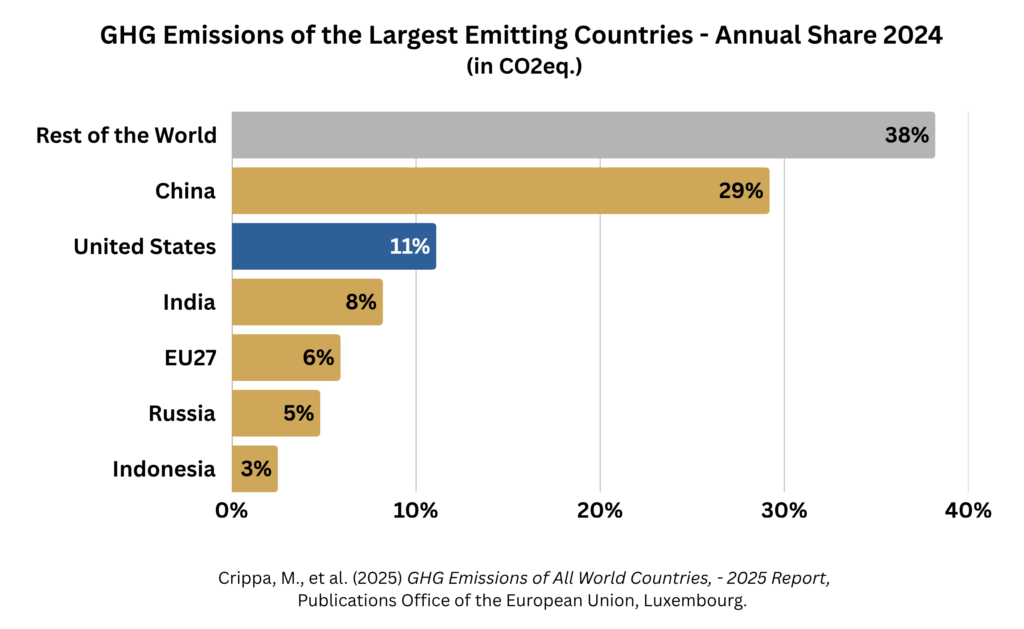
Crippa, M., et al., (2025). GHG emissions of all world countries, Publications Office of the European Union, Luxembourg. p. 10, Figure 1.
U.S. per capita emissions in 2024 were ~2.6 times the world average, the fifth highest.[1] Although China’s total GHG emissions were much greater than that of the U.S., their per capita emissions are ~62% of U.S. per capita emissions.[2]
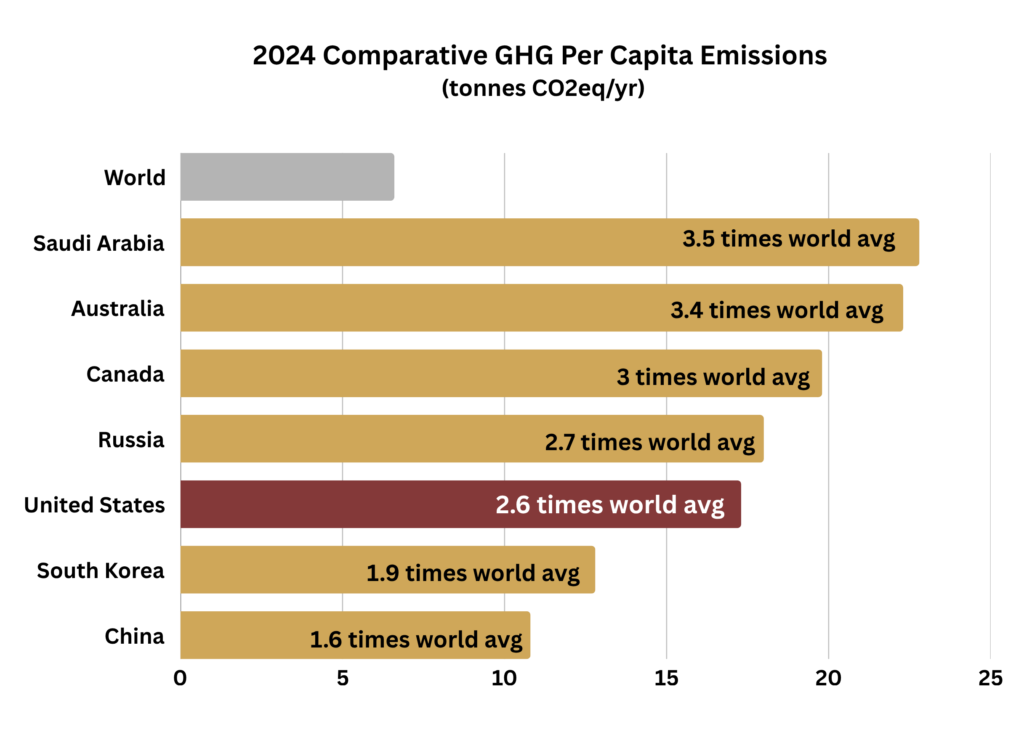
Crippa, M., et al., (2025). GHG emissions of all world countries, Publications Office of the European Union, Luxembourg, p. 11, Table 1. [U.S. = 17.344 MMT CO2 eq. / 6.562 = 2.64 times. Only countries accounting for over 1% of global GHG emissions are included in the comparison and on the chart.]
Crippa, M. et al., (2025), GHG emissions by country: China p. 109, U.S. p. 268. [China = 10.812 / 17.344 = 62.3%]
The historical (cumulative) contributions of the U.S. are the largest of any country.[1,2]
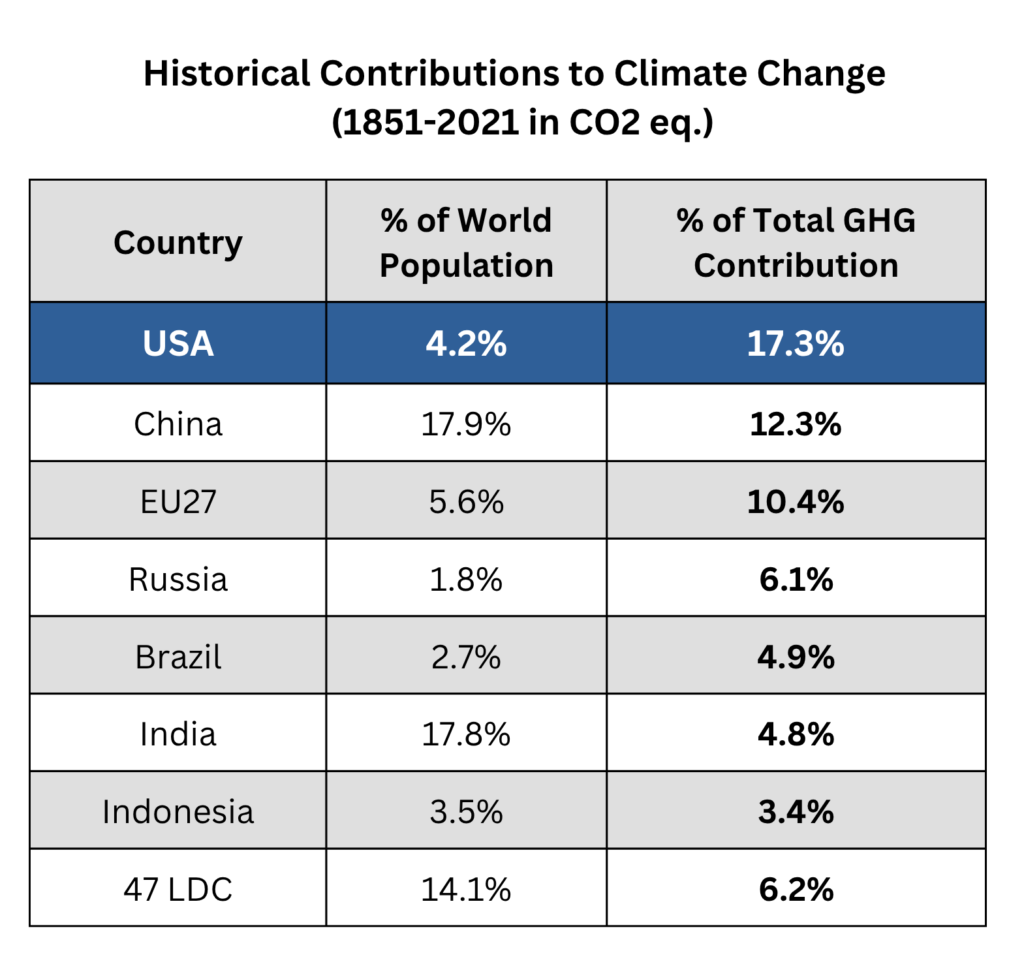
Jones, M. W., et al., (2023). National contributions to climate change due to historical emissions of carbon dioxide, methane, and nitrous oxide since 1850. Scientific Data, 10(1), 155, p. 19.
Population figures estimated for 2022: World 7,975.1M; China 1,425.9M; India 1,417.2M; 47 LDC 1,124.4M; EU27 446.8M; USA 338.3M; Indonesia 275.5M; Brazil 215.3M; Russia 144.7M. Figures from A) United Nations Statistical Yearbook, 66th issue (2023), Chapter 2, Population, surface area and density. B) Eurostat, Demography of Europe 2023 edition. C) The World Bank, Population, total – Least developed countries: UN classification. [Lists 45 LDC countries for 2022. Presumably 2 countries transitioned out of this designation.]
Broadly estimated, on a per capita basis, U.S. historical (cumulative) contributions are ~4 times the world average.[1-3]
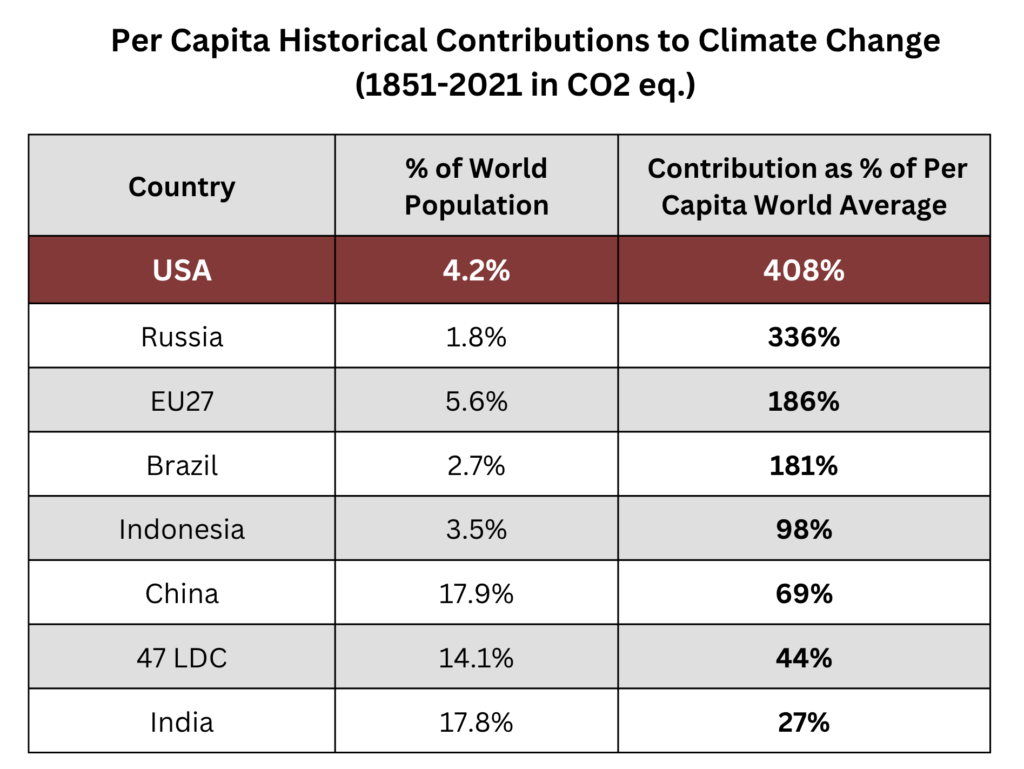
The historical contributions of a group of 47 countries classified by the UN as “least developed” were less than half the world average on a per capita basis. Many of those countries are among the most vulnerable to the impacts of climate change.[4]
Jones, M. W., et al., (2023). National contributions to climate change due to historical emissions of carbon dioxide, methane, and nitrous oxide since 1850. Scientific Data, 10(1), 155, p. 19.
Note: the “Country Contribution as % of Per Capita World Average“ is a broad estimate of historical global warming responsibility by country, taking into account comparative population figures. It is based on population levels in 2022 and is therefore inaccurate to the degree that relative population levels have changed over time. Also, it does not account for emissions embedded in international trade. Nonetheless, it can give a rough estimate of which countries bear the most and least responsibilities to date.
Population figures estimated for 2022: World 7,975.1M; China 1,425.9M; India 1,417.2M; 47 LDC 1,124.4M; EU27 446.8M; USA 338.3M; Indonesia 275.5M; Brazil 215.3M; Russia 144.7M. Figures from A) United Nations Statistical Yearbook, 66th issue (2023), Chapter 2, Population, surface area and density. B) Eurostat, Demography of Europe 2023 edition. C) The World Bank, Population, total – Least developed countries: UN classification. [Lists 45 LDC countries for 2022. Presumably 2 countries transitioned out of this designation]
IPCC (2023). Summary for Policymakers. In: Climate Change 2023: Synthesis Report. Contribution of Working Groups I, II and III to the Sixth Assessment Report of the Intergovernmental Panel on Climate Change, IPCC, Geneva, Switzerland. [“Vulnerable communities who have historically contributed the least to current climate change are disproportionately affected.” at p. 5]