There are 3 possible answers according to EPA data:
9.6% – This is for direct on-the-farm (and factory farm) emissions and does not include on-the-farm fossil fuel and electric use.[1]
10.5% – This is for direct on-the-farm emissions plus on-the-farm fossil fuel and electric use.[2]
11.0% – This is for direct on-the-farm emissions, plus on-the-farm fossil fuel and electric use, plus that share of off-the-farm electric production that supports on-the-farm electric use.[3]
For GHG emissions for the entire “food system” or “food supply chain,” the figure rises to about 15-18%. (See later question on this page.)
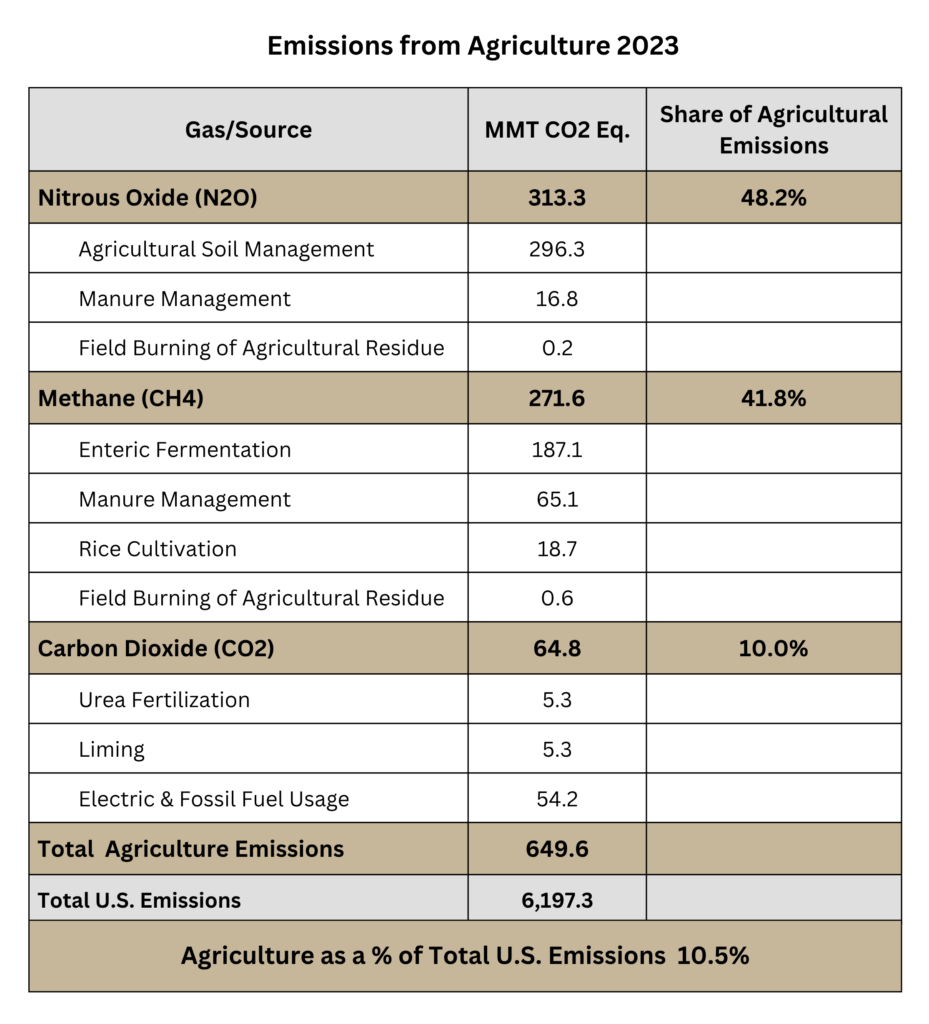
EPA (2025). Inventory of U.S. Greenhouse Gas Emissions and Sinks: 1990-2023, EPA 430-R-25-003, Figure 5-1, p. 5-2. (Hereafter: “EPA (2025) Inventory GHG 2023”) [“In 2023, the Agriculture sector was responsible for emissions of 595.4 MMT CO2 eq., or 9.61% of total U.S. greenhouse gas emissions.” Out of a total of 6,197.3 MMT. For the 9.6%, the EPA Includes the following 7 categories: “agricultural soil management, enteric fermentation from domestic livestock production, livestock manure management, rice cultivation, urea fertilization, liming, and field burning of agricultural residues.”]
EPA (2025). Inventory GHG 2023. [“Activities related to agriculture accounted for 10.5 percent of emissions…” 649.6 MMT CO2 eq., = 10.48% of a total 6,197.3 MMT. “The agriculture economic sector includes emissions from fossil fuel combustion and electricity use within the agriculture sector…”]
EPA (2025). Inventory GHG 2023. [681.5 MMT CO2 eq., or 11.00% of out of a total of 6,197.3 MMT. [This additional electric allocation (31.9 MMT) includes all aspects of national electric production (including losses) that support all electricity usage proportionally allocated based on total on-farm usage.]
We suggest that total U.S. agricultural emissions as a share of total U.S. GHG emissions can safely be referred to as either “about 10%” or “a little more than 10%.” It would also be accurate to say “10.5%” or “11%”.
Of the 3 figures quoted by the EPA, other federal agencies generally use:![]() On-farm emissions including fossil fuels and electricity, i.e., 10.5% in 2023.[1-3] Or sometimes:
On-farm emissions including fossil fuels and electricity, i.e., 10.5% in 2023.[1-3] Or sometimes: ![]() On-farm emissions including fossil fuels and electricity, plus off-the-farm electric support, i.e., 11.0% in 2023.[4,5]
On-farm emissions including fossil fuels and electricity, plus off-the-farm electric support, i.e., 11.0% in 2023.[4,5]
We use the middle figure of 10.5% in subsequent calculations.
Congressional Research Service (Oct, 2022). Greenhouse Gas Emissions and Sinks in U.S. Agriculture, p. 1 & Figure 1. [Includes fuel consumption and on-farm electricity use. 635.1 MMTCO2e in 2020 matches the “economic sector” figure from the EPA for that year, i.e., the same as the 10.5% figure for 2023.]
Congressional Budget Office (August 2025). Emissions of Greenhouse Gases in the Agriculture Sector, p. 5. [Assesses the total including on-farm fossil fuel usage. “The use of fossil fuels to power agricultural machinery and facilities accounted for the remaining 8 percent of emissions.” Their figure of 647MMT CO2eq aligns closely with the latest EPA report at 649.6, representing the “economic sector” and including fuel consumption and on-farm electricity use.]
Office of Energy and Environmental Policy (January 2022). U.S. Agriculture and Forestry Greenhouse Gas Inventory 1990 – 2018, Technical Bulletin Number 1957, p. 5. [In this report, the USDA uses the middle category, adding their own evaluations of on-farm energy use, and not including indirect electric emissions. “Agriculture, defined as CH4, N2O, and CO2 emissions from cropped and grazed soils as well as on-farm energy use, accounted for approximately 10 percent of total U.S. emissions (677 MMT CO2 eq.).”]
USDA ERS (November 2024). Agriculture accounted for an estimated 10.5 percent of U.S. greenhouse gas emissions in 2022, Charts of Note. [“Farming activities in the United States accounted for 10.5 percent of U.S. greenhouse gas emissions in 2022.” This figure for 2022 includes on-farm fossil fuel and electric use, as well as that share of off-the-farm electric production that supports on-the-farm electric use. This “Chart of Note” has been produced using this protocol for many years, although it was not generated in 2025.]
USDA ERS (February 2024). Agriculture accounted for an estimated 10.6 percent of U.S. greenhouse gas emissions in 2021, Charts of Note. [Again aligns with the broader category that includes on-farm fossil fuel and electric use, as well as that share of off-the-farm electric production that supports on-the-farm electric use.]
Total U.S. agricultural emissions were responsible for slightly more than 1% of global GHG emissions in 2023.[1-3]
EPA (2025). Inventory GHG 2023, Figure 5-1, Table ES-5, and Table ES-6. [For 2023, considering 3 totals, as noted in the first question: 595.4 MMT CO2 eq., 649.6 MMT CO2 eq., and 681.5 MMT CO2 eq.]
Crippa, M., et al., (2025). GHG emissions of all world countries, Publications Office of the European Union, Luxembourg. p. 49 [Total global GHG emissions in 2023 = 52,962.9 MMT CO2 eq.]
Calculation: 595.4 MMT / 52,962.9 = 1.23% of global emissions; 649.6 MMT / 52,962.9 = 1.27% of global emissions, 681.5 MMT / 52,962.9 = 1.29% of global emissions.
The 3 largest drivers of U.S. agricultural emissions are:[1]
![]() Nitrous oxide (N2O) from soil management – mostly from chemical fertilizers and manure applied to or deposited on cropland and grazing land.[2,3]
Nitrous oxide (N2O) from soil management – mostly from chemical fertilizers and manure applied to or deposited on cropland and grazing land.[2,3]![]() Methane (CH4) from enteric fermentation, the digestive fermentation process of ruminants – mostly from beef and dairy cattle.[4]
Methane (CH4) from enteric fermentation, the digestive fermentation process of ruminants – mostly from beef and dairy cattle.[4]![]() Methane and nitrous oxide (CH4 and N2O) from the storage and handling of manure – mostly from dairy cattle, pig, and beef cattle operations.[5,6]
Methane and nitrous oxide (CH4 and N2O) from the storage and handling of manure – mostly from dairy cattle, pig, and beef cattle operations.[5,6]
Carbon dioxide (CO2) from on-farm energy use is responsible for about 8% of agriculture’s emissions.[7]
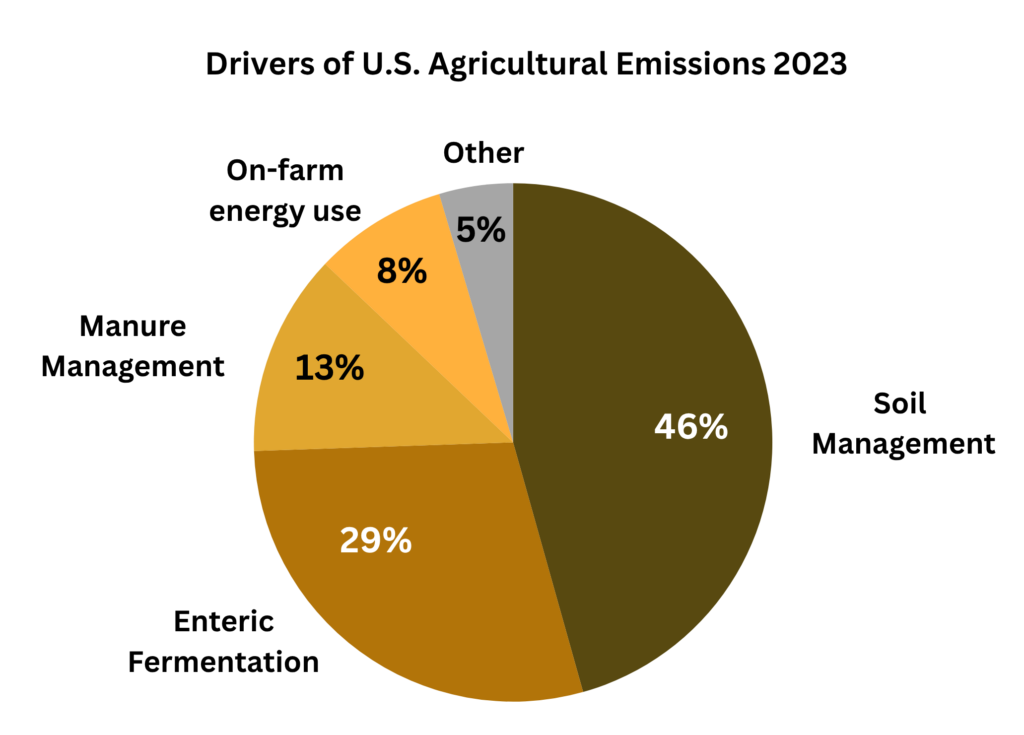
EPA (2025). Inventory GHG 2023, Table 5-1. [Soil management = 296.3 million metric tonnes CO2 eq. / 649.6 = 45.6%. Enteric fermentation = 187.1 / 649.6 = 28.8%. Manure management = 81.9 / 649.6 = 12.6%. On-farm energy use = 54.2 / 649.6 = 8.3%. Other = 30.1 / 649.6 = 4.6%.]
Shcherbak, I., et al. (2014). Global meta-analysis of the nonlinear response of soil nitrous oxide (N2O) emissions to fertilizer nitrogen. PNAS, 111(25), 9199-9204, p. 9199. [N2O emissions from agricultural soils are “primarily as a result of the addition of synthetic nitrogen (N) fertilizers and animal manure to soil.”]
EPA (2025). Inventory GHG 2023, p. ES-19 and p. 534. [“Agricultural soil management activities, such as application of synthetic and organic fertilizers, deposition of livestock manure, and growing N-fixing plants, were the largest contributor to U.S. N2O emissions in 2023…”]
EPA (2025). Inventory GHG 2023, pp. 5-5 and 5-6 and Table 5-3. [“Beef cattle remain the largest contributor of CH4 emissions from enteric fermentation, accounting for 70 percent in 2023. Emissions from dairy cattle in 2023 accounted for 26 percent.”]
EPA (2025). Inventory GHG 2023, Table 5-7. [In 2023, 48% of manure management emissions were attributed to dairy cattle operations, 30% to pig operations, and 13% to beef cattle operations.]
Note: Methane is the larger component, making up about 80% of GHG emissions from manure management. This methane is created by factory farm manure handling systems. See, EPA (2025). Inventory GHG 2023, p. 5-14. [“When manure is handled as a solid (e.g., in stacks or drylots) or deposited on pasture, range, or paddock lands, it tends to decompose aerobically and produce CO2 and little or no CH4.”] For further info, see, Manure Biogas Contradictions
EPA (2025). Inventory GHG 2023. [See the difference between Tables ES-5 and ES-3 on pp. ES-24 and ES-22 = 649.6 – 595.4 = 54.2 MMT CO2 eq. for on-farm energy use.]
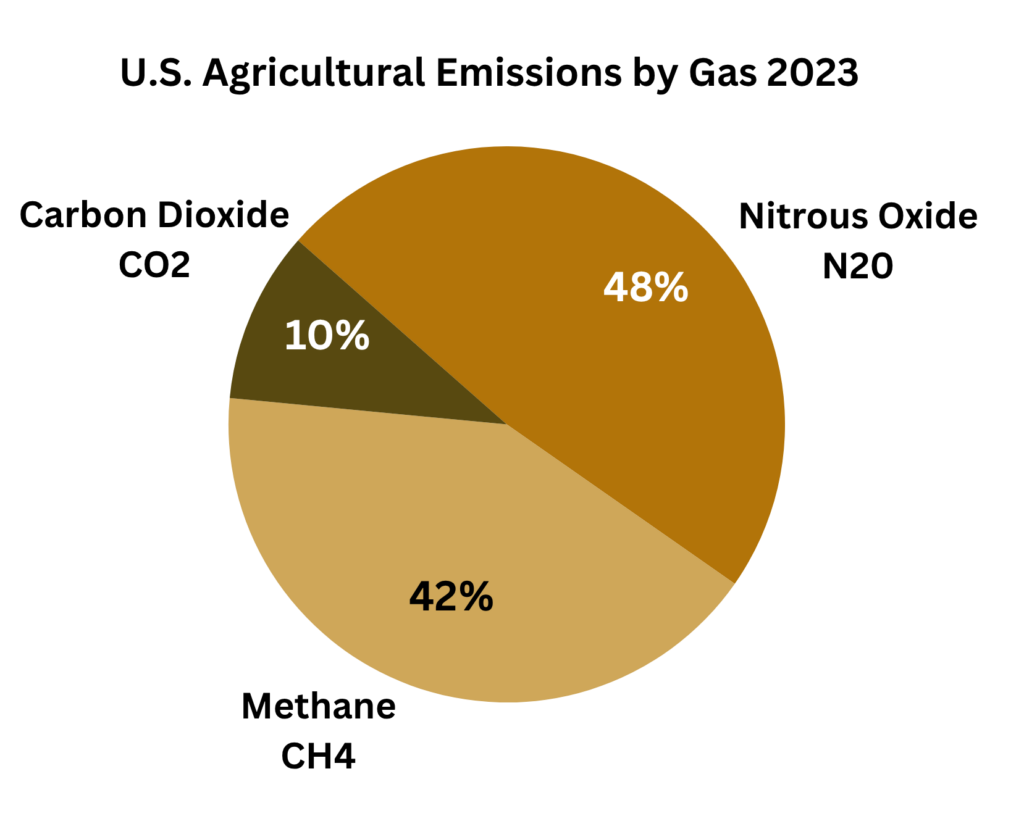
Nitrous oxide (N2O) – The largest share (48%) of agricultural emissions is nitrous oxide, which mostly comes from chemical fertilizers and manure applied to or deposited on cropland and grazing land, and from the crop fixation of nitrogen.[1,2]
Methane (CH4) – About 42% of agricultural emissions is methane, which mostly comes from livestock enteric fermentation and manure management methods on factory farms.[3,4]
Carbon Dioxide (CO2) – About 10% of agricultural emissions is carbon dioxide mostly from fossil fuel and electric usage, with small shares from chemical fertilizers.[5,6]
EPA (2025). Inventory GHG 2023, Table 5-1. [N2O = 313.3 MMT CO2eq. / total agricultural emissions = 649.6 MMT CO2 eq.== 48.2%.
EPA (2025). Inventory GHG 2023, p. ES-19 and p. 5-34. [“Agricultural soil management activities, such as application of synthetic and organic fertilizers, deposition of livestock manure, and growing N-fixing plants, were the largest contributor to U.S. N2O emissions in 2023…”]
EPA (2025). Inventory GHG 2023, Table 5-1. [Enteric Fermentation = 187.1 MMT CO2 eq. + Manure Management = 65.1 MMT CO2eq. + Rice cultivation = 18.7 MMT CO2 eq. + field burning of agricultural residue = 0.6 MMT CO2 eq. == 271.6 MMT CO2 eq. of total methane / total agricultural emissions of 649.6 MMT CO2 eq.== 41.8%]
EPA (2025). Inventory GHG 2023. [“This microbial fermentation process, referred to as enteric fermentation, produces CH4 as a byproduct, which can be exhaled or eructated by the animal.” at p. 5-5. “When livestock manure is stored or treated in systems that promote anaerobic conditions (e.g., as a liquid/slurry in lagoons, ponds, tanks, or pits), the decomposition of the volatile solids component in the manure tends to produce CH4.” at p. 5-14]
EPA (2025). Inventory GHG 2023. [The difference between Tables ES-5 and ES-3 on pp. ES-24 and ES-22 = 649.6 – 595.4 = 54.2 MMT CO2 eq = on-farm energy as CO2]
EPA (2025). Inventory GHG 2023. [See Table 5-1 on p. 5-3 for small CO2 shares from Liming and Urea Fertilization.]
EPA (2025). Inventory GHG 2023, Table 5-1 on p. 5-3 and Table ES-5 on p. ES-22.
Global warming potential (GWP) is a multiplier developed by the IPCC and followed by the EPA. It is used to compare the relative impact of different greenhouse gases by converting emissions into CO2 equivalents. Different gases have different effects on the Earth’s warming in two ways: the ability to absorb energy (capacity to trap and radiate heat downwards) and the length of time the gases stay in the atmosphere. GWP accounts for both aspects.[1,2]
Carbon dioxide (CO2) – is used as a reference and has a GWP factor of 1. CO2 remains in the climate system for more than a thousand years, with some portions remaining for hundreds of thousands of years.[3,4]
Methane (CH4) – The EPA calculates its lifetime in the atmosphere at 12 years, with a GWP factor of 28 over a 100-year period.[5,6]
Nitrous Oxide (N2O) – The EPA calculates its lifetime in the atmosphere at 114 years, with a GWP factor of 265 over a 100-year period.[7,8]
EPA (2025). Inventory GHG 2023, p. ES-2. [“The IPCC developed the global warming potential (GWP) concept to compare the ability of a greenhouse gas to trap heat in the atmosphere relative to another gas. A GWP is a quantified measure of the warming impact of a unit of a specific greenhouse gas over a specific period of time relative to the same unit of CO2.”]
EPA (2025) Inventory GHG 2023, p. 1-9. [“A global warming potential (GWP) is a quantified measure of the relative globally averaged radiative forcing impacts of emissions of a particular greenhouse gas over time (see Table 1-2). It is defined as the accumulated radiative forcing within a specific time horizon caused by emitting 1 kilogram (kg) of the gas, relative to that of the reference gas CO2 (IPCC 2021).”]
EPA (2025). Inventory GHG 2023. [“For a given amount of CO2 emitted, some fraction of the atmospheric increase in concentration is quickly absorbed by the oceans and terrestrial vegetation, some fraction of the atmospheric increase will only slowly decrease over a number of years, and a small portion of the increase will remain for many centuries or more.”]
IPCC (2013). Climate Change 2013: The Physical Science Basis. Contribution of Working Group I to the Fifth Assessment Report of the Intergovernmental Panel on Climate Change. Stocker, T.F., et al., (eds.). Cambridge University Press, Cambridge, United Kingdom and New York, NY, USA, Chapter 6, Box 6.1, pp. 472-473. [The removal of some portions of CO2 are completed “within several hundred thousand years…”]
EPA (2025). Inventory GHG 2023, Table ES-1 for “Global Warming Potentials (100-Year Time Horizon) Used in this Report.”
U.S. EPA Methane Emissions (updated March, 2026) https://www.epa.gov/ghgemissions/methane-emissions
EPA (2025). Inventory GHG 2023, Table ES-1.
U.S. EPA Nitrous Oxide Emissions (updated March, 2026) https://www.epa.gov/ghgemissions/nitrous-oxide-emissions
The EPA reports GHG emissions in carbon dioxide equivalents, or “CO2 eq.” This is a unit of measurement applied to greenhouse gases other than CO2 that equalizes the global warming potential (GWP), assigning multipliers to gases like methane and nitrous oxide which pound-for-pound have much higher impacts.[1] This protocol follows guidelines set by the Intergovernmental Panel on Climate Change (IPCC).[2]
The U.S. has pulled out of the Paris Agreement as well as the United Nations Framework Convention on Climate Change (UNFCCC), throwing into question the timing and protocols of future assessments and inventory reports.[3,4]
EPA (2025). Inventory GHG 2023, p. ES-2. [“A GWP is a quantified measure of the warming impact of a unit of a specific greenhouse gas over a specific period of time relative to the same unit of CO2. The GWP of a greenhouse gas is defined as the ratio of the accumulated radiative forcing within a specific time horizon caused by emitting 1 kilogram of the gas, relative to that of the reference gas CO2; therefore, CO2-equivalent emissions are provided in million metric tons of CO2 equivalent (MMT CO2 Eq.) for non-CO2 greenhouse gases.”]
EPA (2025). Inventory GHG 2023, p. ES-1. [“Throughout this report, emission and sink estimates are grouped into five reporting sectors… and are calculated using methods that are consistent with the 2006 Intergovernmental Panel on Climate Change (IPCC) Guidelines for National Greenhouse Gas Inventories (2006 IPCC Guidelines) and, where appropriate, its supplements and refinements.”]
Lisa Friedman (January 27, 2026). America Officially Leaves the Paris Climate Agreement. For the Second Time, The New York Times. https://www.nytimes.com/2026/01/27/climate/paris-climate-agreement-withdrawal.html
Somini Sengupta (January 7, 2026). What Is the UNFCCC and Why Is the U.S. Pulling Out? The New York Times. https://www.nytimes.com/2026/01/07/climate/what-is-unfccc-climate-treaty.html
Based on research reports, a reasonable estimate is that about 15 – 18% of total U.S. GHG emissions is attributable to the entire food system (or food supply chain), including animal slaughter, food manufacturing and distribution, retail, food service, and restaurants.[1-4]
Hitaj, C., et al., (2019). Greenhouse gas emissions in the United States food system: current and healthy diet scenarios. Environmental Science & Technology, 53(9), 5493-5503, p. 5497. [“Current consumption patterns (baseline diet) in the United States contribute 985 million tons of CO2eq to GHGE: 15% of total US emissions in 2017 or 13% in 2007. We include emissions from farm production through points of consumer purchase, including food service (restaurants)…”]
Patrick Canning, et al., (May 2020). Resource Requirements of Food Demand in the United States, USDA ERS, Rpt No. 273, p. 12. [The U.S. food system used “18.1 percent of the roughly 7.4 billion metric tons of annual greenhouse gas (GHG) emissions… from farm production through processing, packaging, distribution, marketing, and final food preparation and cleanup—both in home kitchens and at foodservice establishments.”]
Armstrong, K., et al., (2025). Estimating energy consumption and GHG emissions in the US food supply chain for net-zero. npj Science of Food, 9(1), 19, p. 3. [“According to the model created for this study, the entire U.S. food supply chain … originated 970 MMT CO2e … of GHG emissions in 2016.” Total emissions in 2016 according to EPA were 6,511.3. Therefore, 970 / 6511 = 14.9%.]
Boehm, R., et al., (2018). A comprehensive life cycle assessment of greenhouse gas emissions from US household food choices. Food Policy, 79, 67-76, p. 4. [“In total U.S. households generated 899 billion kg CO2e from food spending in 2013. This represents 16.3% of total U.S. GHGEs in the same year. Agricultural production and manufacturing account for 67.9% of average weekly household GHGEs from food spending. The restaurant and retail sectors combined accounted for 25.4% of GHGEs from household food spending, followed by truck transportation (4.7%) and wholesale trade (1.5%).”]
Large uncertainties and potential underestimates of emissions from U.S. agriculture are due to the outsized influence of methane and nitrous oxide, the difficulties in assigning precise impacts to those gases, the vast territory over which those widely varying impacts unfold, the uncountable and unmonitored sources, and the climate-changing legacies from centuries of agricultural land transformation.[1] In more detail:
![]() Uncertainty regarding equivalencies – Because 90% of U.S. agricultural emissions are made up of gases other than CO2 (methane and nitrous oxide) with high potency, the methodologies for determining equivalencies take on extra importance, especially given their inherent uncertainties.[2]
Uncertainty regarding equivalencies – Because 90% of U.S. agricultural emissions are made up of gases other than CO2 (methane and nitrous oxide) with high potency, the methodologies for determining equivalencies take on extra importance, especially given their inherent uncertainties.[2]
![]() Underestimated quantities – Some researchers suggest that methane and nitrous oxide are methodically underestimated.[3,4] Assessing myriad non-point sources across the country presents unique challenges.[5,6]
Underestimated quantities – Some researchers suggest that methane and nitrous oxide are methodically underestimated.[3,4] Assessing myriad non-point sources across the country presents unique challenges.[5,6]
![]() Land use changes – Because of IPCC protocols, the EPA does not consider agricultural land use changes under agriculture.[7,8] Agriculture uses ~45% of U.S. contiguous land, so the protocols involving land uses and land transformations have large impacts on agricultural estimates.[9]
Land use changes – Because of IPCC protocols, the EPA does not consider agricultural land use changes under agriculture.[7,8] Agriculture uses ~45% of U.S. contiguous land, so the protocols involving land uses and land transformations have large impacts on agricultural estimates.[9]
![]() Land use legacies – Most assessments consider current agricultural land use areas as a baseline, rather than considering the opportunity costs of ongoing land usage decisions and the GHG reductions that could be gained from converting crop and grazing land back to natural environments that could store more carbon.[10,11]
Land use legacies – Most assessments consider current agricultural land use areas as a baseline, rather than considering the opportunity costs of ongoing land usage decisions and the GHG reductions that could be gained from converting crop and grazing land back to natural environments that could store more carbon.[10,11]
![]() Overlooked inputs and processes – Some inputs to agricultural production are counted in other categories, such as the energy use of fertilizer production.[12,13] Because of the wide range of agricultural activities, particular emission-generating processes are sometimes found to be underestimated or overlooked.[14]
Overlooked inputs and processes – Some inputs to agricultural production are counted in other categories, such as the energy use of fertilizer production.[12,13] Because of the wide range of agricultural activities, particular emission-generating processes are sometimes found to be underestimated or overlooked.[14]
![]() Agricultural exceptionalism – Underestimates may also reflect a cultural bias that tends to protect agricultural interests from environmental constraints.[15,16]
Agricultural exceptionalism – Underestimates may also reflect a cultural bias that tends to protect agricultural interests from environmental constraints.[15,16]
Lehner, P. H. & Rosenberg, N. A. (2022). The climate crisis and agriculture. Environmental Law Reporter, 52, 10096, p. 10104. [This report explores many of these factors.]
Lynch, J., et al., (2021). Agriculture’s contribution to climate change and role in mitigation is distinct from predominantly fossil CO2-emitting sectors. Frontiers in sustainable food systems, 4, 518039, p. 7. [“There is no satisfactory means by which a single pulse-emissions-based weighting can be used to describe a physical “equivalence” between gases, so our common reporting measure of GWP100 CO2e, which is built on this approach, cannot provide clear climatic inference.”]
Hayek, M. N. & Miller, S. M. (2021). Underestimates of methane from intensively raised animals could undermine goals of sustainable development. Environmental Research Letters, 16(6), 063006, p. 5. [“The difference is much greater in the United States; at least four top-down estimates of the contiguous US, representative of emissions occurring over at least one full year, indicate that direct animal methane emissions are 39%–90% higher than bottom-up models predict.”]
Del Grosso, S. J. et al., (2022). A gap in nitrous oxide emission reporting complicates long-term climate mitigation. PNAS, 119(31), e2200354119, Abstract [“We show that both atmospheric inversions and newly implemented bottom-up modeling approaches exhibit large N2O pulses in the north central region of the United States during early spring and this increases annual N2O emissions from croplands and grasslands reported in the national GHG inventory by 6 to 16%.”]
The Greenhouse Gas Monitoring & Measurement Interagency Working Group (2023). Federal Strategy to Advance Greenhouse Gas Emissions Measurement and Monitoring for the Agriculture and Forest Sectors, p. 3 & p. 5. [“Many of the source and sink categories within the agriculture and forest sectors are complex and heterogeneous, making GHG quantification challenging. … Monitoring and reporting land use and land conversions requires sustained observation networks that are maintained over time…”]
Lawrence, N. C., et al., (2021). Nitrous oxide emissions from agricultural soils challenge climate sustainability in the US Corn Belt. PNAS, 118(46), e2112108118, p. 1. [“Despite decades of measurements, the sources and magnitudes of agricultural N2O emissions remain difficult to estimate.”]
EPA (2025) Inventory GHG 2023, see Table ES-4, p. ES-20. [“Throughout this report, emission and sink estimates are grouped into five reporting sectors… and are calculated using methods that are consistent with the 2006 Intergovernmental Panel on Climate Change (IPCC) Guidelines for National Greenhouse Gas Inventories (2006 IPCC Guidelines) and, where appropriate, its supplements and refinements.” at p. ES-1]
Tubiello, F. N., et al., (2021). Greenhouse gas emissions from food systems: building the evidence base. Environmental Research Letters, 16(6), 065007. [“Our findings also highlight that conventional IPCC categories, used by countries to report emissions in the National GHG inventory, systematically underestimate the contribution of the food system to total anthropogenic emissions. … Additionally, large amounts of CO2 emissions, which stem from processes at the conversion boundaries between farmland and natural ecosystems, including emissions from tropical deforestation and tropical peatland fires (Prosperi et al. 2020), are also excluded from agriculture in National GHG inventory accounting.”]
See, Land Use for Agriculture [Grazing land = ~35% of contiguous U.S. land. Croplands = ~10%.]
Hayek, M. N., et al., (2021). The carbon opportunity cost of animal-sourced food production on land. Nature Sustainability, 4(1), 21-24, p. 21. [“Restoration of native ecosystems, including forests, is a land-based option for atmospheric carbon dioxide (CO2) removal. Ecosystem restoration is constrained largely by land requirements of food production, the largest human use of land globally.”]
Lehner, P. H. & Rosenberg, N. A. (2022), p. 10104. [“Most agricultural land before development was grassland or forest land, which both stored and annually sequestered large amounts of carbon. This lost sequestration capacity of agricultural land is a very real climate impact of agriculture, although one rarely considered.”]
EPA (2025) Inventory GHG 2023. [Ammonia – “Agriculture continues to drive demand for nitrogen fertilizers, accounting for approximately 88 percent of domestic ammonia consumption.” at p. 4-37. Nitric Acid – “Nitrous oxide (N2O) is emitted during the production of nitric acid (HNO3), an inorganic compound used primarily to make synthetic commercial fertilizers.” at p. 4-46]
Daramola, D. A. & Hatzell, M. C. (2023). Energy demand of nitrogen and phosphorus based fertilizers and approaches to circularity. ACS Energy Letters, 8(3), 1493-1501. [“Ammonia synthesis is widely recognized as an energy intensive process and is currently the fourth largest energy consumer in the chemical manufacturing sector in the United States.” at p. 1493]
Yang, S., et al., (2024) Forage conservation is a neglected nitrous oxide source. PNAS Nexus 3, pgae373, p. 6. [“…the total N2O emission potential amounts to 5.3 MMT CO2 eq. This makes forage conservation the third largest N2O emitter in the agricultural sector, surpassing the field burning of agricultural residues by a factor of 30.”]
Schneider, S. A. (2009). A reconsideration of agricultural law: a call for the law of food, farming, and sustainability. Wm. & Mary Envtl. L. & Pol’y Rev., 34, 935. [Agricultural exceptionalism, “i.e., the use of legal exceptions to protect the agricultural industry, is pervasive. …the concept is evident throughout the law.”]
Ruhl, J. B. (2000). Farms, Their Environmental Harms, and Environmental Law. Ecology Law Quarterly, 27(2), 263, p. 269. [“One would be hard pressed to identify another industry with as poor an environmental record and as light a regulatory burden.”]