1. The share of crops specifically used for animal feed accounts for ~38% of total U.S. water consumption.
2. Including both feed crops and the direct water usage on factory farms (~2%), animal agriculture accounts for ~40% of total U.S. water consumption.
3. Broadly estimated, other food production accounts for ~30% of all water consumption and all other water uses total ~30%.
4. The 3 primary feed crops account for ~45% of all water consumption – alfalfa/hay at 23%, corn at 15%, and soybeans at 7%.
5. More than two-thirds of the water withdrawn to irrigate the 3 primary feed crops (alfalfa/hay, corn, and soybeans) comes from groundwater.
Broadly estimated, the portion of crops specifically used for animal feed accounts for about 38% of total U.S. water consumption.[1-3]
This is a broad estimate based on 3 reports from experienced water researchers and applying our estimates of the share of crops specifically used for animal feed. See, https://docs.google.com/spreadsheets/d/19XsKhVFbOiyB01Kyz_WVVBdFBa_Pd1JsCISscE7tr08/edit?gid=0#gid=0
For estimates of the shares of crops specifically used for animal feed, see, Total Feed Crops Share
For estimate that all crops use ~78% of total U.S. water consumption, see, Agricultural Water UsageNote: this is likely a conservative estimate because it does not count many additional shares of crops used as feed that are not included in these calculations. See, Total Feed Crops Share [question: Why are these percentages underestimated?]
Broadly estimated, animal agriculture – including feed crops and direct water usage on factory farms – accounts for ~40% of total U.S. water consumption.[1-4]
That portion of crops specifically used for animal feed accounts for ~38%. Direct water usage for livestock accounts for ~2%.[5]
This is a broad estimation based on reports from experienced water researchers and applying our estimates of the share of crops specifically used for animal feed. See, https://docs.google.com/spreadsheets/d/19XsKhVFbOiyB01Kyz_WVVBdFBa_Pd1JsCISscE7tr08/edit?gid=0#gid=0
For estimates of the shares of crops specifically used for animal feed, see, Total Feed Crops Share. For estimate that crops use ~78% of total U.S. water consumption, see, Agricultural Water Usage [Based on assessment that agriculture accounts for ~80% of consumption and a subset of that figure is direct withdrawal for livestock accounting for ~2%]
Note: this is likely a conservative estimate because it does not count many additional shares of crops used as feed but not included in these calculations. See, Total Feed Crops Share [question: Why are these percentages underestimated?]
Note: As a general confirmation of our calculations, esteemed water researcher Arjen Hoekstra states that “40 percent of the water consumed by Americans goes into meat and dairy production.” See, Arjen Hoekstra (June 29, 2014) To Save Water, Change Your Diet, New York Times.
https://www.nytimes.com/roomfordebate/2014/06/29/the-water-crisis-in-the-west/to-save-water-change-your-dietSee, Water Usage by Factory Farms and Slaughterhouses
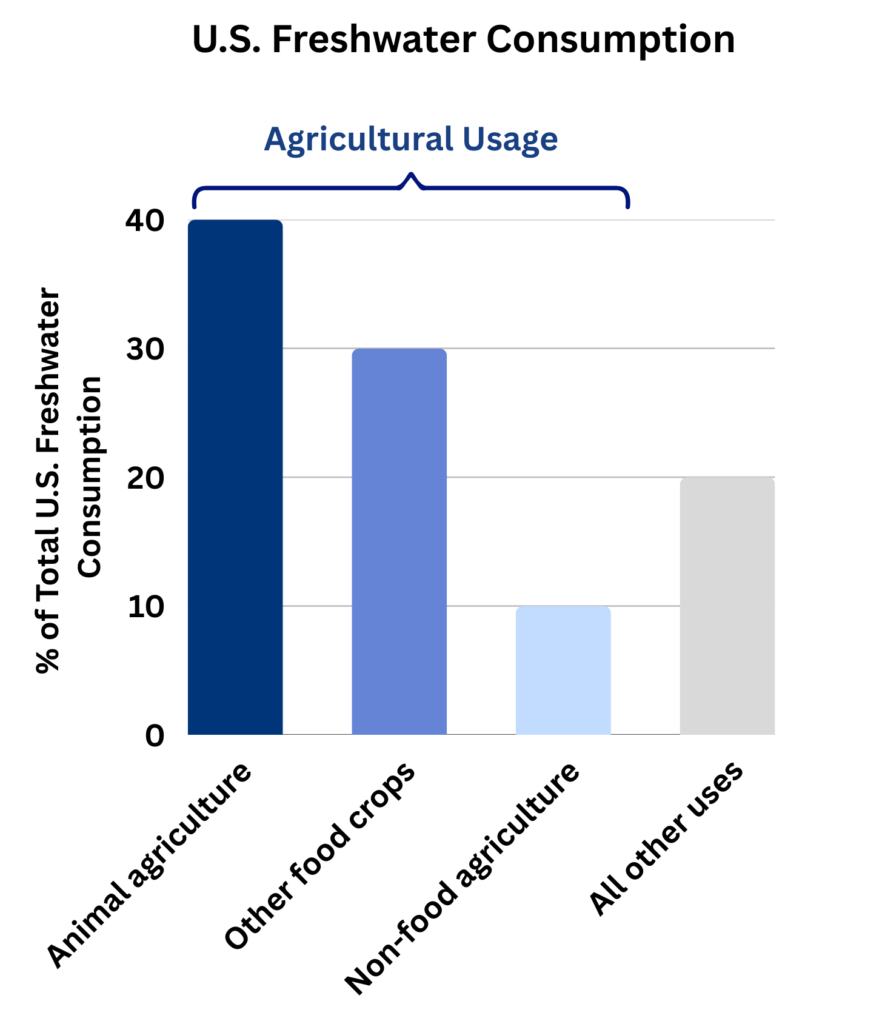
Broadly estimated, the shares of total U.S. water consumption are:
![]() 40% for animal agriculture.
40% for animal agriculture.![]() 30% for other food crops.
30% for other food crops.![]() 10% for non-food agriculture (ethanol and cotton).
10% for non-food agriculture (ethanol and cotton).![]() 20% for all other uses including manufacturing, energy, service industries, and domestic supply.
20% for all other uses including manufacturing, energy, service industries, and domestic supply.
This is a broad estimation based on reports from experienced water researchers and applying our estimates of the crops specifically used for animal feed. See, https://docs.google.com/spreadsheets/d/19XsKhVFbOiyB01Kyz_WVVBdFBa_Pd1JsCISscE7tr08/edit?gid=0#gid=0
For estimates of shares of crops specifically used for animal feed, see, Feed Crop Water Usage
Water consumption by the 3 major crops primarily used for feed – alfalfa and other hay, corn and corn silage, and soybeans – accounts for ~45% of total national water consumption
By crop:![]() Alfalfa/hay: ~23% of total U.S. water consumption (almost exclusively for animal ag).
Alfalfa/hay: ~23% of total U.S. water consumption (almost exclusively for animal ag). ![]() Corn (including corn silage): ~15%.
Corn (including corn silage): ~15%.![]() Soybeans : ~7%.
Soybeans : ~7%.

Crops primarily used for animal feed include corn, soybeans, alfalfa and other hay, sorghum, and pasture. These crops accounted for ~63% of all harvested irrigated acres in 2023.[1]

USDA NASS (2024) Census of Agriculture, 2023 Irrigation and Water Management Survey, Vol 3, AC-22-SS-1, Table 38. [Note that “If two or more crops were harvested from the same land during the year (double cropping), the acres were counted for each crop. Therefore, the total acres of all crops harvested could exceed the acres of cropland harvested.” Appendix B definition “Acres and quantity harvested”] [Corn includes corn for grain + silage; Alfalfa/Hay includes alfalfa haylage & other hay and haylage. For calculations see, https://docs.google.com/spreadsheets/d/1D3nnEa6Uj_xFPCop10hfaLVRuhEPkEcoyWvpOmiBWSI/edit?gid=0#gid=0]
Based on updated USDA information on withdrawals:
Alfalfa and other types of hay withdraw the largest volumes of irrigated water, accounting for ~22% of all irrigated water applied.[1]
Corn and corn silage account for the 2nd largest withdrawal at ~20% of all irrigated water applied.[2]

USDA NASS (2024) Census of Agriculture, 2023 Irrigation and Water Management Survey, Vol 3, AC-22-SS-1, Table 39. And see, https://docs.google.com/spreadsheets/d/1D3nnEa6Uj_xFPCop10hfaLVRuhEPkEcoyWvpOmiBWSI/edit?gid=0#gid=0
Using the USDA estimates of irrigated water applied to all crops in 2023, ~46% of all irrigation water goes to the share of major crops specifically used for animal feed.[1]
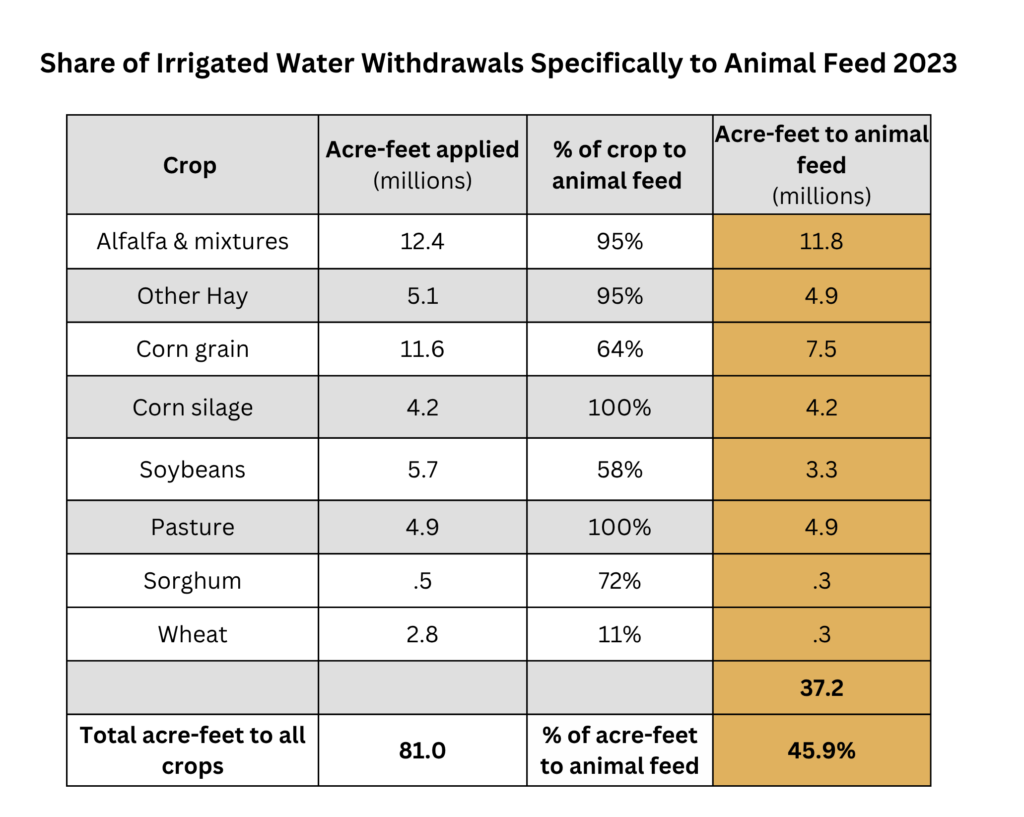
We use USDA withdrawals here (rather than consumption) because they are credible and recent, and the USDA does not provide estimates of consumption by crop. This analysis generally supports our estimate of 50% of irrigation consumption attributed to animal ag, especially considering the many other uncounted animal feed shares as noted in the next question.
USDA NASS (2024) Census of Agriculture, 2023 Irrigation and Water Management Survey, Vol 3, AC-22-SS-1, Table 39. And see, https://docs.google.com/spreadsheets/d/1hzV0ZwSna1JsqaSAJ6xrr3ms-f16Td-oAkF8cigYuFE/edit?gid=0#gid=0 [Percent of crops going to animal feed, see, Total Feed Crops Share]
There are many additional animal feed usages of major crops that we have not counted.[1] Among those is the use of corn oil and soy oil as feed additives, and the practice of using crops directly for forage, which would not show up in the USDA’s accounting of irrigated crops, since they are not considered harvested.
Along with the crops primarily used for animal feed, there are additional uncounted crops that are partially used for animal feed.[2] Those secondary feed crops include cotton, oats, rye, sunflower seeds, and peanuts.