Groundwater is water that underlies the earth’s surface. It makes up ~98-99% of all freshwater on earth.[1]
Aquifers are permeable underground structures where groundwater flows, accumulates in usable quantities, and is relatively accessible from above ground.[2,3]
Margat, J. & Van der Gun, J. (2013). Groundwater around the world: a geographic synopsis. CRC Press, Taylor & Francis Group, p. 5.
USGS (2019) Aquifers and Groundwater, Water Science School. https://www.usgs.gov/special-topics/water-science-school/science/aquifers-and-groundwater
Margat, J. & Van der Gun, J. (2013), p. 5, fn 1.
The unsustainable depletion of U.S. groundwater is well documented.[1-4]
Groundwater depletion is viewed as a threat to agriculture.[5] It is also a threat to the public supply of water, of which almost 40% is sourced from groundwater.[6] Additionally, ~13% of the population relies on its own water supply (mostly wells) and this is almost entirely groundwater.[7] Groundwater depletion due to irrigation is having dramatic consequences in the southwest where thousands of wells are drying up.[8]
Although groundwater depletion is often viewed as a threat to human water supplies, its impacts are even greater on plant and animal species that have less ability to adapt. Depletion of groundwater contributes to reduced base flow to springs, streams, and other surface water bodies, loss of wetlands, all of which can damage aquatic ecosystems and the animals that rely on them.[9,10]
U.S. Geological Survey (2018) Groundwater Decline and Depletion. https://www.usgs.gov/special-topics/water-science-school/science/groundwater-decline-and-depletion#overview [Defines groundwater depletion as “long-term water-level declines caused by sustained groundwater pumping.”]
Konikow, L. F.,(2013). Groundwater depletion in the United States (1900− 2008), U.S. Geological Survey, No. 2013-5079.
Konikow, L. F. & Bredehoeft, J.D. (2020) Groundwater Resource Development: Effects and Sustainability, Groundwater Project, Guelph, Ontario, Canada, 2020, pp. 14-17.
Rojanasakul, Mira, et al., America Is Using Up Its Groundwater Like There’s No Tomorrow.
New York Times, August. 28, 2023Lopez, J. R., et al., (2022). Sustainable Use of Groundwater May Dramatically Reduce Irrigated Production of Maize, Soybean, and Wheat. Earth’s Future, 10(1), Abstract.
Dieter, C.A., et al. (2018) Estimated Use of Water in the United States in 2015, U.S. Geological Survey, Table 5, p. 20. [15.2 Bgal/d from groundwater of 39 total]
Dieter, C.A., et al. (2018), p. 22 and Table 6, p. 23. [Groundwater = 98%]
Ella Nilson (November 2022) Wells are running dry in drought-weary Southwest as foreign-owned farms guzzle water to feed cattle overseas, CNN. https://www.cnn.com/2022/11/05/us/arizona-water-foreign-owned-farms-climate/index.html [Arizona wells drying up with large farms irrigating alfalfa]
Konikow, L. F. (2015). Long-term groundwater depletion in the United States. Ground Water, 53(1), 2–9, p. 2. [“Groundwater depletion can have a number of detrimental effects. These include reduced well yields, increased pumping costs, needs to drill deeper wells, irreversible land subsidence, reduced base flow to springs, streams, and other surface water bodies, and loss of wetlands. Depletion effects can, in turn, lead to land-use changes. Reduced groundwater discharge can damage aquatic ecosystems.”]
Rohde, M. M., et al., (2024). Groundwater-dependent ecosystem map exposes global dryland protection needs. Nature (London), 632(8023), 101–107. [“When groundwater depletion occurs, groundwater levels can drop out of reach from wells and ecosystems, creating a lack of access to drinking or irrigation water and causing or contributing to land subsidence, seawater intrusion, streamflow depletion, ecosystem decline and biodiversity loss.”]
The UN recognizes access to safe and clean drinking water as a human right.[1] It’s been estimated that about 130 million people in the U.S., mostly in western states, face the prospect of severe water scarcity for at least part of the year.[2] More than 40 million Americans self-supply water from groundwater wells.[3] Additionally, almost 40% of all public supplies of water (for domestic and commercial use) are sourced from groundwater.[4]
One study found that domestic wells are more susceptible to going dry than agricultural wells, which are often drilled deeper. Unsurprisingly, drying wells “were concentrated in rural areas with high agricultural productivity, such as parts of the California Central Valley and the High Plains.”[5] But because there is no comprehensive recordkeeping, the number of wells that have gone dry due to declining groundwater levels are difficult to estimate.
U.N. Dept. of Economic and Social Affairs (2010). The human right to water and sanitation. Resolution 64/922.
Mekonnen, M. M. & Hoekstra, A. Y. (2016). Four billion people facing severe water scarcity. Science Advances, 2(2), e1500323–e1500323, p. 3.
Dieter, C.A., et al., (2018) Estimated Use of Water in the United States in 2015, U.S. Geological Survey, p. 22 and Table 6, p. 23.
Dieter, C.A., et al., (2018), Table 5, p. 20.[15.2 Bgal/day / 39 Bgal/day = 39%]
Perrone, D. & Jasechko, S. (2017). Dry groundwater wells in the western United States. Environmental Research Letters, 12(10), 104002, Abstract, p. 2.
A USGS assessment in 2013 estimated that U.S. aquifers are losing approximately 25 km3 (cubic kilometers) yearly.[1]
That loss is about two-thirds the volume of total domestic water use in the U.S. annually (indoor and outdoor uses at all residences).[2]
Konikow, L. F. (2013). Groundwater depletion in the United States (1900− 2008), U.S. Geological Survey, No. 2013-5079.
Dieter, C.A., et al., (2018) Estimated Use of Water in the United States in 2015, U.S. Geological Survey, Table 6, p. 23. [A cubic kilometer = 264.2 billion gallons. 25 km3 = 6.605 trillion gallons. Total freshwater domestic use = 26.6 Bgal/day = 9.709 trillion gallons per year. 6.605 / 9.709 = 68%]
Surface water and groundwater are withdrawn in almost equal parts.
![]() Surface Water – The USGS estimates that irrigation withdraws 60.9 billion gallons per day (Bgal/d) of fresh surface water. That’s ~52% of agriculture’s total withdrawals.[1]
Surface Water – The USGS estimates that irrigation withdraws 60.9 billion gallons per day (Bgal/d) of fresh surface water. That’s ~52% of agriculture’s total withdrawals.[1]
![]() Groundwater – Irrigation withdraws 57.2 Bgal/d of groundwater. That’s ~48% of agriculture’s total withdrawals.[2]
Groundwater – Irrigation withdraws 57.2 Bgal/d of groundwater. That’s ~48% of agriculture’s total withdrawals.[2]
Agriculture’s consumptive use is likely skewed towards groundwater. Two reports estimate groundwater at ~55% of irrigation’s total consumption, versus surface water at ~45%.[3,4]
Dieter, C.A., et al., (2018) Estimated Use of Water in the United States in 2015, U.S. Geological Survey, Table 3A, p. 14. [60.9 / 118 = 51.6%]
Dieter, C.A., et al., (2018) Table 4A, p. 16. [57.2 / 118 = 48.47%]
Konar, M. & Marston, L. (2020). The Water Footprint of the United States. Water (Basel), 12(11), 3286., p. 3. [“Of this, 44% comes from streams, rivers, and lakes, while the remaining 56% is from groundwater.”]
Lamsal, G. & Marston, L. T. (2024). Monthly crop water requirements of irrigated crops in the United States from 1981-2019. Authorea Preprints. Table S-2, p. 5. [Estimates long-term average at 55% groundwater versus 45% surface water.]
Critically, crop irrigation makes up about two-thirds of total groundwater withdrawals.[1]
Dieter, C.A. et al., (2018) Estimated Use of Water in the United States in 2015, U.S. Geological Survey Table 4A, p. 16. [Total fresh groundwater withdrawals for all categories = 82.3 billion gallons per day. Irrigation of 57.2 / 82.3 = 69.5%]
Broadly estimated, about one third or more of all groundwater withdrawals can be attributed to animal agriculture.
![]() About one-third of groundwater withdrawals goes to crops specifically used for animal feed. All crops use about two-thirds of groundwater.[1] And we estimate that the irrigation water volume applied to crops used specifically for animal feed is about 50% of all crops.[2]
About one-third of groundwater withdrawals goes to crops specifically used for animal feed. All crops use about two-thirds of groundwater.[1] And we estimate that the irrigation water volume applied to crops used specifically for animal feed is about 50% of all crops.[2]
![]() Adding to the feed crop figure is direct water usage for livestock which, according to the USGS is 1.5% of all groundwater withdrawals.[3] The percentage of groundwater used on-the-farm for livestock and poultry production, though small compared to water used by feed crops, is still significant.
Adding to the feed crop figure is direct water usage for livestock which, according to the USGS is 1.5% of all groundwater withdrawals.[3] The percentage of groundwater used on-the-farm for livestock and poultry production, though small compared to water used by feed crops, is still significant.
![]() Processing plants can also be tied directly to groundwater depletion. According to an analysis of three Oklahoma counties where Seaboard Foods operates, groundwater levels dropped by 23% since 1995 – a rate two and half times faster than the 30 years before the plant opened.[4]
Processing plants can also be tied directly to groundwater depletion. According to an analysis of three Oklahoma counties where Seaboard Foods operates, groundwater levels dropped by 23% since 1995 – a rate two and half times faster than the 30 years before the plant opened.[4]
Dieter, C.A., et al., (2018) Estimated Use of Water in the United States in 2015, U.S. Geological Survey Table 4A, p. 16. [Total fresh groundwater withdrawals for all categories = 82.3 billion gallons per day. Irrigation of 57.2 / 82.3 = 69.5%, slightly reduced considering golf course use.]
See, Water Usage by Feed Crops
Dieter, C.A., et al. (2018), Table 8, p. 32. [Total groundwater withdrawals for all categories = 82.3 billion gallons per day. Livestock groundwater usage = 1.24 Bgal/day. 1.24 / 82.3 = 1.5%]
Ben Felder (June 6, 2024) Parched in the Panhandle. Investigate Midwest. https://investigatemidwest.org/2024/06/06/parched-in-the-panhandle/ [Seaboard Foods pork processing plant slaughters more than 20,000 hogs daily, using 3,500 gallons of water a minute.]
The aquifer systems with the three largest volumes of withdrawals, by far, are the High Plains (of which the Ogallala is a part), the Mississippi River Valley, and the Central Valley of California.
Withdrawals in billions of gallons per day:[1]
![]() High Plains aquifer – 12.3 Bgal/day
High Plains aquifer – 12.3 Bgal/day![]() Mississippi River Valley – 12.1 Bgal/d
Mississippi River Valley – 12.1 Bgal/d![]() Central Valley (CA) – 11.1 Bgal/d
Central Valley (CA) – 11.1 Bgal/d
Withdrawals from these 3 aquifers make up ~43% of the nation’s fresh groundwater withdrawals.[2]
Lovelace, J. K., et al., (2020) Estimated groundwater withdrawals from principal aquifers in the United States, 2015, U.S. Geological Survey Circular 1464, Table 1, p. 7.
Dieter, C.A., et al., (2018) Estimated Use of Water in the United States in 2015, U.S. Geological Survey, Table 4A, p. 16 for total groundwater withdrawals. [35.5 Bgal/day / 82.3 Bgal/day total fresh groundwater = 43.1%. Saline withdrawals from these 3 aquifers range from 0% to .6%]
Irrigation accounts for ~95% of the combined freshwater withdrawals of the 3 aquifers.[1]
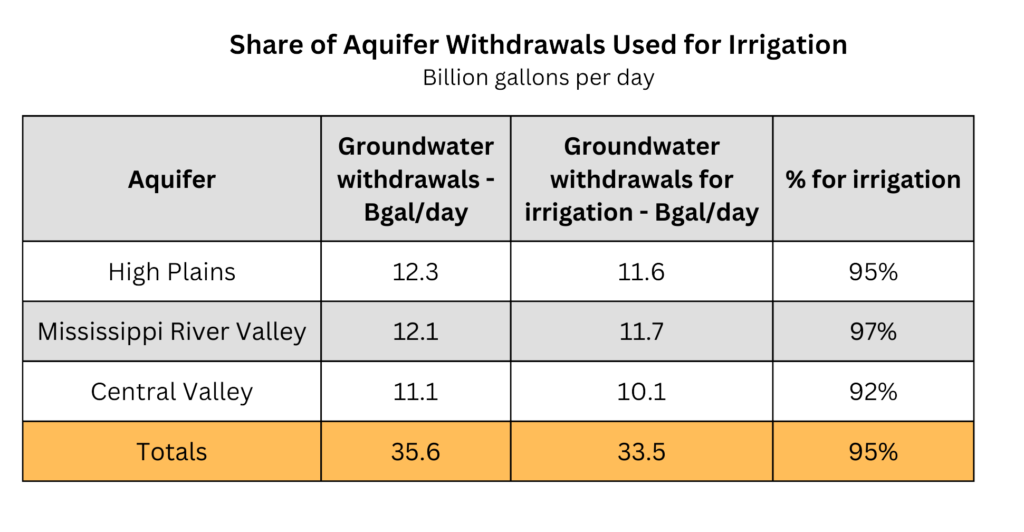
![]() Groundwater withdrawals from the 3 aquifers = about 43% of all U.S. fresh groundwater withdrawals.
Groundwater withdrawals from the 3 aquifers = about 43% of all U.S. fresh groundwater withdrawals.
![]() The share used for irrigation = about 41% of all U.S. fresh groundwater withdrawals.[2]
The share used for irrigation = about 41% of all U.S. fresh groundwater withdrawals.[2]
Lovelace, J. K., et al., (2020) Estimated groundwater withdrawals from principal aquifers in the United States, 2015, U.S. Geological Survey Circular 1464, Table 1, p. 7. [Irrigation for the 3 aquifers / Total fresh groundwater withdrawal for the 3 aquifers]
Dieter, C.A., et al., (2018) Estimated Use of Water in the United States in 2015, U.S. Geological Survey, Table 4A, p. 16 for total groundwater withdrawals. [35.4 Bgal/day / 82.3 Bgal/day total fresh groundwater = 43.07%. Saline withdrawals from these 3 aquifers range from 0% to .6%. Amount for irrigation = 33.5 / 82.3 == 40.7%]
According to the USGS, from 1900 thru 2008, the cumulative depletion was:[1,2]

For all 3 aquifers, cumulative depletion totals ~670 km3 (cubic kilometers). For context, total annual domestic use of freshwater (indoor and outdoor uses at residences) is about 37 km3 per year.[3] About 27% of combined aquifer depletion (178 km3) occurred from 2000 through 2008.[4]
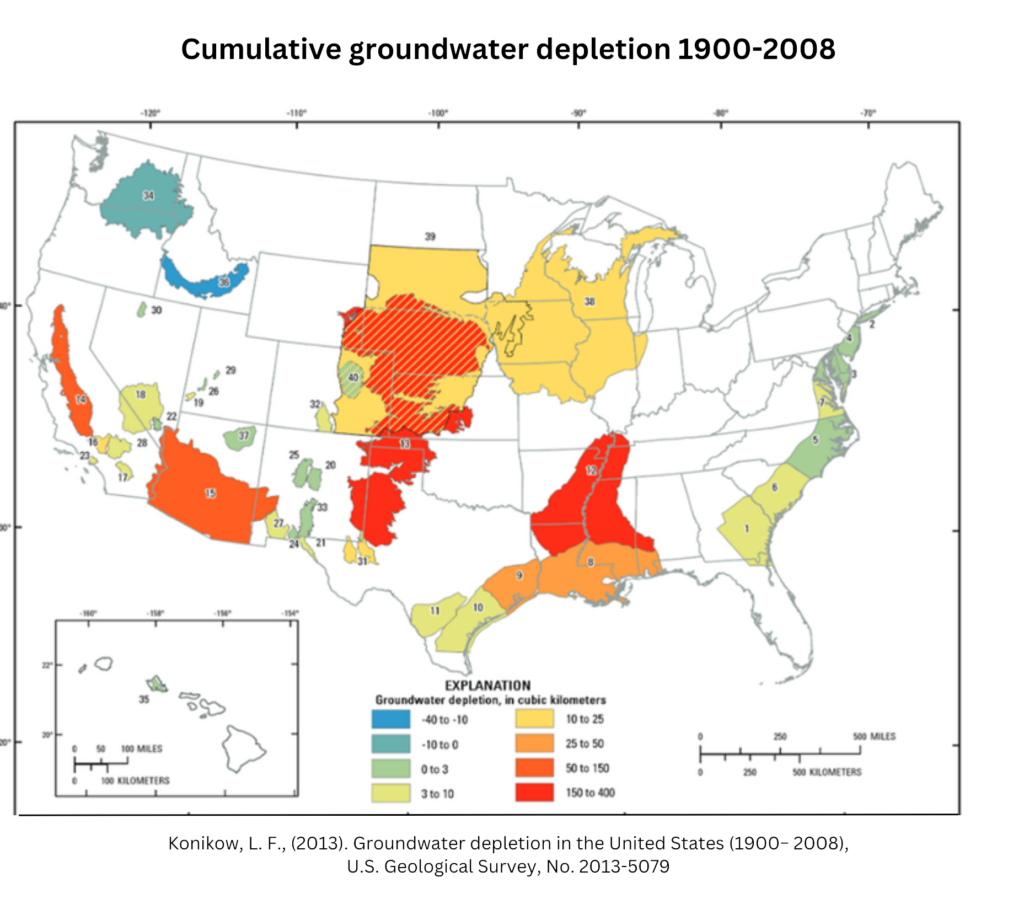
Depletion rates are highly variable within an aquifer system, with some localized areas showing high depletion rates and other areas much lower.[5] Of particular concern is the aquifer in California’s Central Valley where depletion rates have been accelerating rapidly since 2003.[6]
For estimated groundwater storage, see, Scanlon, B. R., et al., (2012). Groundwater depletion and sustainability of irrigation in the US High Plains and Central Valley. PNAS, 109(24), 9320–9325. [Total volumes and depletion percentages for High Plains and Central Valley only, p. 9321]
For estimated depletion, see, Konikow, L. F. (2013). Groundwater depletion in the United States (1900− 2008), U.S. Geological Survey, No. 2013-5079, Table 1, pp. 4-5; Figure 2, p. 6. [Note: Konikow’s estimated depletion figures are from 1900-2008. Scanlon depletion amounts are estimated from 1950s-2007 for High Plains and 1860s-1961 for Central Valley]
Dieter, C.A., et al., (2018) Estimated Use of Water in the United States in 2015, U.S. Geological Survey, Table 6. [Total freshwater domestic use = 26.6 Bgal/day.] [A cubic kilometer (km3) = 264.2 billion gallons. Total freshwater domestic use = 26.6 Bgal/day = 9,709 billion gallons per year. 9,709 billion / 264.2 billion = 36.7 km3]
Konikow, L. F. (2013), Table 1, pp. 4-5; Figure 2, p. 6. [Total depletion amounts for 2000 thru 2008 = 177.6 km3 / 667.7 km3 = 26.6%]
Scanlon, B. R., et al., p. 9324.
Liu, P. W., et al., (2022). Groundwater depletion in California’s Central Valley accelerates during megadrought. Nature Communications, 13(1), 7825. [“Here we use nearly two decades of observations from NASA’s GRACE satellite missions and show that the rate of groundwater depletion in the Central Valley has been accelerating since 2003 (1.86 km3/yr, 1961–2021; 2.41 km3/yr, 2003–2021; 8.58 km3/yr, 2019–2021), a period of megadrought in southwestern North America.”]
The exact share of water from the High Plains aquifer (including Ogallala) used for irrigation cannot be ascertained with certainty. However, an analysis of irrigation water usage for the 8 states overlying the High Plains aquifer along with each state’s share of irrigated water that goes to crops primarily used for animal feed shows that probably well over 50% of the aquifer water is used for feed crop production.
The USDA Census Irrigation and Water Management data shows that crops primarily used for feed (corn, corn silage, soybeans, alfalfa & other hay, and pasture for grazing) produced by the 8 states overlying the High Plains aquifer account for ~78% of the irrigated water withdrawals in the 8 states. And more than 71% of that irrigation comes from groundwater.[1]
While not all pumped groundwater in the region comes from the High Plains aquifer,[2] it is considered the primary aquifer in the region and “the most important groundwater resource in the U.S.”[3,4] It has the highest volume of groundwater withdrawals, of which ~95% is used for crop irrigation.[5]

Data from: USDA NASS (2024) Census of Agriculture, 2023 Irrigation and Water Management Survey, Vol 3, AC-22-SS-1, Tables 7 & 40. [For “feed crops” we use corn, corn silage, soybeans, alfalfa & mixtures, other hay & mixtures, and irrigated pastureland. In Kansas and Nebraska – the states with the highest production of corn and soybeans – broadly estimated, ~97% and ~94% of irrigated water, respectively, comes from pumped groundwater. For analysis, see, https://docs.google.com/spreadsheets/d/1jpSwZNTRmqBQygU6-Agz3IsUnydoye2OdITL05Lbl08/edit?gid=0#gid=0
Macfarlane, P. A., et al., (2000) Aquifers of the High Plains Region, Kansas Geological Survey. [“Other aquifers are hydraulically connected to the High Plains aquifer. An aquifer is hydraulically connected to an overlying or underlying aquifer if water can move easily between them.”]
R. Aaron Hrozencik (February 7, 2022) Energy Pricing Structures Promote Increased Use of Scarce Groundwater Resources in the High Plains Aquifer Region, USDA Economic Research Service, Amber Waves.
M. Arthur & D. Saffer (n.d.) The High Plains Aquifer, InTeGrate, Penn State Univ., https://www.e-education.psu.edu/earth111/node/941
Chart and data from Lovelace, J. K., et al., (2020) Estimated groundwater withdrawals from principal aquifers in the United States, 2015 (ver. 1.2, October 2020): U.S. Geological Survey Circular 1464, Table 1, p. 7. [11.63 / 12.25 Bgal/day = 95%]