Industrial animal agriculture is likely the primary contributor to the failing grades of U.S. waterways, responsible for about 50% of nutrient pollution – the leading cause of U.S. water pollution.[1]
As noted in previous pages of this section:![]() U.S. waterways have received failing grades from the EPA for many years.
U.S. waterways have received failing grades from the EPA for many years.![]() Nutrient pollution leading to eutrophication is the primary cause.
Nutrient pollution leading to eutrophication is the primary cause.![]() Agriculture is the driver of about three-fourths of nutrient pollution.
Agriculture is the driver of about three-fourths of nutrient pollution.
Animal ag is responsible for about two-thirds of agriculture’s contributions and thus the driver of about half of all nutrient pollution.[2]
Note: We are not aware of researchers or government agencies that have estimated this figure specifically for animal ag. This estimate is based on the reports analyzed on this page and previous pages, and it is probably a conservative estimate. Naturally, we’d welcome challenges or other assessments. If indeed we are degrading our waterways across the country to produce cheap meat, there should be many assessments made of the widespread nutrient pollution impacts on biodiversity, air quality, climate change, and clean water availability. A quantification and ranking of animal ag’s role would be a challenging and worthwhile assessment.
This point is explored further below. [Calculation: Agriculture = ~75% of nutrient pollution. Animal ag is about two-thirds of agriculture’s contributions. Therefore .75 x .67 = 50%]
Globally, there is strong evidence that animal ag is the primary driver of water pollution.
According to the FAO, “The livestock sector is probably the largest sectoral source of water pollution, contributing to eutrophication, ‘dead zones’ in coastal areas, degradation of coral reefs, human health problems, emergence of antibiotic resistance and many others.”[1]
A global mega study, reviewing more than 500 scientific reports, estimates that animal ag (feed, livestock, and aquaculture) accounts for ~43% of all eutrophication.[2] Other studies support the conclusion that livestock production drives nutrient pollution and eutrophication globally.[3,4]
Eutrophication is considered the largest water pollution problem worldwide.[5-7]
Food and Agriculture Organization of the United Nations (2018). More people, more food, worse water? A global review of water pollution from agriculture. FAO, Water, Water, Land and Ecosystems (WLE) Program of the CGIAR, International Water Management Institute (IWMI), p. 68.
Poore, J. & Nemecek, T. (2018). Reducing food’s environmental impacts through producers and consumers. Science (American Association for the Advancement of Science), 360(6392), 987–992, Table S17.
Bouwman, L., et al., (2013). Exploring global changes in nitrogen and phosphorus cycles in agriculture induced by livestock production over the 1900–2050 period. PNAS, 110(52), 20882–20887, p. 20882. [“Therefore, it is, in fact, global livestock production that drives the nutrient cycling in the total agricultural system.”]
Li, Y., et al., (2022). Multi-pollutant assessment of river pollution from livestock production worldwide. Water Research (Oxford), 209, 117906–117906, p. 7 [“The inputs to rivers are around 22 Tg Total Dissolved Nitrogen, 1.8 Tg Total Dissolved Phosphorus, and (large amounts of) oocysts in 2010. Cattle, pigs, and chickens are responsible for 74–88% of these pollutants in rivers.”]
Smith & Schindler, D. W. (2009). Eutrophication science: where do we go from here? Trends in Ecology & Evolution (Amsterdam), 24(4), 201–207, p. 201. [“Cultural eutrophication (excessive plant growth resulting from nutrient enrichment by human activity) is the primary problem facing most surface waters today.”]
Eutrophication: Causes, Consequences and Control, Volume 2 (Ansari & S. S. Gill , Eds.; 1st edition. 2014) Springer Netherland, p. 1.1. [“On the hydrological map of the world eutrophication has become the primary water quality issue.”]
Kleinman, P.J.A., et al., (2020). “Managing Animal Manure to Minimize Phosphorus Losses from Land to Water,” in Animal Manure (Eds. H.M. Waldrip, P.H. Pagliari and Z. He), p. 201. [“Eutrophication is the most pervasive concern to freshwater and estuarine water bodies worldwide, with phosphorus (P) pollution continuing to expand the extent of eutrophication, its impacts on aquatic life and its disruption of the benefits of ecosystems to humankind.”]
As a broad estimate, ~75 % of U.S. nutrient pollution is generated by agricultural systems from chemical fertilizers, crop fixation, and manure.[1]
See, Nutrient Pollution and Animal Ag Overview [see, question: “Is agriculture the main source of U.S. nutrient pollution?”]
About two-thirds of agriculture’s nutrient pollution comes from animal ag. Broad estimates follow.
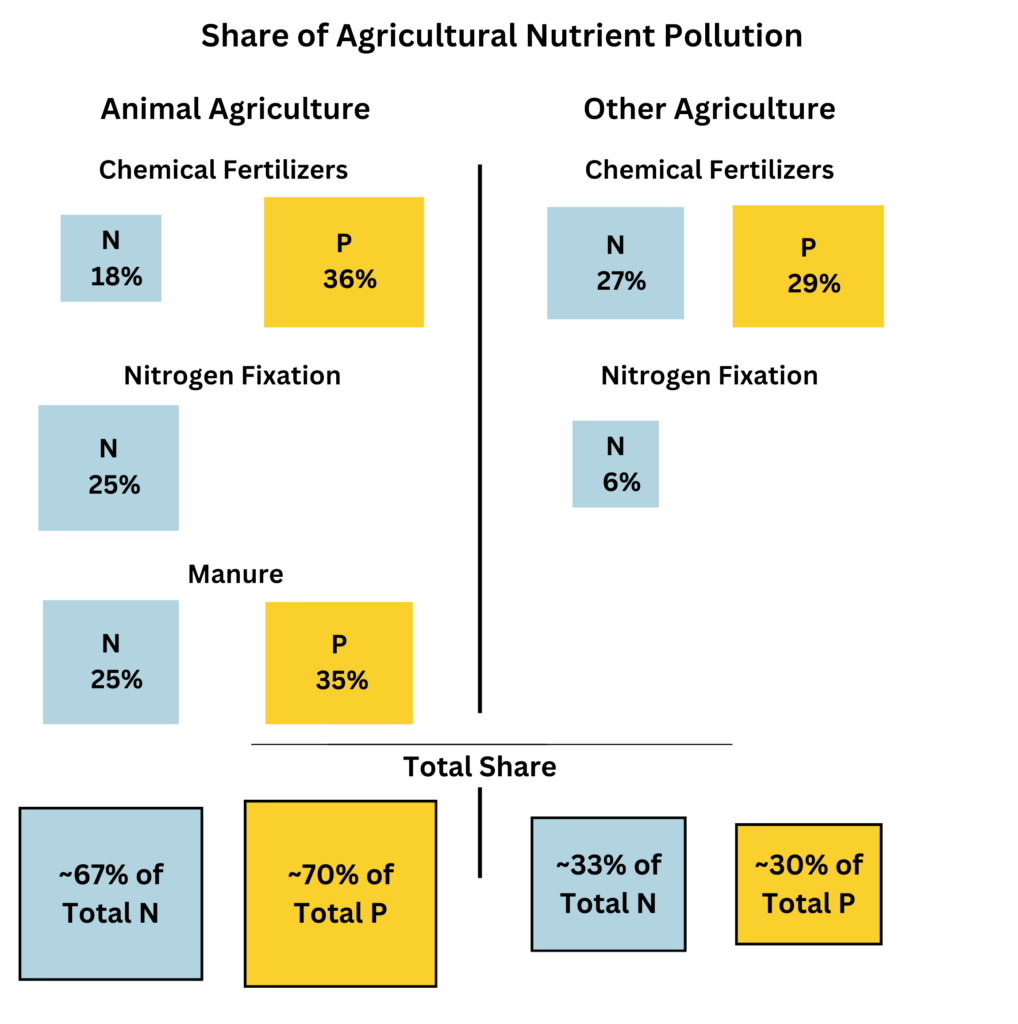
Chemical fertilizers – About a third of the nitrogen and half of the phosphorus in chemical fertilizers is applied to the share of corn and soybeans used specifically for feed.[1,2] Adding the many other crops used for feed, including hay, pasture, and secondary feed crops, we estimate 40% of nitrogen and 55% of phosphorus in chemical fertilizers goes specifically to feed crops.[3]
Fixation – Large quantities of nitrogen are also created by soybean and hay crops through fixation. An EPA report estimated that nitrogen creation from soybeans, hay, and pasture was equal to ~70% of the total N in chemical fertilizers.[4] About 80% of that total is created specifically by animal feed crops.[5]
Manure – Add to this the vast amounts of nitrogen and phosphorus in manure, most of which is dispersed into the environment. Total nitrogen in manure is a little more than half the total nitrogen in chemical fertilizers. The same is true for phosphorus.[6]
These are broad, possibly conservative estimates. They align with an analysis of U.S. per capita N and P impacts from animal-sourced food production.[7] An older analysis of P losses is also in line.[8] A European study found that ~73% of total agricultural N and P impacts on water pollution was due to the livestock sector.[9]
For total nutrients in chemical fertilizers, see, Chemical Fertilizer Use on Feed Crops [Note: Calculations are based on the following approximate figures: Total N in chemical fertilizers = 25.2 billion pounds and P = 8.1B. N in manure = 14.2B and P = 4.3B. Fixation = 70% of 25.2B or 17.6B. Therefore total N = ~57B and total P = ~12.4B. Also note that adding usages on alfalfa/ hay crops, pasture, and the fertilizer usages on “secondary” feed crops (wheat, sorghum, barley, etc.) along with the many other untallied feed crop usages probably brings this total share to ~40% of the total nitrogen in chemical fertilizers and ~55% of total phosphorous in chemical fertilizers. These are all ballpark figures which we think are conservative and are used on the chart.]
MacDonald, G. K., et al., (2012). Embodied phosphorus and the global connections of United States agriculture. Environmental Research Letters, 7(4), 044024, p. 8. [Support for the estimate of about 55% of P from animal ag comes from this report, which estimates “About 56% of the P fertilizer requirement for US food was for livestock products…”]
Eshel, G., et al., (2014). Land, irrigation water, greenhouse gas, and reactive nitrogen burdens of meat, eggs, and dairy production in the United States. PNAS, 111(33), 11996, p. 11998. [Feed production “uses ˜6 million metric tons of Nr fertilizer annually, about half of the national total.”]
U.S. EPA (2011) Reactive Nitrogen in the United States, p. ES-5. [Report estimates that reactive nitrogen created by feed crops (soy, hay, and pasture) equals ~70% of the total from chemical fertilizers. (7.7MMT/10.9MMT). Of 7.7MMT from fixation, ~99% is from crops used primarily for feed. See, Table 1]
Calculation: Using 58% of soybeans used specifically for animal feed and adding all pasture, hay and alfalfa for animal feed. Proportions based on: U.S. EPA (2011) Reactive Nitrogen in the United States, Table 1. Therefore .8* 17.6B = 14B or ~25% of total N. For the estimate that 58% of soybeans are used for animal feed, see, Share of Soybean Crop for Feed
For total nutrients in manure, see, Total Nutrient Volume in Manure
Metson, G. S., et al., (2020). The US consumer phosphorus footprint: where do nitrogen and phosphorus diverge? Environmental Research Letters, 15(10), 105022. [“Animal products comprise 78% of the average per capita P footprint and 72% for N.” p. 7. “We define the P footprint as the amount of P released to the environment associated with the production and consumption of major food groups for one person annually.” p. 2]
Suh, S., & Yee, S. (2011). Phosphorus use-efficiency of agriculture and food system in the US. Chemosphere, 84(6), 806-813. [“Major losses occur during the livestock, meat and dairy production and crop cultivation stage, where about 66% of the total phosphorus extracted is lost to the environment.” Of the 66% from agriculture, about 80% (81.8) is attributed to livestock, if we assume that at least half of crops are feed crops. (The report estimates a higher share.) Calculation from Figure 3: 30% + 12% + .5 * (8% + 16%) = 54%/66% = 81.8%. see, Abstract and Figure 3]
Leip, A., et al., (2015). Impacts of European livestock production: nitrogen, sulphur, phosphorus and greenhouse gas emissions, land-use, water eutrophication and biodiversity. Environmental Research Letters, 10(11), 115004. Abstract and Table 2.
The USGS, in one of the few large regional evaluations of nutrient pollution sources, documents the primary role of agriculture. The report covers all or parts of 31 states including the Mississippi River Basin and the Corn Belt.[1] Although it does not specifically analyze animal ag contributions, they can be reasonably extrapolated.
Nitrogen – The report estimates that ~73% of total N is from agriculture.![]() 25.9% from fertilizers.
25.9% from fertilizers.![]() 28.9% from manure.
28.9% from manure.![]() 18.4% from fixation.
18.4% from fixation.

Our broad estimate is that animal ag contributes ~54% of all N or about ~74% of agricultural N.[2]
Phosphorus – The report estimates that ~72% of total anthropogenic P is from agriculture.![]() 48.9% from fertilizers
48.9% from fertilizers![]() 23.5% from manure
23.5% from manure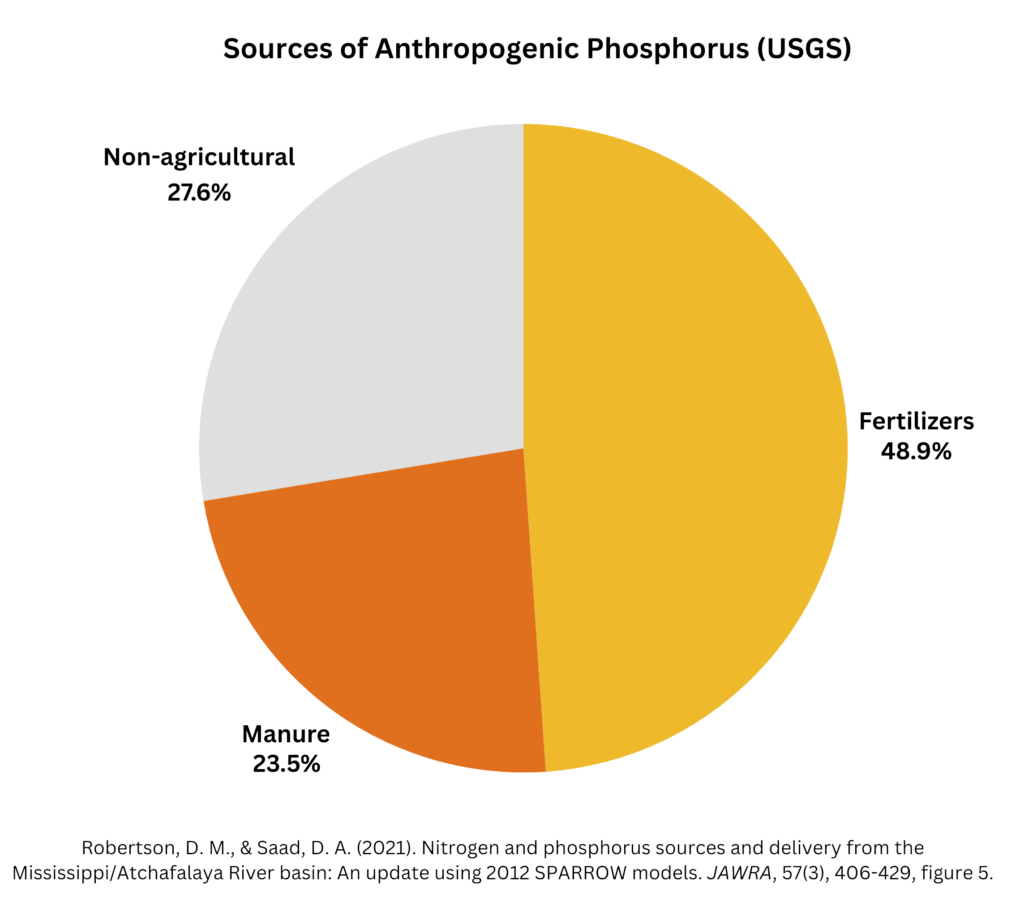
Our broad estimate is that animal ag contributes ~50% of all anthropogenic P or ~70% of agricultural P.[4]
Although the report covers all or parts of 31 states, it is not a nationwide evaluation; as far as we know, none are available.[5]
Robertson, D. M. & Saad, D. A. (2021). Nitrogen and phosphorus sources and delivery from the Mississippi/Atchafalaya River basin: An update using 2012 SPARROW models. JAWRA Journal of the American Water Resources Association, 57(3), 406-429, figure 5, p. 418. [Agricultural sources contributed, “73.2% of the N (25.9% — fertilizers, 28.9% — manure, and 18.4% — fixation)…”]
Calculation: 25.9% from fertilizers * .40 specifically for feed = 10.4%; 28.9% from manure is all animal ag; 18.4% from fixation * .80 specifically for feed = 14.7%. Therefore, 10.4 + 28.9 +14.7 = 54.0%. (54/73.2) = 73.7%)
Robertson, D. M., & Saad, D. A. (2021), figure 5. [“For the entire MARB, agriculture was the dominant general source contributing 56.0% of the P (37.8% – fertilizers; 18.2% – manure)…” Since 22.7% of the total is from “natural sources” we adjust these figures to focus on anthropogenic sources. 37.8/77.3 = 48.9% from fertilizers. 18.2/77.3 = 23.5% from manure.]
Calculation: 48.9% from fertilizers * .55 specifically for feed = 26.9%; 23.5% from manure is all animal ag; Therefore, 26.9 + 23.5 = 50.4%. (50.4/72.4) = 69.6%)
Rotz, A., et al., (2021). Environmental assessment of United States dairy farms. Journal of Cleaner Production, 315, 128153. [“…there are no national estimates of total reactive N loss… For total reactive N loss, national estimates were not available for comparison.” Abstract and p. 6]
No. This is made clear by the failing grades of waterways as assessed by the EPA in its latest round of evaluations.
![]() Less than half of U.S. freshwater bodies are in good biological condition.[1]
Less than half of U.S. freshwater bodies are in good biological condition.[1]![]() Almost three-fourths of U.S. lakes are eutrophic.[2]
Almost three-fourths of U.S. lakes are eutrophic.[2]![]() Less than one-third of rivers and streams have healthy biological communities.[3]
Less than one-third of rivers and streams have healthy biological communities.[3]![]() The 5-year average size of the Gulf of Mexico dead zone is ~4,300 square miles.[4]
The 5-year average size of the Gulf of Mexico dead zone is ~4,300 square miles.[4]
Nutrient pollution is the leading cause of these widely degraded conditions.[5]
EPA (2024). National Water Quality Inventory: Report to Congress. EPA 841-R-23-001.
See, Lakes, Rivers & Streams Pollution [question: What are the eutrophication levels of lakes?]
U.S. EPA (2023) National Rivers and Streams Assessment 2018 – 2019 Key Findings. [“Less than one-third of our river and stream miles (28%) had healthy biological communities…”]
NOAA (2024) Gulf of Mexico ‘dead zone’ larger than average, scientists find. https://www.noaa.gov/news-release/gulf-of-mexico-dead-zone-larger-than-average-scientists-find [This is more than twice the size of the 5-yr average goal agreed to in 2001 (1,930 sq. miles), set with a target date of 2015.]
See, Size of the Nutrient Pollution Problem [question: “Is nutrient pollution the leading cause of U.S. water pollution?”]