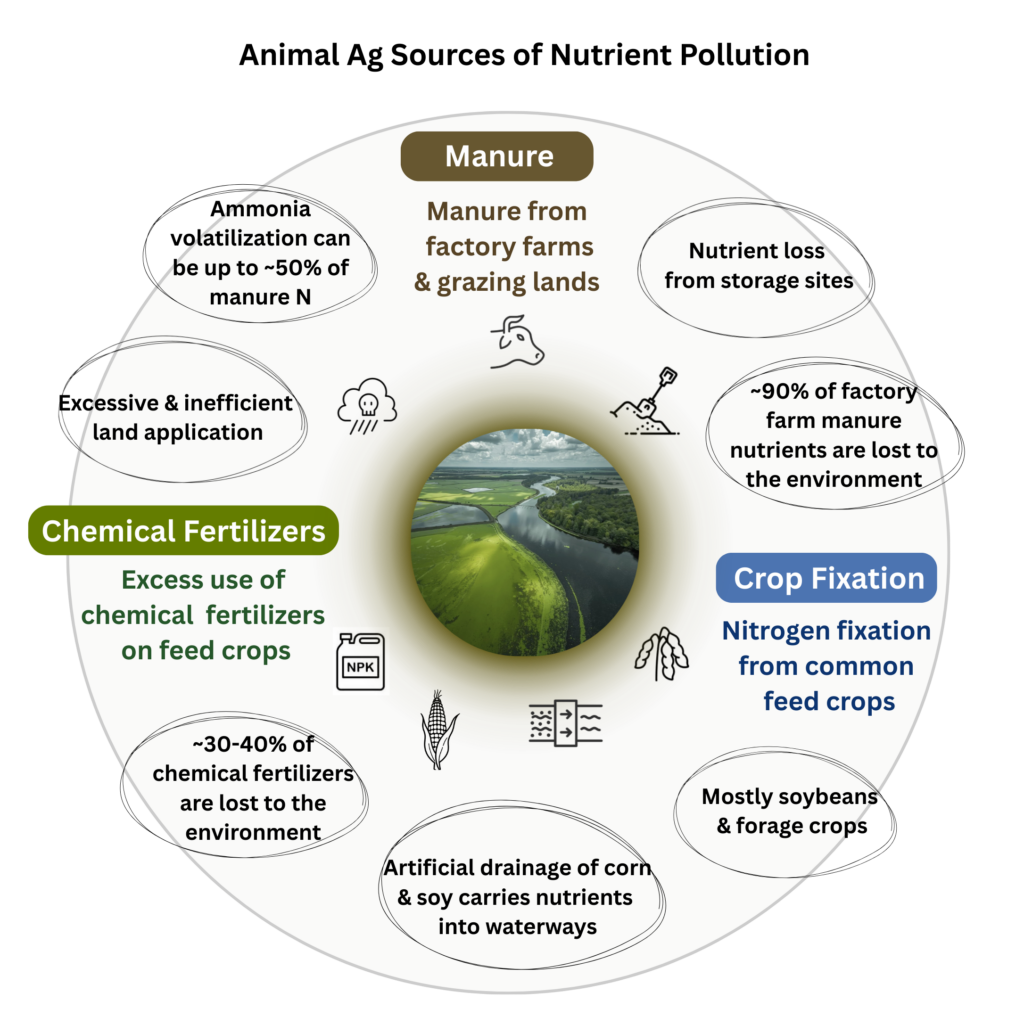
The primary sources of nitrogen and phosphorus are:![]() Concentrated amounts of manure on factory farms.
Concentrated amounts of manure on factory farms.![]() Excess use of chemical fertilizers on feed crops.
Excess use of chemical fertilizers on feed crops. ![]() Crop fixation of nitrogen by soybeans and alfalfa/hay.
Crop fixation of nitrogen by soybeans and alfalfa/hay.
For estimated respective shares of pollution see, spreadsheet for animal ag’s contribution https://docs.google.com/spreadsheets/d/16vc25ZTFcsp-IBDewc6zXcN8aAAbTHRJa92lFaQ0wpw/edit?gid=0#gid=0
For a visual representation of the shares of nutrient inputs from agriculture, see: Brehob, M. M., et al., (2025). The US EPA’s National Nutrient Inventory: Critical Shifts in US Nutrient Pollution Sources from 1987 to 2017. Environmental Science & Technology, Figure 2, p. E.
Manure and its nutrients – nitrogen and phosphorus – have almost no value in the factory farming system.[1,2] For most factory farms, it is simply a logistical question of how to get rid of it.[3] There are only 3 places for those nutrients to go:![]() Temporarily held in manure storage systems.
Temporarily held in manure storage systems.![]() Dispersed into the environment.
Dispersed into the environment.![]() Effectively incorporated into the soil and eventually into crops.[4]
Effectively incorporated into the soil and eventually into crops.[4]
We estimate that ~90% of manure nutrients are lost to the environment, with 10% or less effectively applied to croplands and incorporated into crops.[5]
The EPA has understood the severity of the problem for many years, saying in 2003, “Improperly managed manure has caused serious acute and chronic water quality problems throughout the United States.”[6] Despite decades of research, subsidies, incentives, and intermittent regulations, there is no solution anywhere on the horizon.[7-9]
Lim, T. et. al., (2023). Increasing the Value of Animal Manure for Farmers, USDA ERS, AP-109, pp. 2-12. [“The low quantity of nutrients per ton, relative to commercial fertilizers, results in time-intensive and costly transportation. Depending on the weather, in any year, farmers may have a few days with suitable conditions that allow them to prepare fields, spread fertilizer, and plant. Crop planting takes priority, so to save time, farmers may choose commercial fertilizers rather than manure. Second, manure as excreted and after storage has a nitrogen-to-phosphorus ratio that does not align with most crops’ nutrients requirements… Manure nutrient levels vary within and across farms, so manure must be tested to be used efficiently. Manure tests measure the nitrogen and phosphorus in manure samples and have typically required sending samples to a laboratory.”]
For further info, see Economics of Manure [question: “What makes factory farm manure a liability?”]
Swaney, D. P., et al., (2018). Nitrogen use efficiency and crop production: Patterns of regional variation in the United States, 1987–2012. Science of the Total Environment, 635, 498-511, Abstract. [“…in the US, manure is still treated largely as a waste to be managed rather than a nutrient resource.”]
Note that there are many minor uses for manure that may temporarily embody nutrients in some other form, though according to our understanding, none have had a significant impact on nutrient dispersal. Uses include so-called biogas digesters. See: Lim, T., et al., (2023), pp. 48-66
See, Total Manure Nutrient Pollution
EPA 40 CFR Parts 9, 122, 123 and 68 Fed Reg. 7176 (February 2003). [This is the “final rule” that “establishes a mandatory duty for all CAFOs to apply for an NPDES permit and to develop and implement a nutrient management plan.” This rule was overturned by the courts.]
U.S. EPA (2022) EPA Legal Tools to Advance Environmental Justice, Pub. No. 360R22001, p. 75. [“Many CAFOs are not regulated and continue to discharge without NPDES permits because successive court decisions have severely limited EPA’s ability to require CAFOs to obtain an NPDES permit.”]
Del Rossi, G., et al., (2023). The economics of nutrient pollution from agriculture. Annual Review of Resource Economics, 15(1), 105-130, p. 107. [“In short, rather than seeing this as economically suboptimal, nutrient pollution from agriculture should be considered as a standard environmental externality. Agricultural enterprises optimize their private net benefits and ignore the social costs from nutrient pollution in the environment.”]
Kleinman, P. J., et al., (2019). Managing animal manure to minimize phosphorus losses from land to water. In Animal manure: Production, characteristics, environmental concerns, and management, 67 (Waldrip et al., eds.), p. 219. [“Many options exist to better manage manure, and, more specifically, P in manure, to minimize their impact on water quality. However, doing so requires comprehensive approaches that consider factors far beyond the direct handling of manure and require decisions that may compete or conflict with other priorities, most notably profits and time management.”]
Immediate Dispersal – Portions of the nitrogen in manure are dispersed into the air and soil as soon as it is excreted and continue to be lost during every stage of “manure management” regardless of management systems.[1]
Nutrient Loss from Storage Sites – Manure can leach or overflow from storage piles, enclosed manure pits, and open manure lagoons and ponds. This can be due to regular expected occurrences (like leaching), intentional releases, structural failures, or severe weather events.[2] Large amounts of nitrogen are lost throughout the storage process.[3] For example, dairy flush barns and uncovered hog lagoons lose ~80% of total excreted nitrogen prior to field application; poultry and feed cattle operations lose about 30 to 40% of manure N.[4] Phosphorus tends to sink to the bottom of storage systems where it can remain for years, eventually reaching soil or water.[5]
Manure Land-Applications – When manure is over-applied on surrounding farmland, the plants and soil cannot absorb the excess nutrients which are then carried into surface waterbodies. Manure is regularly over-applied, presumably as a method for dispersing a waste product.[6,7]
Atmospheric Deposition from Manure – Ammonia escaped into the atmosphere (NH3) comes primarily from manure on factory farms (both livestock and poultry) and is eventually deposited back in the soil or in waterways.[8,9]
Rotz, C. A. (2004). Management to reduce nitrogen losses in animal production. Journal of animal science, 82 (suppl_13), E119-E137, Table 2. [“Volatile loss begins soon after excretion, and it continues through all manure handling processes until the manure nutrients are incorporated into soil.” “The primary pathways of N loss are volatile emissions into the atmosphere and leaching and runoff losses to ground and surface waters.” pp. E-119 and 120]
Burkholder, J., et al., (2007). Impacts of Waste from Concentrated Animal Feeding Operations on Water Quality. Environmental Health Perspectives, 115(2), 308–312, p. 308 [“Contaminants from animal wastes can enter the environment through pathways such as through leakage from poorly constructed manure lagoons, or during major precipitation events resulting in either overflow of lagoons and runoff from recent applications of waste to farm fields, or atmospheric deposition followed by dry or wet fallout.”]
U.S. EPA (2002). Non-Water Quality Impact Estimates for Animal Feeding Operations, pp. 1-2. [“Nitrogen losses from animal manure as ammonia can easily exceed 50 percent.”]
Aillery, M. P., et al., (2005). Managing manure to improve air and water quality. USDA ERS Rpt 9, Table 2-1, p. 12.
Lim, T., et al., (2023). Increasing the Value of Animal Manure for Farmers, USDA Economic Research Service, AP-109, p. 13. [“Nitrogen can volatilize before being land-applied, and phosphorus can settle to the bottom of lagoons where it may remain for years.”]
Lim, T., et al., (2023), Table 2, Figure 4. [The great majority of manure was applied to corn crops; more than half of corn producers that land-applied manure did not reduce their normal usage of chemical fertilizer.]
Ribaudo, M., et al., (2017). The potential role for a nitrogen compliance policy in mitigating Gulf hypoxia. Applied Economic Perspectives and Policy, 39(3), 458-478, p. 12. [USDA scientists acknowledge that, “Farms with confined animals generally have inadequate cropland to assimilate nutrients produced, and are characterized by excess nutrient applications on cropland they control.”]
U.S. EPA (2024). 2020 NEI Supporting Data and Summaries – Data Queries for Sector Summaries. [Query: National/Ammonia NH3/Livestock Waste (49.2%), fertilizer application (33.5%), agricultural field burning (2.7%)]
Robertson, D. M. & Saad, D. A. (2021). Nitrogen and phosphorus sources and delivery from the Mississippi/Atchafalaya River basin: An update using 2012 SPARROW models. JAWRA, 57(3), 406-429, Figure 5, p. 18. [Atmospheric manure nutrients are the source of ~13% of nitrogen in waterways.]
Fertilizer on Feed Crops – The applications of chemical nitrogen and phosphorus fertilizers on feed crops, including corn and soybeans, have consistently far exceeded crop requirements.[1] In the U.S., roughly calculated, ~30 to 40% of the chemical fertilizers applied to crops are lost to the environment.[2,3] Chemical fertilizers applied in excess of crop needs contaminate surface waters through runoff or by leaching into groundwater.[4,5]
Landscape Modifications – Artificial drainage techniques, including ditches and subsurface drains, are used on ~25% of the nation’s cropland, including feed crops. Runoff water moves quickly through these drains carrying nutrients and other contaminants from the fields directly to nearby streams.[6,7]
Hellerstein, D., et al., (2019). Agricultural Resources and Environmental Indicators, USDA Economic Research Service, Bulletin 208, pp. 45-46. [“Nutrient recovery is the ratio of the amount of nutrient in the harvested crop to the amount of nutrient applied.” Corn N recovery = 76%. Soybeans N = 46%. Corn P = 65%. Soybeans P = 58%]
Hellerstein, D., et al., (2019), p. 42. [“Since 1997, nitrogen recovery rates (the share of applied nutrient taken up by the harvested crop) on corn, winter wheat, and cotton have hovered around 70 percent, while recovery rates for phosphate have remained around 60 percent.”]
van Grinsven, H. J., et al., (2015). Losses of ammonia and nitrate from agriculture and their effect on nitrogen recovery in the European Union and the United States between 1900 and 2050. Journal of environmental quality, 44(2), 356-367. [“In 2005, (N recovery efficiency) was 60% for total agriculture and 66 and 69% for arable land for the European Union and the United States, respectively.”]
Capel, P., et al. (2018). Agriculture – A River Runs Through It – the Connections between Agriculture and Water Quality. U.S. Geological Survey, National Water-Quality Assessment Project, Circular 1433, p. 1. [“Typically, 5 to 50 percent of applied nitrogen moves from fields to streams through runoff and through groundwater discharge.”]
Sharpley, A., et al., (2013). Phosphorus legacy: overcoming the effects of past management practices to mitigate future water quality impairment. Journal of environmental quality, 42(5), 1308-1326, p. 1308. [“Accumulated P can be remobilized or recycled, acting as a continuing source to downstream water bodies for years, decades, or even centuries.”]
Capel, P., et al., (2018), p. 6. [“About 25 percent of the cropland in the country has artificial drainage—surface (ditches) and subsurface (tiles)… Nitrogen export in streams with substantial subsurface drainage in their watersheds is slightly more than three times larger than in other agricultural streams in the Nation.”]
Chris Torres (Ed.) (May 9, 2023) Tiling and nutrient runoff: An uneasy relationship, American Agriculturist Farm Progress.
In the U.S., roughly calculated, ~30-40% of the chemical fertilizer nutrients applied to crops are lost to the environment.[1-3]

Globally, the figure is generally reported at ~50% for nitrogen, and ~30% for phosphorus.[4-6]
Nutrient use efficiency is the share of applied nutrient taken up by the harvested crop. The inverse proportion is the share lost to the environment.[7,8]
Hellerstein, D. & Vilorio, D. (2019). Agricultural resources and environmental indicators, 2019. USDA ERS, p. 42. [“Since 1997, nitrogen recovery rates (the share of applied nutrient taken up by the harvested crop) on corn, winter wheat, and cotton have hovered around 70 percent, while recovery rates for phosphate have remained around 60 percent.”]
van Grinsven, H. J., et al., (2015). Losses of ammonia and nitrate from agriculture and their effect on nitrogen recovery in the European Union and the United States between 1900 and 2050. Journal of environmental quality, 44(2), 356-367. [“In 2005, (N recovery efficiency) was 60% for total agriculture and 66 and 69% for arable land for the European Union and the United States, respectively.”]
Note: Estimates vary widely. They sometimes include manure nutrients and sometimes include only chemical fertilizers. Rather than offering precise figures, the point is simply that large amounts of fertilizer are applied, generally in excess of what can be used by crops. The remainder creates nutrient pollution.
Cropland nutrient balance – Global, regional and country trends, 1961–2023, FAOSTAT Analytical Brief 117, pp. 3-4. [“…nitrogen use efficiency has increased to 54 percent in the most recent decade… Phosphorus use efficiency… in the most recent decade is at an all-time high of 69 percent.”]
Lassaletta, L., et al., (2014). 50 year trends in nitrogen use efficiency of world cropping systems: the relationship between yield and nitrogen input to cropland. Environmental Research Letters, 9(10), 105011, p. 7. [“Currently, only 47% of the reactive nitrogen added globally onto cropland is converted into harvested products… This means that more than half the nitrogen used for crop fertilization is currently lost into the environment.”]
Rockström, J., et al., (2025). The EAT–Lancet Commission on healthy, sustainable, and just food systems. The Lancet, 406(10512), 1625-1700, p. 21. [“Increasing nitrogen use efficiency from 48% (the current global average) to an achievable 67% could bring us close to the safe operating space without compromising yield.”]
Cropland nutrient balance – Global, regional and country trends, 1961–2023, p. 3. [“Nutrient use efficiency, calculated as the ratio of nutrient removal from crops to total nutrient input, is a measure of how well crops use available nutrients.”]
Hellerstein, D. & Vilorio, D. (2019), p. 45. [“Partial recovery occurs when the amount applied exceeds the amount that plants can absorb, resulting in environmental loss.”]
Common feed crops, including soybeans, alfalfa, and some other types of hay are legumes that can convert nitrogen from the air into forms of nitrogen that can be used for plant growth.[1]
This biological nitrogen fixation (BNF) contributes ~30% of total U.S. agricultural inputs of nitrogen.[2] A significant share of this nitrogen creation turns into nutrient pollution.[3,4]
About 80% of agricultural N fixation is attributed to that share of crops specifically going to feed, mostly soybeans, alfalfa, and other types of hay.[5] The factory farming system has been supported by large increases in soybean and forage crop production, which has been a significant factor in the intractable water pollution problems in the U.S.[6]
Frans J. de Bruijn (ed.) (2015). Biological Nitrogen Fixation, ISBN:9781118637043, p. xiii. [“The best known and most extensively studied example of biological nitrogen fixation is the symbiotic interaction between nitrogen-fixing “rhizobia” and legume plants. Here, the rhizobia induce the formation of specialized structures (“nodules”) on the roots or sometimes stems of the legume plant and fix nitrogen, which is directly assimilated by the host plant; in return, the plant provides the required energy source for the energy-intensive, nitrogen-fixation process.”]
Brehob, M. M., et al., (2025). The US EPA’s National Nutrient Inventory: Critical Shifts in US Nutrient Pollution Sources from 1987 to 2017. Environmental Science & Technology, p. E. [“The largest contributor to agricultural N inputs was farm fertilizer (45%), followed by crop N fixation (30%) and manure (25%).”]
Robertson, D. M. & Saad, D. A. (2021). Nitrogen and phosphorus sources and delivery from the Mississippi/Atchafalaya River basin: An update using 2012 SPARROW models. JAWRA Journal of the American Water Resources Association, 57(3), 406-429, figure 5, p. 418. [Agricultural sources contributed, “73.2% of the N (25.9% — fertilizers, 28.9% — manure, and 18.4% — fixation)…”]
U.S. EPA (2011). Reactive Nitrogen in the United States, p. 22. [“Management of biologically fixed N, insofar as it is possible, is proportionally as critical a task as the management of synthetic N because Nr from BNF is prone to the same loss pathways as Nr from commercial fertilizers.”]
U.S. EPA (2011). Reactive Nitrogen in the United States, Table 4, p. 22. [Report estimates the total nitrogen inputs of crop fixation, with ~99% from crops used primarily for feed. See, Table 4, p. 22. After updating some of these acreage figures, we broadly estimate that ~80% is specifically for animal feed. For more information, see, Animal Ag Contributions to Water Pollution
Robertson, D. M. & Saad, D. A. (2021), figure 5, p. 418. [For example, almost 20% of the nitrogen pollution affecting the Gulf of Mexico is from agricultural fixation. Agricultural sources contributed, “73.2% of the N (25.9% — fertilizers, 28.9% — manure, and 18.4% — fixation)…”]
Feed crop production – especially corn and soybeans – has expanded onto lands that are naturally too wet, too dry, or have low soil fertility.[1] Croplands that require irrigation, drainage, or extra fertilization, tend to accelerate nutrient pollution.[2] Irrigation taken from nearby waterways can deplete water flows and thereby increase nutrient concentrations in lower water volumes leading to high levels of eutrophication.[3]
According to the USDA’s 2023 Irrigation and Water Management Survey, corn, soybeans, and alfalfa accounted for ~60% of all irrigated acres harvested.[4]
Lark, T. J., et al., (2020). Cropland expansion in the United States produces marginal yields at high costs to wildlife. Nature communications. 11 (1), 4295. [“We found that croplands are moving onto lower-quality land in less-suitable regions—a dual setback to production gains from cropland expansion.”]
Capel, P., et al., (2018). Agriculture – A River Runs Through It – the Connections between Agriculture and Water Quality, National Water-Quality Assessment Project, Circular 1433, U.S. Geological Survey, p. 165. [“Agricultural modifications such as drainage and irrigation, substantially change the water flowpaths compared to the natural hydrologic system, and can quickly move agricultural chemicals to the stream.”]
Richter, B., et al., (2020). Water scarcity and fish imperilment driven by beef production. Nature Sustainability, 3(4), 319–328, p. 320. [“…human-induced flow reductions can concentrate problematic nutrient and chemical conditions, leading to eutrophication or depleted oxygen levels that are hazardous to fish and other aquatic organisms.”]
USDA NASS (2024) Census of Agriculture, 2023 Irrigation and Water Management Survey, Vol 3, AC-22-SS-1, Table 38. [See, Water Usage by Feed Crops [question: “How many acres of crops primarily used for animal feed are irrigated?” These crops accounted for ~61% of all harvested irrigated acres in 2023.]
Along with nutrient pollution, the other major water pollutants from animal ag come from factory farm manure and from pesticides on feed crops.
Manure – There are so many pollutants in manure that the subject can become overwhelming. Along with nutrient pollution, the range of pollutants includes antibiotics, hormones, pathogens, and heavy metals.[1-4]
There is little information on which to base estimates of the relative risks of these various pollutants. It is dependent on the areas of focus, including human health risk, economic impact, or ecosystem damage and biodiversity loss. The two largest risks to humans are likely:[5]![]() Antimicrobial resistance from the immense share of total antibiotic usage on factory farms.[6]
Antimicrobial resistance from the immense share of total antibiotic usage on factory farms.[6]![]() Pathogens with zoonotic potential, i.e., that can be transferred to humans from animals.[7]
Pathogens with zoonotic potential, i.e., that can be transferred to humans from animals.[7]
Pesticides – This also a complex subject due to the number of herbicides and insecticides, their varied impacts on humans, other animals, and ecosystems, along with their myriad and unstudied interactions. However, it can be said with certainty that an immense share of these pesticides are applied to feed crops, including:
![]() Glyphosate – about 70% of total glyphosate usage is applied to the 2 largest feed crops, corn and soybeans.[8]
Glyphosate – about 70% of total glyphosate usage is applied to the 2 largest feed crops, corn and soybeans.[8]![]() Atrazine – about 80% or more of total atrazine is applied to corn.[9]
Atrazine – about 80% or more of total atrazine is applied to corn.[9]![]() Neonics – about 75% of total neonic applications are on corn and soybeans.[10]
Neonics – about 75% of total neonic applications are on corn and soybeans.[10]
Damages to plants and animals are well documented.[11]
U.S. EPA (2013). Literature Review of Contaminants in Livestock and Poultry Manure and Implications for Water Quality, Key pollutants from livestock operations and animal manure, 820-R-13-002, p.1 and Table 1-1. [“Manure often contains pathogens (many of which can be infectious to humans), heavy metals, antimicrobials, and hormones that can enter surface water and ground water through runoff and infiltration potentially impacting aquatic life, recreational waters, and drinking water systems.”]
Animal Manure: Production, Characteristics, Environmental Concerns and Management (2019). Waldrip, H.M. et al., (eds.) American Society of Agronomy, Special Publication 67, Madison, WI, p. vii. [“…inappropriately managed animal manure may present significant environmental risks, including eutrophication/contamination of surface and subsurface water sources, emissions of greenhouse gases and air pollutants, contamination of ecosystems with antibiotic residues, antibiotic-resistant microbial genes and pathogens, as well as other health and quality-of-life-related issues.”]
Rogers, S. & Haines, J. (2005). Detecting and mitigating the environmental impact of fecal pathogens originating from confined animal feeding operations, U.S. EPA, 600/R-06/021, p. 1. [“Animal wastes contain zoonotic pathogens, which are viruses, bacteria, and parasites of animal origin that cause disease in humans. Diseases that can be caused by zoonotic pathogens include Salmonellosis, Tuberculosis, Leptospirosis, infantile diarrheal disease, Q-Fever, Trichinosis, Cryptosporidiosis, and Giardiasis to name a few.”]
Hubbard, L. E., et al., (2020). Poultry litter as potential source of pathogens and other contaminants in groundwater and surface water proximal to large-scale confined poultry feeding operations. Science of The Total Environment, 735, 139459, p. 6. [USGS scientists report: “Our results are consistent with previous studies that have demonstrated that surface water is susceptible to a wide variety of contaminants from confined animal feeding operations…”]
U.S. EPA (2013) Literature Review of Contaminants in Livestock and Poultry Manure and Implications for Water Quality. For a review of each category of pollutants, see: Chapter 6, pp. 47-63.
See, Antibiotic and Animal Ag
See, Zoonoses & Animal Ag
See, Herbicide Use on Feed Crops [question: What share of glyphosate is applied to corn and soybeans?]
See, Herbicide Use on Feed Crops [question: What share of atrazine is applied to corn?]
See, Neonics Use on Feed Crops
See, Herbicide Harm to Biodiversity and Insecticide (Neonics) Harm to Biodiversity