1. Nutrient pollution (excess nitrogen and phosphorus) is one of the most serious environmental problems in the U.S. and globally.
2. Quantifying the significant amounts of manure nutrients (N & P) is an important step in understanding the scope of the problem.
3. The total N & P in farmed animal manure is equal to ~75% of the total N & P in all chemical fertilizers.
4. The total N & P in concentrated manure generated on factory farms is equal to ~40% of the total N & P in chemical fertilizers.
5. Most of these factory farm manure nutrients escape into the environment, so giving context to the size of the problem helps us understand one of the central negative externalities of factory farming.
Most of the nitrogen and phosphorus in factory farm manure enters the environment, causing myriad problems in air, water, and soil.[1] Nutrient pollution, caused by excess N & P, is one of the largest environmental threats in the U.S. and globally.[2-4]
The dispersal of these manure nutrients (once highly valued) is one of the central negative externalities of industrial animal ag.[5,6] Quantifying the amounts of manure nutrients (N & P) is an important step in understanding the scope of the problem. Comparing the amounts to those in chemical fertilizers provides context.
See, Total Manure Nutrient Pollution
U.S. EPA (2023) Nutrient Pollution. https://www.epa.gov/nutrientpollution [“Nutrient water pollution is one of the most widespread and challenging environmental problems faced by our nation.”]
Richardson, K., et al., (2023). Earth beyond six of nine planetary boundaries. Sci. Adv. 9 eadh2458, p. 5, Table 1. [Nutrient pollution has exceeded boundaries for planetary health by a factor of 2 or 3. The P boundary set at 11 Tg with current use at 22.6 Tg. The N boundary at 62 Tg, with current use at 190 Tg.]
Sutton, M. A., et al., (2021). The nitrogen decade: mobilizing global action on nitrogen to 2030 and beyond. One Earth, 4(1), 10-14, p. 10. [“By massively increasing the supply of nitrogen compounds, humans are worsening air and water quality, contributing to climate change and stratospheric ozone depletion, and thereby threatening health, biodiversity, and livelihoods.”]
Kleinman, P. J. A., et al., (2019). Managing Animal Manure to Minimize Phosphorus Losses from Land to Water, in Animal Manure: Production, Characteristics, Environmental Concerns and Management, Waldrip, H.M. et al. (eds.) American Society of Agronomy, Special Publication 67, Madison, WI, p. 201. [According to this group of experts that includes USDA scientists, “No sector in agriculture has been more closely tied to the accelerated eutrophication of aquatic systems than animal agriculture, principally as a result of the generation and management of manure.”]
For further info, see, Size of Nutrient Pollution Problem and Animal Ag’s Contributions to Water Pollution
About 14 billion pounds of nitrogen and 4 billion pounds of phosphorus were excreted in farmed animal manure in 2017.[1-4] These are still reasonable estimates in 2025.[5,6]
U.S. EPA (2023) Estimated Animal Agriculture Nitrogen and Phosphorus from Manure
https://www.epa.gov/nutrientpollution/estimated-animal-agriculture-nitrogen-and-phosphorus-manure [2017 totals: 14,201,994,389 pounds of N, and 4,294,399,611 pounds of P. State figures are totaled for cattle, swine, poultry (chickens and turkeys), sheep, and horses.]Falcone, J. A., (2021). Estimates of county-level nitrogen and phosphorus from fertilizer and manure from 1950 through 2017 in the conterminous United States, U.S. Geological Survey Open-File Report 2020–1153, See Figure 4 and web data. [For 2017 N = 14,691,040,502 lbs. P = 4,370,048,493 lbs.]
Gollehon, N. R., et al., (2016). Estimates of recoverable and non-recoverable manure nutrients based on the census of agriculture—2012 results. USDA Natural Resources Conservation Services, Washington, DC, tables 3 & 4, p. 10. [2012 totals: (N) 16,167,734,000 and (P) 4,527,395,000]
Bian, Z., et al., (2021). Production and application of manure nitrogen and phosphorus in the United States since 1860. Earth System Science Data, 13(2), 515-527. [For 2012, N = 13,360,013,088. P = 4,144,690,529.]
FAOSTAT, Land, Inputs and Sustainability/ Inputs / Livestock Manure/ Amount excreted in manure (N content)/ [For 2017 N = 13,939,058,072. For 2023, N = 13,448,773,149]
Meat and dairy consumption are at or close to all-time highs for 2024. See, Per Capita Meat Consumption and Per Capita Dairy & Egg Consumption
The total N & P in farmed animal manure is ~75% of all N & P in chemical fertilizers.[1]
Broadly estimated, chemical fertilizer amounts for 2017 were about 26 billion pounds of N and about 4 billion pounds of P.[2-4] These are still reasonable estimates for annual use.[5]
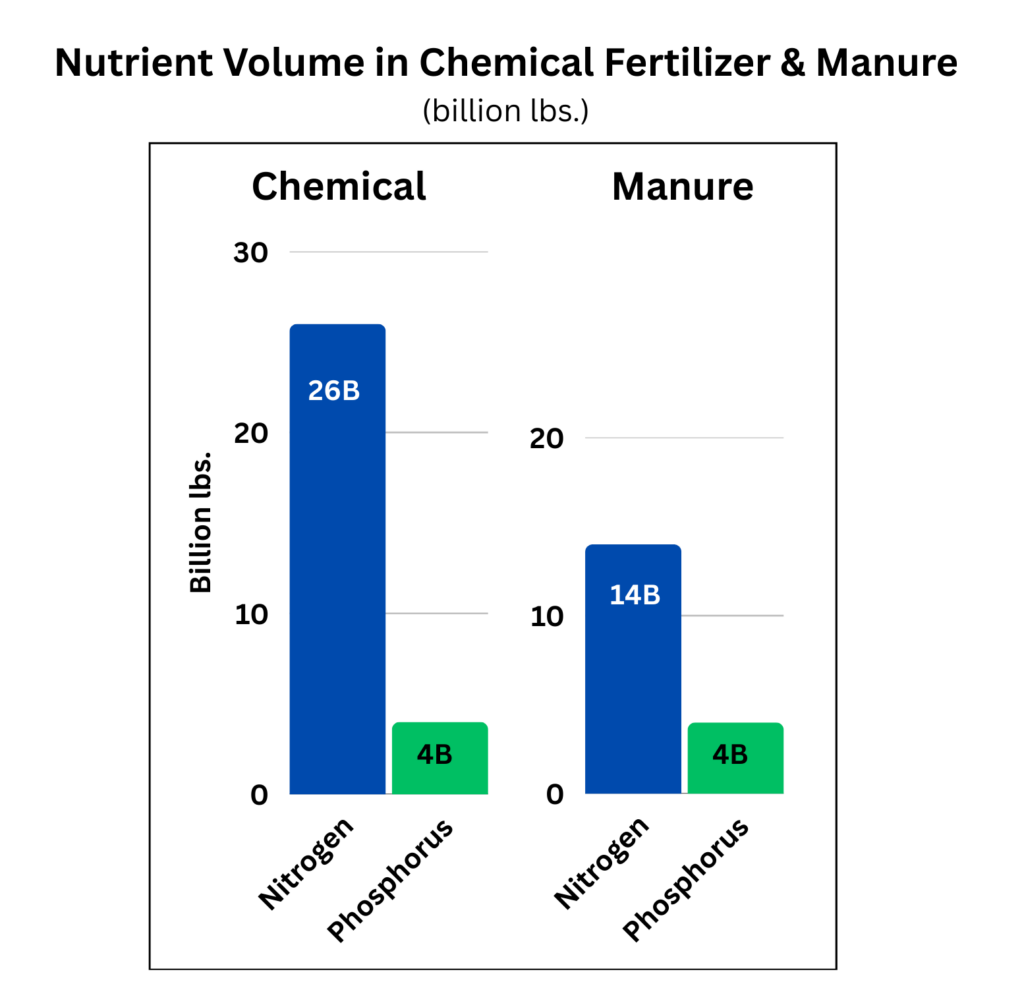
Calculation: Manure N of 14B / Chemical N of 26B = ~54%. Manure P = Chemical P or ~100%. Average of 77%. We assess the weights independently (not adding N and P together) since it is widely understood that the smaller volumes of P are as potent environmentally as the larger volumes of N.
U.S. EPA (2023) Commercial Fertilizer Purchased. https://www.epa.gov/nutrientpollution/commercial-fertilizer-purchased#table1 [State totals were added to reach figures for 2017: 26,062,016,614 lbs. of nitrogen and 8,761,934,424 lbs. of phosphate which = 3,828,965,343 lbs. of phosphorus. (phosphate * .437 = phosphorus)]
International Fertilizer Association (IFASTAT) (2025). Database: Consumption. https://www.ifastat.org/databases/plant-nutrition [2017 N = 26.06B lbs. P = 4.14B lbs.]
Falcone, J. A. (2021). Estimates of county-level nitrogen and phosphorus from fertilizer and manure from 1950 through 2017 in the conterminous United States, U.S. Geological Survey Open-File Report 2020–1153, See Figure 4 and web data. [For 2017, N = 27,800,918,076 lbs. P = 4,362,751,788 lbs.]
International Fertilizer Association (IFASTAT) (2025). Database: Consumption. [2023 N = 25.62B lbs. P = 3.74B lbs.]
According to USDA studies, about 64% of the nitrogen and 48% of the phosphorus in total animal manure is from confined animals on AFOs. Conversely, ~36% of nitrogen from all farmed animals is released on pasture, along with ~52% of phosphorus. These were the estimated percentages in 2012. Since the study specifies AFO operations that confine animals, we consider these factory farms.[1,2]

These figures should be viewed as broad estimates. The increasing consolidation of animals has likely led to a greater share of manure on factory farms (as opposed to pasture). Dairy cows, for example, are even more highly concentrated indoors with very few on pasture.[3] This trend may be offset by changes in diets, leading to reductions in the levels of excreted nutrients for some animal types.[4]
Gollehon, N. R., et al., (2016). Estimates of recoverable and non-recoverable manure nutrients based on the census of agriculture—2012 results, USDA Natural Resources Conservation Services, Washington, DC, tables 3 & 4, p. 10. [Total nitrogen from AFOs equals 63.5% of nitrogen from all farmed animals. Total phosphorus from AFOs equals 48.3% of phosphorus from all farmed animals. We apply these 2012 percentages to 2017 EPA data on total nutrients from animal manure. For (N) .64 * 14B = ~9. For (P) 4 * .48 = ~2.]
Note: We rely on the Gollehon report as highly credible, from USDA scientists that spent decades in this area of research. Other reports have similar or in some cases, higher percentages for the shares of nutrients on AFOs. See, for example, Glibert, P. M. (2020). From hogs to HABs: impacts of industrial farming in the US on nitrogen and phosphorus and greenhouse gas pollution. Biogeochemistry, 150(2), 139-180. [AFO N estimated at 8.8B lbs (similar to chart) and P at 3.1B lbs. (higher than chart) at pp. 154-155]
Comparing USDA Census of Ag from 2012 to 2022 (Table 12), dairy farms with fewer than 200 cows went from 28% to 13% of total cow inventory. Larger operations tend to raise cows exclusively indoors.
Kleinman, P. J. A., et al., (2019). Managing Animal Manure to Minimize Phosphorus Losses from Land to Water, in Animal Manure: Production, Characteristics, Environmental Concerns and Management, Waldrip, H.M. et al. (eds.) American Society of Agronomy, Special Publication 67, Madison, WI, pp. 207-208.
The total N & P in concentrated factory farm manure is ~40% of all N & P in chemical fertilizers.[1]
The dispersal of the great majority of these manure nutrients is one of the central negative externalities of industrial animal ag. Nutrient pollution degrades air, soil, and water.[2]
Quantifying the amounts is an important step in understanding the scope of the problem. Comparing the amounts to those in chemical fertilizers provides context. See the following post for calculations about the quantity of manure nutrients escaping into the environment.[3]
Calculation: N from factory farm manure = 9B/26B = 35%. P from factory farm manure = 2B/4B = 50%. Therefore 50 + 35 / 2 = 42.5%. Again, we assess the weights independently (not adding N and P together) since it is widely understood that the smaller volumes of P are as potent environmentally as the larger volumes of N.
See, Nutrient Pollution of Waterways
See, Total Manure Nutrient Pollution