Chemical fertilizers are a significant and persistent source of environmental damage. They are a primary cause of nutrient pollution. According to the EPA, nutrient pollution from excess nitrogen and phosphorus is “one of America’s most widespread, costly, and challenging environmental problems.”[1]
Large shares of chemical fertilizers are applied to feed crops. About half of all nitrogen and three-quarters of all phosphorus in U.S. chemical fertilizers are applied to corn and soybeans.[2] This causes much of the pollution of the nation’s waterways. More than 40% of the nation’s lakes, rivers and streams are rated “poor” for nitrogen and phosphorus pollution, in large part due to heavy fertilizer applications on feed crops.[3]
Additionally, about one-third of newly created reactive nitrogen is attributed to the share of crops used specifically for feed, with chemical fertilizers responsible for about 20% of the total reactive nitrogen creation.[4] The ongoing cycle of excess nitrogen damages, known as the nitrogen cascade, is a major reason why animal ag’s demand for chemical fertilizers is so costly to all ecosystems.[5]
EPA (n.d.) The Facts about Nutrient Pollution. https://midwestadvocates.org/wp-content/uploads/nutrient_pollution_factsheet.pdf [Note: EPA’s current website page on Nutrient Pollution (as of 4/5/25), the word “costly” has been omitted.]
See, nutrients applied to feed crops in Fertilizer Use on Feed Crops
See, Pollution of Lakes, Rivers, & Streams
See, Nitrogen and Air Quality [Broadly estimated, all crop production is responsible for about two-thirds of new reactive nitrogen. Chemical fertilizers are about 60% and fixation about 40%. Crops used specifically for feed are estimated at about half of all crops. Therefore: (.67 * .6 * .5) = ~20%. This may be an underestimate because corn (the largest crop and the primary feed crop) uses just under half of all nitrogen chemical fertilizer.]
Galloway, J. N., et al., (2003). The nitrogen cascade. Bioscience, 53(4), 341-356. [“The same atom of Nr can cause multiple effects in the atmosphere, in terrestrial ecosystems, in freshwater and marine systems, and on human health. We call this sequence of effects the nitrogen cascade.” Abstract]
Nutrients from chemical fertilizers – nitrogen and phosphorus – enter soil, air, and water via leaching, runoff, volatilization, and more generally, due to over-applications in excess of crop needs.
Nitrogen pollution into waterways is mostly a result of leaching, runoff, and erosion. Irrigation practices add to the likelihood of runoff. Nitrogen from chemical fertilizers is also dispersed into the air in the form of ammonia and nitrous oxide.[1]
Excess phosphorus pollutes waterways when erosion and heavy rains disperse sediment.[2] Over time, phosphorus builds up in many soils, and pollution due to runoff can continue for decades without further input.[3]
U.S. EPA (2011) Reactive Nitrogen in the United States: An Analysis of Inputs, Flows, Consequences, and Management Options: A Report of the EPA Science Advisory Board, EPA-SAB-11-013, p. 15. [“The major pathways by which Nr is lost from these systems include NO3 – losses from leaching, runoff and erosion and gaseous emissions via volatilization of NH3 and NOx and nitrification/denitrification.”]
Sharpley, A. N. & Beegle, D. (2001). Managing phosphorus for agriculture and the environment. College of Agricultural Sciences, The Pennsylvania State University, University Park, PA, p. 8.
Sharpley, A., et al., (2013). Phosphorus legacy: overcoming the effects of past management practices to mitigate future water quality impairment. Journal of environmental quality, 42(5), 1308-1326, p. 1308. [“Accumulated P can be remobilized or recycled, acting as a continuing source to downstream water bodies for years, decades, or even centuries.”]
Crop yield is directly influenced by nutrient levels. For producers, reducing nitrogen and phosphorus applications risks economic losses, while larger inputs ensure higher yields along with risking environmental damages.[1]
Crop producers often apply extra fertilizer due to the loss (or expectation of loss) of nutrients caused by runoff from heavy rains. They may also apply excess fertilizer to compensate for runoff from drainage systems.[2,3]
U.S. EPA (2011) Reactive Nitrogen in the United States: An Analysis of Inputs, Flows, Consequences, and Management Options: A Report of the EPA Science Advisory Board, EPA-SAB-11-013, p. 20.
Houser, M. & Stuart, D. (2020). An accelerating treadmill and an overlooked contradiction in industrial agriculture: Climate change and nitrogen fertilizer. Journal of Agrarian Change, 20(2), 215–237.
Ribaudo, M., et al., (2011) USDA Economic Research Service Report. Nitrogen in Agricultural Systems: Implications for Conservation Policy No.127, p. 16.
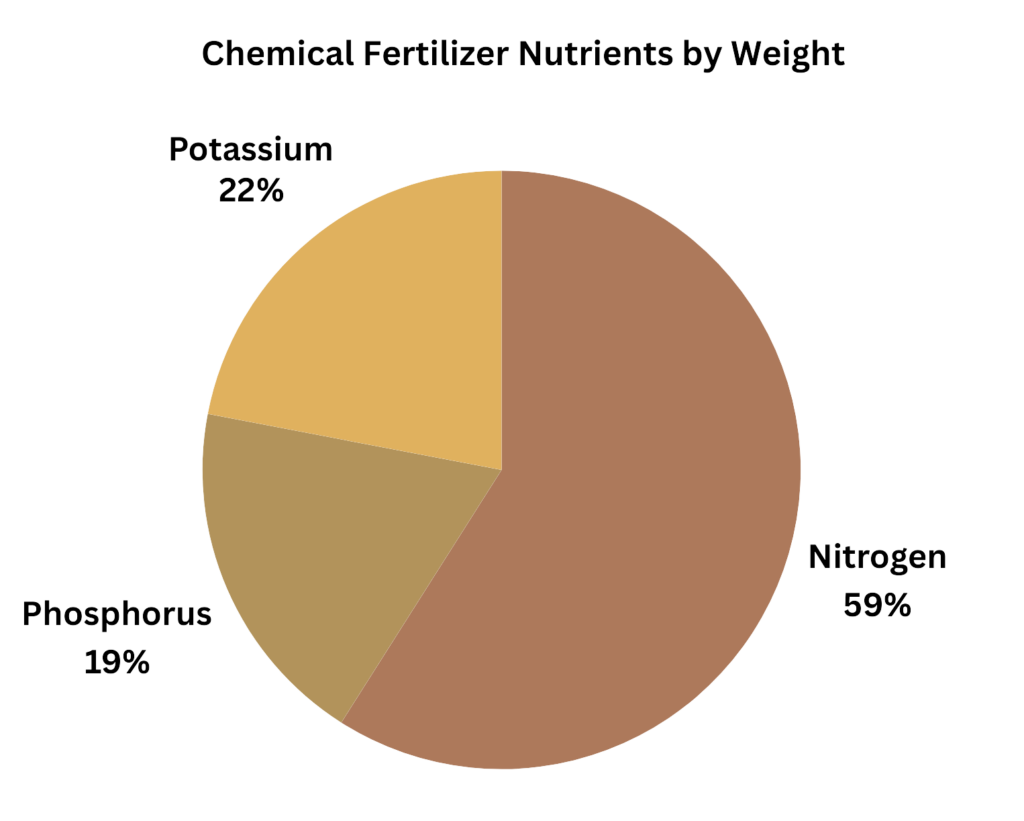
Commercial chemical fertilizers are almost entirely made up of 3 macro nutrients: nitrogen, phosphorus, and potassium. By weight, nitrogen makes up about 59% of the total U.S. usage, phosphorus about 19%, and potassium about 22%.[1,2]
The nutrients are generally referred to as N (nitrogen) P (phosphorus) and K (potassium). The total U.S. use of N,P,K obtained from FAOSTAT. [Inputs/Fertilizers by Nutrient/United States/2021 & 2022]
These ratios are identical to the overall ratios in total corn and soy usage from: USDA NASS Quick Stats, Survey/Environmental/Crop/Fertilizer/Applications [Using 2021 for corn and 2023 for soybeans: N= 25.5, P = 8.3, K = 9.6 = Total of 43.3. (25.5/43.3 = 58.9%; 8.3/43.3 = 19.2%; 9.6/43.3 = 22.2%)]
Nitrogen – Very broadly estimated, about a third of the nitrogen applied to feed crops escapes into the environment during the crop production cycle.[1-4]
Phosphorus – Because most excess phosphorus builds up in the soil (known as legacy phosphorus) there is not a clear connection between application rates and runoff quantities. Large amounts of phosphorus continue to pollute waterways due to current applications as well as legacy contributions.[5,6]
Hellerstein et al., USDA, Economic Research Service (2019) Agricultural Resources and Environmental Indicators, 2019, Bulletin 208, p. 45. [In 2015 corn lost 24% of applied N to the environment. In 2011 soybeans lost 54%. Note: Analyses vary, most are not current and are not generally crop-specific. Manure nitrogen is likely included in these analyses, though it is ~5% of total nitrogen applications to crops; ~1 billion pounds versus ~25 billion pounds.]
Davidson, E. A., et al., (2011). Excess nitrogen in the US environment: trends, risks, and solutions. Issues in ecology, (15), p. 1. [“Approximately half of all nitrogen applied to boost agricultural production escapes its intended use and is lost to the environment.”]
Zhang, X., et al., (2015). Managing nitrogen for sustainable development. Nature, 528(7580), 51-59, Table 1. [Notes 32% nitrogen loss in 2010 for “USA and Canada”]
Gu, B., et al., (2023). Cost-effective mitigation of nitrogen pollution from global croplands. Nature, 613(7942), 77-84, p. 77. [Globally, “more than half of these N inputs to croplands are lost to air and water…”]
Sharpley, A., et al., (2013). Phosphorus legacy: overcoming the effects of past management practices to mitigate future water quality impairment. Journal of environmental quality, 42(5), 1308-1326, p. 1308. [“Accumulated P can be remobilized or recycled, acting as a continuing source to downstream water bodies for years, decades, or even centuries.”]
Stackpoole, S. M., et al., (2019). Variable impacts of contemporary versus legacy agricultural phosphorus on US river water quality. PNAS, 116(41), 20562-20567.
Chemical fertilizers and manure are the primary sources of the high levels of nitrogen (N) and phosphorus (P) in lakes, rivers and streams, and other waterways.[1,2] More than 40% of rivers, and streams are rated poor for both nitrogen and phosphorus levels.[3] More than 45% of lakes are rated poor for N & P levels.[4] Excess N and P depletes oxygen by stimulating plant growth – a process called eutrophication. High nutrient levels are considered by the EPA to be “the leading cause of use impairment in U.S. waters.”[5]
Too much nitrogen and phosphorus in the water causes algae to grow faster than ecosystems can handle. “Significant increases in algae harm water quality, food resources and habitats, and decrease the oxygen that fish and other aquatic life need to survive.”[6]
Chemical fertilizers also contribute to air pollution, mostly through ammonia emissions. Ammonia is an air pollutant at the local level and also creates PM2.5 which is the primary air pollutant at the regional and national levels.[7,8] Nitrous oxide is also generated from chemical fertilizers, generating about 10% of total U.S. agricultural GHG emissions.[9]
U.S. Geological Survey (2019) Agricultural Contaminants in Water Resources. [“Agriculture is the leading source of impairments in the Nation’s rivers and lakes. About a half million tons of pesticides, 12 million tons of nitrogen, and 4 million tons of phosphorus fertilizer are applied annually to crops in the continental United States.”]
Robertson, D.M. & Saad, D.A. (2019) U.S. Geological Survey. Spatially Referenced Models of Streamflow and Nitrogen, Phosphorus, and Suspended-Sediment Loads in Streams of the Midwestern United States, Investigations Report 2019–5114, Figure 5, https://doi.org/10.3133/sir20195114. [For nitrogen, manure may be a slightly larger source, after taking into account atmospheric deposition from manure. For phosphorus, fertilizers are the larger source.]
U.S. EPA (2023) National Rivers and Streams Assessment 2018–2019, Data Dashboard (on-line only) https://www.epa.gov/national-aquatic-resource-surveys/nrsa
U.S. EPA (2024) National Lakes Assessment: The Fourth Collaborative Survey of Lakes in the United States, EPA 841-R-24-006. Chemical Indicators/Nutrients, Exhibits 24, 25.
U.S. EPA (2015) A Compilation of Cost Data Associated with the Impacts and Control of Nutrient Pollution, EPA 820-F-15-096, p. I.1.
EPA (n.d.) The Facts about Nutrient Pollution. https://midwestadvocates.org/wp-content/uploads/nutrient_pollution_factsheet.pdf
U.S. EPA (2024) 2020 NEI Supporting Data and Summaries – Data Queries for Sector Summaries [Query: National/Ammonia NH3/Livestock Waste (49.2%), fertilizer application (33.5%), agricultural field burning (2.7%) of total (5,482,484 tons)]
Wyer, K. E., et al., (2022). Ammonia emissions from agriculture and their contribution to fine particulate matter: A review of implications for human health. Journal of Environmental Management, 323, 116285–116285, p. 7. [“There is currently a chain that exists between NH3 emissions, the formation of PM2.5, and the subsequent impacts that this PM2.5 has on human health.”]
EPA (2024) Inventory of U.S. Greenhouse Gas Emissions and Sinks: 1990-2022, EPA 430-D-24-004, Table 5-17. [N20 from chemical fertilizers = 62.0 million metric tonnes CO2 eq. / 593.4 = 10.4%]
Nutrient pollution of waterways has a major impact on all aquatic life. The EPA confirms that for lakes, rivers, and streams, poor biological condition is more likely when waterbodies are rated poor for nutrient pollution.[1,2]
Monitoring and quantifying the impacts of excess N and P on biodiversity is challenging. As one researcher notes, “Among the most difficult, and therefore least understood, issues with regard to eutrophication and nutrient pollution is the relationship between changes in nutrients and changes in biodiversity.”[3] Another report refers to anthropogenic changes to N and P flows as a “global fertilization experiment.”[4]
Despite the challenges of quantifying the impacts, it can be said that these nationwide experiments with N and P “fundamentally impact biota at all levels from genes and genomes to ecosystems, reshaping ecological and ultimately ecosystem processes.”[5,6]
U.S. EPA (2023) National Rivers and Streams Assessment: The Third Collaborative Survey. EPA 841-R-22-004. Office of Water and Office of Research and Development. [“Biological condition is the “presence, number, and diversity of macroinvertebrates, fish, and other organisms.“ “Poor biological condition was more likely when rivers and streams were in poor condition for nutrients.”]
U.S. EPA (2022) National Lakes Assessment: The Third Collaborative Survey of Lakes in the United States. EPA 841-R-22-002. Office of Water and Office of Research and Development.
Glibert, P. M. (2017). Eutrophication, harmful algae and biodiversity—Challenging paradigms in a world of complex nutrient changes. Marine Pollution Bulletin, 124(2), 591-606, p. 600.
Guignard, M. S., et al., (2017). Impacts of nitrogen and phosphorus: from genomes to natural ecosystems and agriculture. Frontiers in Ecology and Evolution, 5, 70, p. 1.
Guignard, M. S., et al., (2017), p. 2.
For additional information see, Fertilizer Harm to Biodiversity
Yes. Nutrient pollution has been identified as one of several planetary boundaries which, if crossed, could “destabilize the Earth system at the planetary scale.”[1,2] At a global level, the nutrient pollution boundary is widely considered to have already been “fully transgressed,” due to excessive nitrogen and phosphorus discharges that impact every aspect of the environment, including biodiversity, climate change, water pollution, and coastal dead zones.[3] And the U.S. is one of a handful of regions in which nitrogen and phosphorus overuse is concentrated.[4]
Moreover, the production of nitrogen-based fertilizers requires a large amount of energy and resources,[5] and it generates significant greenhouse gas emissions, both during and after processing.[6] Phosphorus is a finite resource; overuse leading to shortages would increase food insecurity worldwide.[7,8]
Steffen, W., et al., (2015). Planetary boundaries: Guiding human development on a changing planet. Science, 347(6223), 1259855. https://www.science.org/doi/pdf/10.1126/science.1259855
Richardson, K., et al., (2023). Earth beyond six of nine planetary boundaries. Science Advances, 9(37), eadh2458–eadh2458.
Campbell, B., et al., (2017). Agriculture production as a major driver of the Earth system exceeding planetary boundaries. Ecology and Society, 22(4), 8–, p. 1. https://doi.org/10.5751/ES-09595-220408
Steffen, W., et al., (2015), p. 3.
Sellars & Nunes (2021) Synthetic Nitrogen Fertilizer in the U.S., farmdoc daily (11):24, Department of Agricultural and Consumer Economics, University of Illinois at Urbana-Champaign. https://farmdocdaily.illinois.edu/2021/02/synthetic-nitrogen-fertilizer-in-the-us.html [“Another concern is the energy intensiveness of the Haber-Bosch process, which utilizes significant resources to create a high pressure and temperature environment to make ammonia.”]
Menegat, S., et al., (2022). Greenhouse gas emissions from global production and use of nitrogen synthetic fertilisers in agriculture. Scientific Reports, 12(1), 14490–14490. https://doi.org/10.1038/s41598-022-18773-w
Cordell, D. & White, S. (2014). Life’s bottleneck: sustaining the world’s phosphorus for a food secure future. Annual Review of Environment and Resources, 39, 161-188. https://www.annualreviews.org/doi/10.1146/annurev-environ-010213-113300
Elizabeth Kolbert (2023) Phosphorus Saved Our Way of Life—and Now Threatens to End It, The New Yorker. https://www.newyorker.com/magazine/2023/03/06/phosphorus-saved-our-way-of-life-and-now-threatens-to-end-it