There is no consensus about what makes an operation a factory farm.[1] Some sources use the EPA’s definitions of CAFOs (concentrated animal feeding operations) as a starting point. But these definitions are based on arbitrary metrics regarding manure and water pollution. And no government agency tracks the number of CAFOs nationally. Working off the number of AFOs (animal feeding operations) is equally challenging due to a lack of government data.[2]
And yet, many journalists and non-profits wish to document the pervasiveness of the factory farming system by giving some estimate of the share of farmed animals that are forced to exist in these conditions.
Though based on data from the 2022 Census of Agriculture, the following estimates are subjective.[3,4] We propose animal number cut-off points that we think reflect the likelihood that operations meet the defining characteristics of factory farms.[5] We are aware of two other recent and credible assessments that reach similar conclusions using somewhat different methods and assumptions.[6,7]
See Defining AFOs & CAFOs
See Total Number of AFOs and CAFOs.
USDA (2024) 2022 Census of Agriculture.
See Total Number of Factory Farms for additional info on rationale and assumptions behind these estimates.
See Defining Factory Farms
Jacy Reese Anthis (2024) US Factory Farming Estimates, Sentience Institute. https://www.sentienceinstitute.org/us-factory-farming-estimates [Analysis based on the 2022 Census of Ag, updated from the author’s earlier analysis based on the 2017 Census of Ag.]
FarmKind (2024) Debunking the myth of the small farm: A collaboration between FarmKind and Bryant Research. https://www.farmkind.giving/the-small-farm-myth-debunked [Analysis based on the 2022 Census of Ag and proposed “megafarm” definitions.]
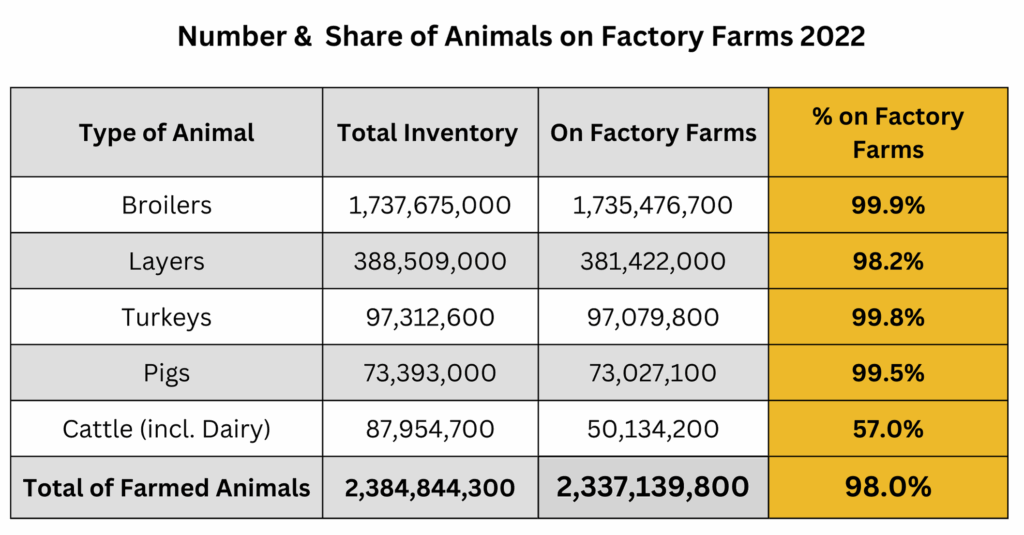
Broadly estimated, ~98% of U.S farmed animals are raised on factory farms.[1-4]
Included in the calculation are broiler chickens, egg-laying hens, turkeys, pigs, and cattle (including dairy).
See spreadsheet analysis. https://docs.google.com/spreadsheets/d/1vvN6-XC12_AL0Q0l6ooVdMW-m7LYrNdhMbs2FboKpOs/edit?gid=0#gid=0
Inventory: [USDA (2024) 2022 Census of Agriculture, Broilers & meat-type chickens, Egg-laying hens, Turkeys (Table 30); Hogs & Pigs (Table 22); Cattle (Table 14)]
See Total Number of Factory Farms for additional info on rationale and assumptions behind these estimates.
Note: the spreadsheet attempts to answer the question: At a given moment, what share of all farmed animals alive are living on a factory farm, or, in the case of cattle, will eventually spend a significant share of their lives on a factory farm? Figures are based on the Census of Ag snapshot of inventory in Dec 2022, except for broilers and turkeys, where farm size (# of animals) is provided only according to annual sales. In that case we extrapolate inventory figures by dividing the total sales by an estimate of the average number of flocks sold per year.
Inventory: [USDA (2024) 2022 Census of Agriculture, Broilers & meat-type chickens, Egg-laying hens, Turkeys (Table 30); Hogs & Pigs (Table 22); Cattle (Table 14). Numbers have been adjusted to nearest hundred.]
For number of animals on factory farms, see spreadsheet analysis. https://docs.google.com/spreadsheets/d/1vvN6-XC12_AL0Q0l6ooVdMW-m7LYrNdhMbs2FboKpOs/edit?gid=0#gid=0
Though there is no definitive answer, we estimate the following:
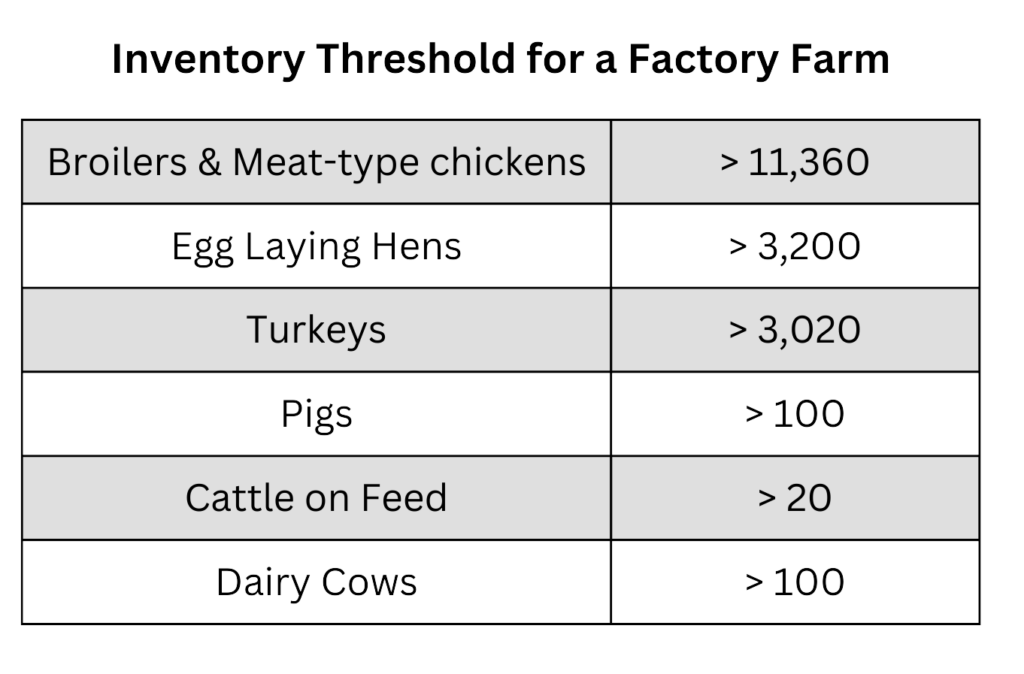
For rationale and assumptions behind these cutoff points, see Total Number of Factory Farms
Also see spreadsheet analysis, https://docs.google.com/spreadsheets/d/1vvN6-XC12_AL0Q0l6ooVdMW-m7LYrNdhMbs2FboKpOs/edit?gid=0#gid=0
Cattle are placed in 2 categories: the share that will spend a significant portion of their lives on a factory farm and the share that will not. Of the total cattle in inventory, it is estimated that ~57% are either on factory farms or will eventually enter a feedlot or dairy factory farm. About 43% will live from birth until slaughter on grazing land.[1]
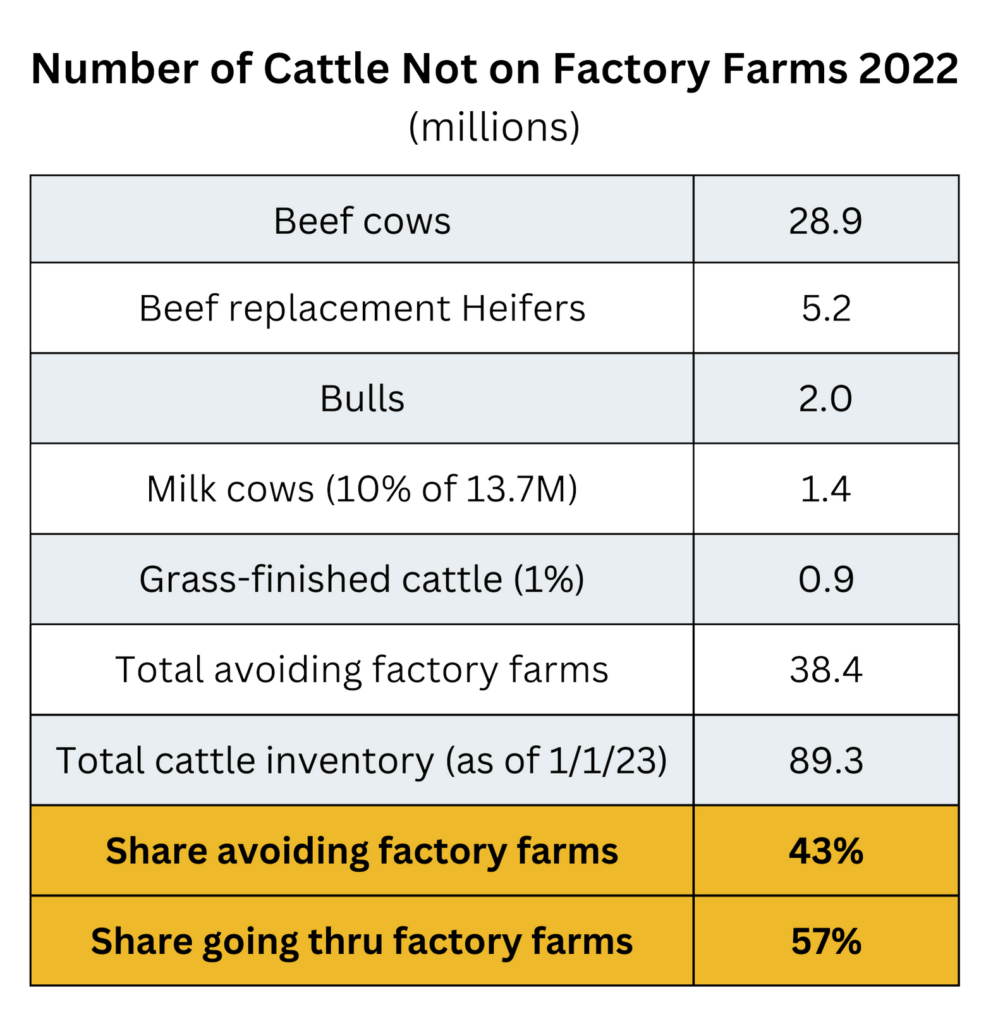
Of the cattle that spend their lives on grazing land, most are breeding cows (and some bulls) birthing multiple generations that fill the feedlots. Additionally, a small share of dairy cows are on farms with fewer than 100 cows, which here is not considered a factory farm.[2] Also, a small number of “grass-fed” beef cattle do not enter feedlots, remaining on pasture until slaughter.[3]
USDA NASS (January 31, 2023) Cattle Report. [For cattle share on factory farm calculations, we use this “inventory snapshot” at a similar time frame (1/1/2023) to the 2022 Census of Ag (12/31/22) to estimate the shares that will likely not go into feedlots or dairy factory farms. Total inventory for snapshot = 89,274,100. This is a larger figure than the Census of Ag figure, though we use it only to estimate the shares (not the absolute figures) because it has more detail than the Census of Ag.]
See Grazing Animal Numbers, “What percentage of dairy cows are mostly kept on pasture?”
[Some small dairy operations still allow cows to primarily live on pasture]Cheung, R., & McMahon, P. (2017). Back to grass: The market potential for US grassfed beef. Stone Barns Center for Food and Agriculture, pp. 5-6. [Although the share of “grass-fed” cattle is often estimated at ~4-5%, this report notes that a) “imports account for an estimated 75-80% of total U.S. grassfed beef sales” and b) many of the grass-fed cattle are “cull cows or bulls” that grazed their entire lives but were not raised to be, nor were marketed as, what is commonly understood to be “grass-fed beef.” We use this information to estimate the number of U.S. beef cattle raised as grass-fed at ~1% of total cattle.
Not included are “pullets for laying flock replacement” totaling ~144 million birds.[1] This is by far the largest group not included. We have little firm data about the size of the farms on which they are raised, though almost all are likely to be raised on large factory farms.
These pullets are either young laying hens soon to be egg-type commercial egg-layers or young broiler-type laying hens soon to be laying eggs that hatch into broiler chicks. They are likely to be kept exclusively on factory farms, since these are not the types of birds small farming operations would raise to directly produce eggs or meat. Pullet growers tend to be specialized operations of relatively high commercial importance with elevated levels of biosecurity.[2,3]
Other animal types not included make up a small share of total farmed animals.[4]
USDA (2024) 2022 Census of Agriculture. [Inventory for pullets for laying flock replacement, Table 30]
Dennis Brothers (October 20, 2022) New Farmer’s Guide to the Commercial Broiler Industry: Poultry Husbandry & Biosecurity Basics, Alabama A&M Cooperative Extension System https://www.aces.edu/blog/topics/farm-management/new-farmers-guide-to-the-commercial-broiler-industry-poultry-husbandry-biosecurity-basics/ [“Since pullets and cockerels are the foundation of the broiler program at any complex, these farms are expected to be among the most closely monitored and tightly managed.”]
USDA APHIS (2013) Poultry Industry Manual, FAD PReP. [Notes that broiler breeding is a specialized area of commercial importance and high biosecurity requirements (p. 10). For commercial egg-laying operations, “Pullets are raised in wire cages in brooder/grow-out buildings on rearing farms owned by the production company or by a contract pullet grower.” (p. 103)]
USDA (2024) 2022 Census of Agriculture. [Inventory not included (with > 2 million animals): Quail (9.3M); Roosters (7.7M); Ducks (4.4M); Pheasants (3.3M); Sheep (5.1M); Goats (2.5M). Total = 32.3 million animals. (32.3 / (2,384.8 + 32.3) = 1.3% of total inventory. See Other Poultry (Table 30); Sheep (Table 27); Goats (Table 28)]