Industrialized animal agriculture is the primary driver of the pollution of U.S. waterways.[1] The key points, as detailed in the following pages:
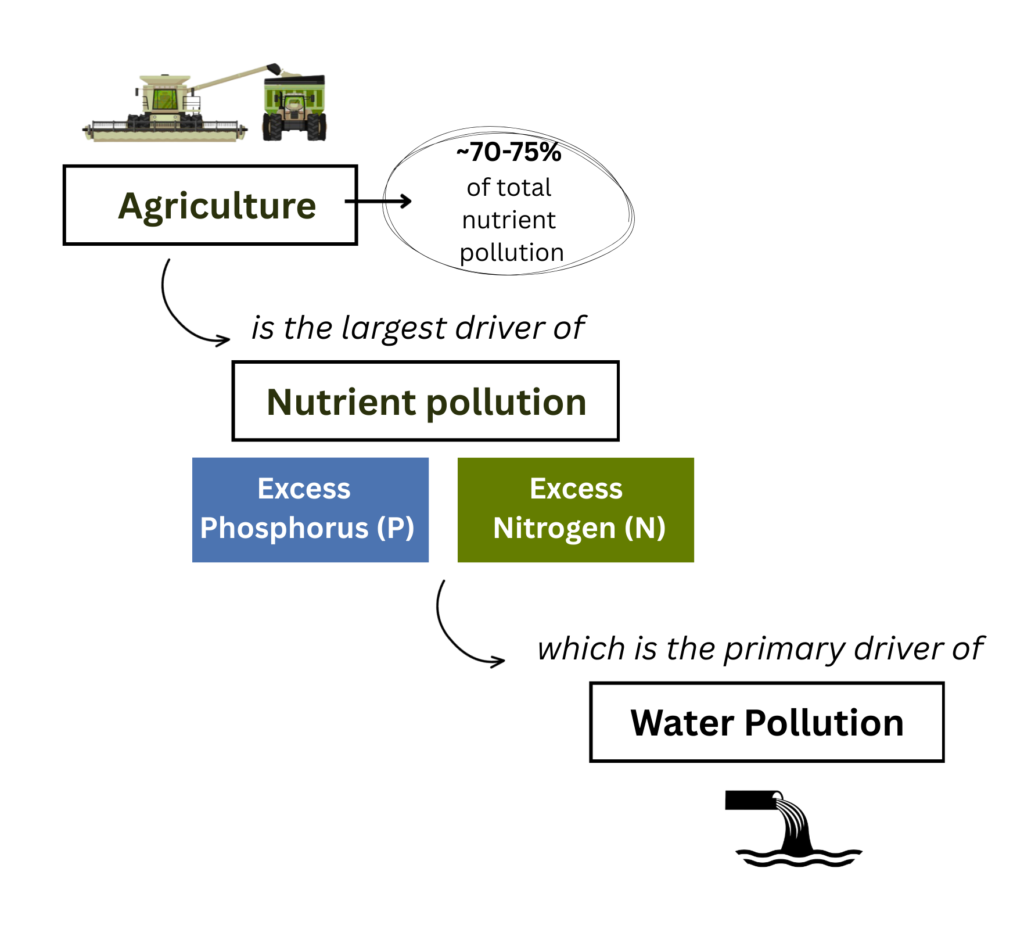
![]() Nutrient pollution (excess nitrogen and phosphorus in the environment) is the primary cause of pollution in U.S. waterways.
Nutrient pollution (excess nitrogen and phosphorus in the environment) is the primary cause of pollution in U.S. waterways.![]() Nutrient pollution causes eutrophication which leads to biological degradation and eventually the loss of functioning aquatic ecosystems.
Nutrient pollution causes eutrophication which leads to biological degradation and eventually the loss of functioning aquatic ecosystems.![]() Agriculture is the driver of ~70-75% of nutrient pollution.
Agriculture is the driver of ~70-75% of nutrient pollution.![]() Animal ag is by far the greatest share of agriculture’s contributions.
Animal ag is by far the greatest share of agriculture’s contributions.![]() The sources of animal ag’s excess N and P are manure, along with the chemical fertilizers used on feed crops, and the fixation of nitrogen by soybeans and forage crops.
The sources of animal ag’s excess N and P are manure, along with the chemical fertilizers used on feed crops, and the fixation of nitrogen by soybeans and forage crops.![]() Government regulations and incentives have failed to manage nutrient pollution; the nation’s waterways have received failing grades for decades.
Government regulations and incentives have failed to manage nutrient pollution; the nation’s waterways have received failing grades for decades.![]() Federal agencies rarely identify agriculture as the primary driver (and are naturally less likely to highlight animal agriculture’s role).
Federal agencies rarely identify agriculture as the primary driver (and are naturally less likely to highlight animal agriculture’s role).![]() Nutrient pollution from animal ag is not only a driver of water pollution, it is a key source of air pollution, GHG emissions, and biodiversity loss.
Nutrient pollution from animal ag is not only a driver of water pollution, it is a key source of air pollution, GHG emissions, and biodiversity loss.![]() Considered one of the earth’s planetary boundaries, the nutrient pollution boundary has been definitively transgressed.
Considered one of the earth’s planetary boundaries, the nutrient pollution boundary has been definitively transgressed.
Animal agriculture is the largest contributor to U.S. nutrient pollution. And nutrient pollution is the largest factor in water pollution. Both points are documented throughout these pages. It should become common knowledge that factory farming is the central driver of water pollution, due to massive amounts of unusable manure, chemical fertilizers on feed crops, and the increased production of nitrogen-fixing crops, mostly for feed. However, for all the reasons documented here, this connection between animal ag and water pollution is mostly hidden.
U.S. waterways have received failing grades for decades. Less than half of U.S. freshwater bodies are in good biological condition, i.e., have healthy biological communities. This includes rivers, streams, lakes, wetlands, and Great Lakes near-shore waters.[1-5]

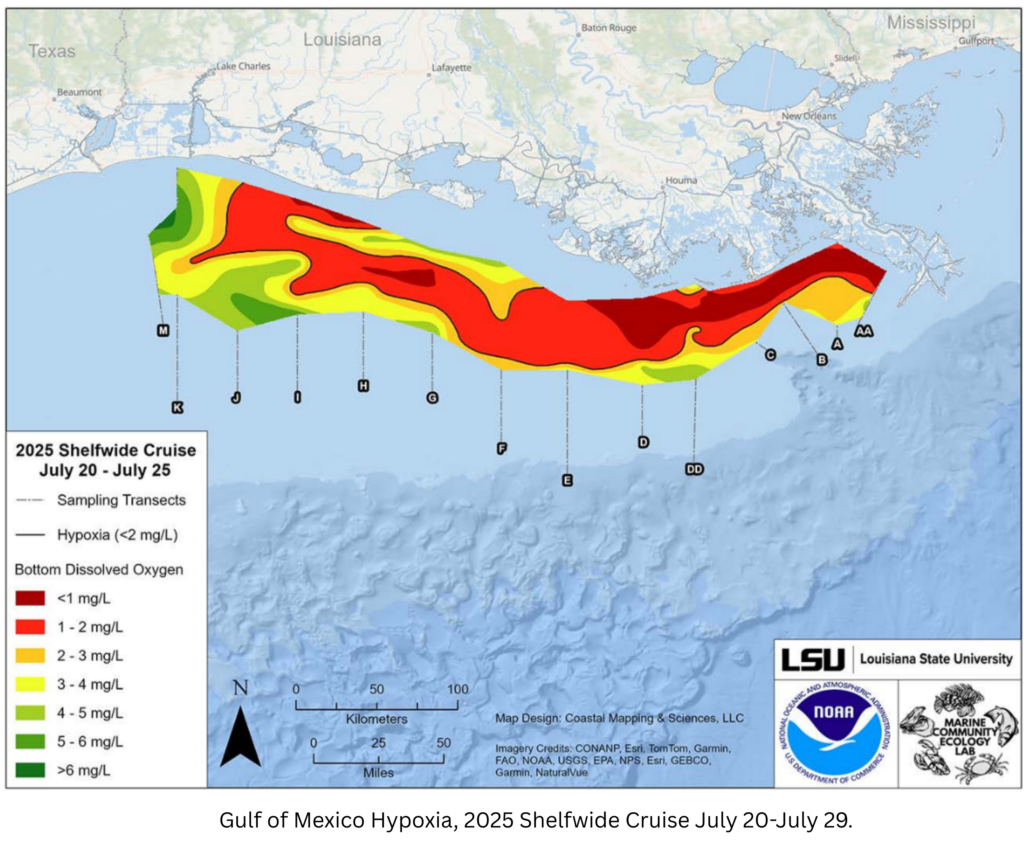
The Gulf of Mexico dead zone, at an average size of ~4,800 square miles, is about the size of the land area of Connecticut.[6]
EPA (2024). National water quality inventory: report to Congress, 841-R-16-011, p. 4. [The above chart is based on the EPA chart from page 4, updated with the following 2 reports that came out later.]
U.S. EPA (2024). National Lakes Assessment: The fourth collaborative survey of lakes in the United States, 841-R-24-006. [Good biological condition decreased slightly from 43% to 42%.]
U.S. EPA (2024). National Wetland Condition Assessment: The third collaborative survey of wetlands in the United States, 843-R-24-001. [“The EPA found 45% of wetland area was in good condition.” About 95% of U.S. wetlands are freshwater. See, Lang, M.W., et al., (2024). Status and Trends of Wetlands in the Conterminous United States 2009 to 2019, U.S. Department of the Interior; Fish and Wildlife Service, p.16]
U.S. EPA (2021). National Coastal Condition Assessment: A Collaborative Survey of the Nation’s Estuaries and Great Lakes Nearshore Waters, 841-R-21-001, p. 16. [31% good condition / 67% assessed = ~46% of assessed areas are in good condition]
From EPA (2024). National water quality inventory: report to Congress, p. 6. [“Biological condition is the most comprehensive indicator of water body health…”]
NOAA (August 2025). This year’s Gulf of Mexico ‘dead zone’ is 21% smaller than estimates from early June by NOAA Headquarters. [The average is calculated over a 5-yr period. This is more than twice the size of the 5-yr average goal agreed to in 2001 (1,930 sq. miles), set with a target date of 2015.]
Along with the many obvious impacts on humans, including health risks, water scarcity, threats to safe food production, and loss of recreation, water pollution is a central factor in biodiversity loss.[1,2]
Nutrient pollution affects groundwater as well as waterways. Nitrates in groundwater contaminate drinking water for millions of Americans.[3]
NatureServe (2023). Biodiversity in Focus: United States Edition. NatureServe: Arlington, VA, p. 11. [“As a group, species associated with fresh water, including amphibians, snails, mussels, crayfish, and many aquatic insects, have the highest percentage of at-risk species, highlighting the importance of conservation strategies to protect freshwater ecosystems.”]
Niederman, T. E., et al., (2025). US Imperiled species and the five drivers of biodiversity loss. BioScience, biaf019, Table 1, p. 5. [93% of imperiled freshwater species impacted by habitat change, 76% by pollution, 65% by climate change.]
For human health impacts due to nitrate contamination, see, Nitrates in Drinking Water
Yes. Nutrient pollution is the primary driver of water pollution in U.S. waterways.
Nutrient pollution is acknowledged by the EPA as “the most widespread stressor” in the nation’s lakes, rivers and streams, and coastal areas.[1-3]
Even more critically, excess nutrients (nitrogen or phosphorus or both) have the highest “attributable risk” for lakes, rivers and streams.[4-6] Attributable risk is the metric assigned by the EPA to measure the improvements to waterways that could be gained from reducing specific pollutants.[7,8]
U.S. EPA (2024). National Lakes Assessment. [For lakes, “Nutrient pollution was the most widespread stressor measured.”]
U.S. EPA (2023). National Rivers and Streams Assessment: The Third Collaborative Survey, 841-R-22-004. [For rivers and streams, “Nutrients (phosphorus and nitrogen) were the most widespread stressors.”]
U.S. EPA (2021). National Coastal Condition Assessment: A Collaborative Survey of the Nation’s Estuaries and Great Lakes Nearshore Waters, 841-R-21-001, p. 53. [For coastal areas, including estuaries and Great Lakes near-shore areas, “Similar to findings from other assessments, the NCCA found that elevated nutrient levels are widespread stressors.”]
U.S. EPA (2024). National water quality inventory: report to Congress. [“Attributable risk analysis for rivers and streams shows that reducing nutrients could result in the greatest benefit to biological condition at the national scale.” at p. 24. For lakes “Calculating attributable risk, EPA found that reducing phosphorus and nitrogen could result in the greatest benefit to benthic macroinvertebrate condition nationally.” at p. 24. “Biological condition for coastal waters, lakes, rivers, and streams is based on benthic macroinvertebrates.” at p. 21. “Biological condition is the most comprehensive indicator of water body health: when the biology of a stream is healthy, the chemical and physical components of the stream are also typically in good condition.” at p. 10]
U.S. EPA (2023). National Rivers and Streams Assessment: The Third Collaborative Survey. [“Attributable risk analysis shows that reducing nutrients could result in the greatest benefit to biological condition at the national scale…” And again, “Biological condition is the most comprehensive indicator of water body health: when the biology of a stream is healthy, the chemical and physical components of the stream are also typically in good condition.” From, National water quality inventory: report to Congress at p. 10]
U.S. EPA (2024). National Lakes Assessment. [For lakes: “EPA found that reducing phosphorus could result in the greatest benefit to benthic macroinvertebrate condition nationally…” And again, “Biological condition for coastal waters, lakes, rivers, and streams is based on benthic macroinvertebrates.” at p. 21]
U.S. EPA (2024). National water quality inventory: report to Congress, pp. 23-24. [Attributable risk is “a single value that provides an estimate of the potential improvement that could be achieved by reducing or eliminating the stressor.”]
For additional info see, Nutrient Pollution of Waterways
Yes. Agriculture is the largest driver of nutrient pollution, responsible for about 70-75% of nitrogen and phosphorus pollution.[1-3]
In turn, nutrient pollution is the primary driver of U.S. water pollution (as noted in the question above).
Agriculture is the largest driver of U.S. water pollution.
Brehob, M. M., et al., (2025). The US EPA’s National Nutrient Inventory: Critical Shifts in US Nutrient Pollution Sources from 1987 to 2017. Environmental Science & Technology, p. A. [“As an example, agriculture is generally the largest contributor to nutrient pollution in the United States.”]
Sabo, R. D., et al., (2021). Considerations when using nutrient inventories to prioritize water quality improvement efforts across the US. Environmental research communications, 3(4), 045005, pp. 5-7. [“Respectively, about 67% and 80% of the anthropogenic N and P surplus is attributable to the N and P left in fields and pastures across the country with the remainder being attributed to NOx deposition on non-agricultural land, lawn fertilizer application, and human food and nonfood demand. Similar proportions have been observed in other national inventories or inferred from Sparrow models.” 67 + 80 / 2 = 73.5%]
For more detailed analysis, see, Agriculture’s Contributions to Water Pollution [question: Is agriculture the main source of U.S nutrient pollution? And question: What share of N and P pollution comes from agriculture?]
Yes. Animal ag is responsible for ~70% of agriculture’s contributions to nutrient pollution.[1] Therefore, animal ag is responsible for ~50% of all nutrient pollution and is the largest driver of U.S. water pollution.[2]
![]()
Animal ag is the dominant source of nutrient pollution due to chemical fertilizer use on feed crops, legume fixation of nitrogen, and of course manure generation.[3]
For further details and calculations of this critical point, see, Animal Ag Contributions to Water Pollution
Calculation: ~73% agricultural contributions * ~70% animal ag’s share of agricultural contributions = ~50% of total contributions.
See, Animal Ag Water Pollution Sources
Despite decades of research, spending, efforts at behavior modification, and intermittent regulations, water pollution from excess nutrients has been an intractable problem in the U.S.[1,2] This is regularly acknowledged by researchers and occasionally by federal agencies.[3]
Less than half of U.S. freshwater bodies are in good biological condition.[4]
A central example of the inability to stop the release of excess fertilizers and manure is the Gulf of Mexico dead zone. The 5-yr average size is currently ~4,800 square miles, approximately the size of the land area of Connecticut.[5] This is about 2.5 times the size of the 5-yr average goal agreed to in 2001 (1,930 sq. miles), set with a target date of 2015.[6]
Ribaudo, M., & Shortle, J. (2019). Reflections on 40 years of applied economics research on agriculture and water quality. Agricultural and Resource Economics Review, 48(3), 519-530, p. 522. [This presentation was co-written by a USDA researcher who spent 35 years at the agency trying to address nutrient pollution from agriculture. “The voluntary approach has generally not led to sufficient aggregation of conservation efforts in impaired watersheds to produce needed improvements in water quality.”]
Sabo, R. D., et al., (2021). Considerations when using nutrient inventories to prioritize water quality improvement efforts across the US. Environmental research communications, 3(4), 045005, Abstract. [From EPA researchers: “Progress in decreasing nitrogen and phosphorus pollution to surface water over the past two decades has been slow.”]
McKenna, O. P., et al., (2023). Maximizing the water quality benefits of wetlands in croplands. US Department of Agriculture. [“Nutrient loads from croplands continue to negatively affect surface water quality, despite considerable investments in and adoption of agricultural conservation practices aimed at reducing nutrient losses… Despite the widespread expansion of conservation practices, nutrient inputs from croplands to streams, rivers, lakes, and the Gulf of Mexico continue to exceed reduction targets.”]
U.S. EPA (2024). National Water Quality Inventory: Report to Congress, 841-R-23-001, Figure 1, p 4. For detailed assessment, see Lakes, Rivers & Streams Pollution
NOAA (August 2025). This year’s Gulf of Mexico ‘dead zone’ is 21% smaller than estimates from early June by NOAA Headquarters. [This is more than twice the size of the 5-yr average goal agreed to in 2001 (1,930 sq. miles), set with a target date of 2015.]
U.S. EPA (2023). Mississippi River/Gulf of Mexico Watershed Nutrient Task Force 2023 Report to Congress, p. 2. [“In 2001, the HTF (Hypoxia Task Force) first agreed to meet a coastal goal of reducing the size of the hypoxic zone in the northern Gulf to a 5-year annual average of less than 5,000 square kilometers by 2015, subject to the availability of resources.”]
The reasons are many. Here we list them according to our best estimate of importance. (We note these factors in many areas on the site; they are the reasons that the devastations of animal ag are mostly hidden and immovable, despite the massive costs to all earth’s inhabitants.)
![]() The basic structure of the factory farm system – Confined animals, concentrated manure, and monoculture feed crops insure the ongoing generation of massive amounts of unusable nutrients that become pollutants.[1]
The basic structure of the factory farm system – Confined animals, concentrated manure, and monoculture feed crops insure the ongoing generation of massive amounts of unusable nutrients that become pollutants.[1]![]() Agricultural exceptionalism – Cultural factors support the myth of “small family farmers,” encouraging counterproductive subsidies and failed policies.[2]
Agricultural exceptionalism – Cultural factors support the myth of “small family farmers,” encouraging counterproductive subsidies and failed policies.[2] ![]() Federal obfuscation – Federal agencies are unwilling to state the truth about sources of nutrient pollution.[3]
Federal obfuscation – Federal agencies are unwilling to state the truth about sources of nutrient pollution.[3]![]() Weak regulations and poor monitoring – The weak and ever-changing regulatory efforts to curb pollution have had little impact; federal agencies poorly monitor some regions with high levels of pollution.[4,5]
Weak regulations and poor monitoring – The weak and ever-changing regulatory efforts to curb pollution have had little impact; federal agencies poorly monitor some regions with high levels of pollution.[4,5]![]() Complexity – The widespread sources, variable practices on factory farms, and scientifically complex routes of nutrient dispersal make mitigation challenging.[6]
Complexity – The widespread sources, variable practices on factory farms, and scientifically complex routes of nutrient dispersal make mitigation challenging.[6]![]() Politics – The importance of maintaining cheap prices for animal-sourced foods has changed political calculations.[7]
Politics – The importance of maintaining cheap prices for animal-sourced foods has changed political calculations.[7]![]() Corporate profits – Chemical fertilizer companies are singularly focused on increasing the demand for chemical fertilizers.[8,9]
Corporate profits – Chemical fertilizer companies are singularly focused on increasing the demand for chemical fertilizers.[8,9]
Despite the occasional federal “urgent call to action” the factory farming system has withstood all efforts to address one of the nation’s most serious environmental issues.[10,11]
See, Manure Pollution Overview
Metaxoglou, K. & Smith, A. D. (2022). Nutrient Pollution and US Agriculture: Causal Effects. Integrated Assessment, and Implications of Climate Change, National Bureau of Economic Research, (w30124), p. 6. [“As of this writing, the major federal response to nutrient pollution from agriculture continues to be through research, education, outreach, and voluntary technical and financial incentives.”]
EPA (2023). Mississippi River/Gulf of Mexico Watershed Nutrient Task Force 2023 Report to Congress. [Despite manure being the #1 source of nitrogen in the MARB watershed, the word “manure” is mentioned 4 times in this 158 page report.]
Tomczyk, N., et al., (2023). Nonpoint source pollution measures in the Clean Water Act have no detectable impact on decadal trends in nutrient concentrations in US inland waters. Ambio, 52(9), 1475-1487, Abstract. [“These results suggest that the current federal policy paradigm for improving water quality is not creating desired outcomes.”]
Oates, C., et al., (2024). Effective nutrient management of surface waters in the united states requires expanded water quality monitoring in agriculturally intensive areas. ACS Environmental Au, 5(1), 1-11, Abstract. [“From this assessment, we found that many, but not all, of the nation’s most agriculturally intensive areas are under-monitored, and often unmonitored. While it is well-known that the Midwest is the epicenter of agricultural production in the U.S., our results reveal it is poorly monitored relative to its agricultural nutrient inputs.”]
Kleinman, P. J., et al., (2011). Managing agricultural phosphorus for water quality protection: principles for progress. Plant and soil, 349(1), 169-182, p. 170 [“Managing agricultural sources of P to curb eutrophication is an inherently difficult task, hindered by the complexity of watershed processes, variability in appropriate management practices and vagaries of climate.”]
Maura Judkis (March 27, 2025). Eggs Are President Now, Washington Post. [“But the political situation surrounding eggs has grown increasingly fragile. Bird flu has been causing egg supply chain issues since 2022, and Trump was eager to pin those woes on Biden and Vice President Kamala Harris throughout the campaign.”]
CF Industries 2024 Annual Report, p. 2. [“At our core, CF Industries is a producer of ammonia… We are the largest producer of ammonia in the world… The primary use of ammonia and its derivative products today, and the focus of our business for nearly 80 years, is as fertilizer.”]
Foodrise (2025). Exhausted Earth – How fertiliser corporations destroyed the nitrogen cycle and how to fix it.
U.S. EPA (2009). An Urgent Call to Action – Report of the State-EPA Nutrient Innovations Task Group, pp. 31-32. [“The evidence presented and referenced in this Task Group report clearly indicates that nitrogen and phosphorus pollution is widespread and significant. Increased public health risks and treatment costs from contamination of drinking water supplies is a major concern. Almost 50 percent of our nation’s smaller streams have elevated levels of nitrogen and phosphorus. Over 2 million acres of lakes and reservoirs across the country are impaired and not meeting water quality standards due to excess nutrients. A startling 78 percent of the assessed continental U.S. coastal area exhibits symptoms of eutrophication. And, as the sidebar illustrates, the numerous impacts from this pollution are well documented and severe.”]
U.S. EPA (2022). Fox, R. Memorandum – Accelerating nutrient pollution reductions in the Nation’s waters. United States Environmental Protection Agency. [“Nutrient pollution is a continuing and growing challenge with profound implications for public health, water quality, and the economy. In a changing climate, the complexity and severity of the problem is increasing.”]
Nutrient pollution, and especially excess nitrogen, impacts many aspects of nature and the environment. Plants, humans, and other animals are negatively influenced by nutrient pollution’s effects on air, water, soil, and land.[1,2]
Because of the widespread damages, scientists caution that nutrient pollution has definitively transgressed planetary boundaries that threaten human survival.[3,4]
See, Nutrient Pollution of Waterways [question: What are the effects of nutrient pollution in the U.S.?]
Sutton, M. A., et al., (2021). The nitrogen decade: mobilizing global action on nitrogen to 2030 and beyond. One Earth, 4(1), 10-14, p. 10. [“By massively increasing the supply of nitrogen compounds, humans are worsening air and water quality, contributing to climate change and stratospheric ozone depletion, and thereby threatening health, biodiversity, and livelihoods.”]
Richardson, K., et al., (2023). Earth beyond six of nine planetary boundaries. Science advances, 9(37), eadh2458. See Table 1, p. 5. [The P boundary is set at 11 Tg with current use at 22.6 Tg. The N boundary is at 62 Tg, with current use at 190 Tg.]
Kitzmann, N., et al., (2025). Planetary Health Check 2025: A scientific assessment of the state of the planet. Potsdam Institute for Climate Impact Research (PIK), Potsdam, Germany. Figure ES-1 p. 11. [“…intentional nitrogen fixation is at about 165 Tg N/year (over two times the Planetary Boundary and beyond the high-risk threshold).”]