1. Agriculture accounts for about 80% of total U.S. water consumption, almost all due to irrigation.
2. Most irrigation occurs in areas subject to water scarcity and drought; Western states account for most irrigation, with California the top user.
3. We consume almost 80% of the nation’s water to irrigate crops worth less than one-half of one percent of GDP (the total value of the nation’s goods and services).
About 80% of U.S. water consumption is attributed to agriculture, mostly due to irrigation.[1-6]
Of the water withdrawn for irrigation, about 62% is consumed (and not returned to the immediate water environment).[7]
Rehkamp, S., et al., (2021) Tracking the U.S. Domestic Food Supply Chain’s Freshwater Use Over Time, U.S. Department of Agriculture, Economic Research Service. p. 1 [“In the United States, agricultural uses account for 80 percent of consumptive water use (i.e., water removed from its source but not returned).”]
Richter, B. D., et al., (2020). Water scarcity and fish imperilment driven by beef production. Nature Sustainability, 3(4), 319–328, Table 1, p. 321. [Crop irrigation (75%) + Livestock Watering (2%) = 77%.]
Rushforth, R. R. & Ruddell, B. L. (2018). A spatially detailed blue water footprint of the United States economy. Hydrology and Earth System Sciences, 22(5), 3007-3032. [“Further, the water footprint of agriculture and livestock is 93% of the total US blue water footprint, and is dominated by irrigated agriculture in the western US.”]
Marston, L., et al., (2018). High‐resolution water footprints of production of the United States. Water Resources Research, 54(3), 2288-2316. [Agricultural tally = 74% for irrigation + 2% for livestock direct use = 76%.]
Konar, M. & Marston, L. (2020). The Water Footprint of the United States. Water (Basel), 12(11), 3286. [Acknowledging the uncertainty in agriculture’s share: “Between 74–93% … of all blue water consumed in the US is for irrigated agriculture and livestock production.” References the 2 prior footnotes (3 and 4). at p. 3. “Blue water is water from a source, such as a reservoir, river, lake, or aquifer.” at p. 2]
Note: Globally, agriculture accounts for an even higher share. See, Richter, B. D., et al., (2023). Alleviating water scarcity by optimizing crop mixes. Nature Water, 1(12), 1035-1047. p. 1035. [“Irrigated agriculture accounts for 88% of all fresh water consumed globally, meaning that seven times more water is consumed on irrigated farms than in all of humanity’s other water uses combined.”]
Dieter, C.A., et al., (2018) Estimated Use of Water in the United States in 2015, U.S. Geological Survey, Table 7, p. 27. [Although the USGS provides amount of water consumed by irrigation and by thermonuclear power, it does not estimate consumption for other categories, nor does it estimate total consumption. Portion of irrigation withdrawal that is consumed = 73.2/118 = 62%]
Surface water and groundwater are withdrawn in almost equal parts.
![]() Surface Water – The USGS estimates that irrigation withdraws 60.9 billion gallons per day (Bgal/d) of fresh surface water. That’s ~52% of agriculture’s total withdrawals.[1]
Surface Water – The USGS estimates that irrigation withdraws 60.9 billion gallons per day (Bgal/d) of fresh surface water. That’s ~52% of agriculture’s total withdrawals.[1]
![]() Groundwater – Irrigation withdraws 57.2 Bgal/d of groundwater. That’s ~48% of agriculture’s total withdrawals.[2]
Groundwater – Irrigation withdraws 57.2 Bgal/d of groundwater. That’s ~48% of agriculture’s total withdrawals.[2]
Agriculture’s consumptive use is likely skewed towards groundwater. Two reports estimate irrigation’s groundwater consumption at ~55% versus surface water at ~45%.[3,4]
Dieter, C.A., et al., (2018) Estimated Use of Water in the United States in 2015, U.S. Geological Survey, Table 3A, p. 14. [60.9 / 118 = 51.6%]
Dieter, C.A. et al., (2018) Table 4A, p. 16. [57.2 / 118 = 48.47%]
Konar, M. & Marston, L. (2020). The Water Footprint of the United States. Water (Basel), 12(11), 3286. [“Of this, 44% comes from streams, rivers, and lakes, while the remaining 56% is from groundwater.”]
Lamsal, G. & Marston, L. T. (2024). Monthly crop water requirements of irrigated crops in the United States from 1981-2019. Authorea Preprints. Table S-2, p. 5. [Estimates long-term average at 55% groundwater versus 45% surface water.]
Critically, irrigation makes up about two-thirds of total groundwater withdrawals.[1]
Dieter, C.A. et al., (2018) Estimated Use of Water in the United States in 2015, U.S. Geological Survey Table 4A, p. 16. [Total groundwater withdrawals for irrigation = 52.7 Bgal per day / 82.3 Bgal per day of all groundwater withdrawals == 69.5%]
The unsustainable depletion of U.S. groundwater is well documented.[1-4]
Although groundwater depletion is often viewed as a threat to human water supplies, its impacts are even greater on plant and animal species that have less ability to adapt. Depletion of groundwater contributes to reduced base flow to springs, streams, and other surface water bodies including wetlands, all of which can damage aquatic ecosystems and the animals that rely on them.[5,6]
US Geological Survey (2018) Groundwater Decline and Depletion https://www.usgs.gov/special-topics/water-science-school/science/groundwater-decline-and-depletion#overview [Defines groundwater depletion as “long-term water-level declines caused by sustained groundwater pumping.”]
Konikow, L. F., (2013). Groundwater depletion in the United States (1900− 2008), U.S. Geological Survey, No. 2013-5079.
Konikow, L. F. & Bredehoeft, J.D. (2020) Groundwater Resource Development: Effects and Sustainability, Groundwater Project, Guelph, Ontario, Canada, 2020, pp. 14-17.
See, Groundwater & Aquifer Depletion for further information.
Konikow, L. F. (2015). Long-term groundwater depletion in the United States. Ground Water, 53(1), 2–9, p. 2. [“Groundwater depletion can have a number of detrimental effects. These include reduced well yields, increased pumping costs, needs to drill deeper wells, irreversible land subsidence, reduced base flow to springs, streams, and other surface water bodies, and loss of wetlands. Depletion effects can, in turn, lead to land-use changes. Reduced groundwater discharge can damage aquatic ecosystems.”]
Rohde, M. M., et al., (2024). Groundwater-dependent ecosystem map exposes global dryland protection needs. Nature (London), 632(8023), 101–107. [“When groundwater depletion occurs, groundwater levels can drop out of reach from wells and ecosystems, creating a lack of access to drinking or irrigation water and causing or contributing to land subsidence, seawater intrusion, streamflow depletion, ecosystem decline and biodiversity loss.”]
Irrigation allows for agricultural production in dry regions where precipitation is insufficient to meet crop water requirements.[1] These areas are more likely to be water stressed.[2]
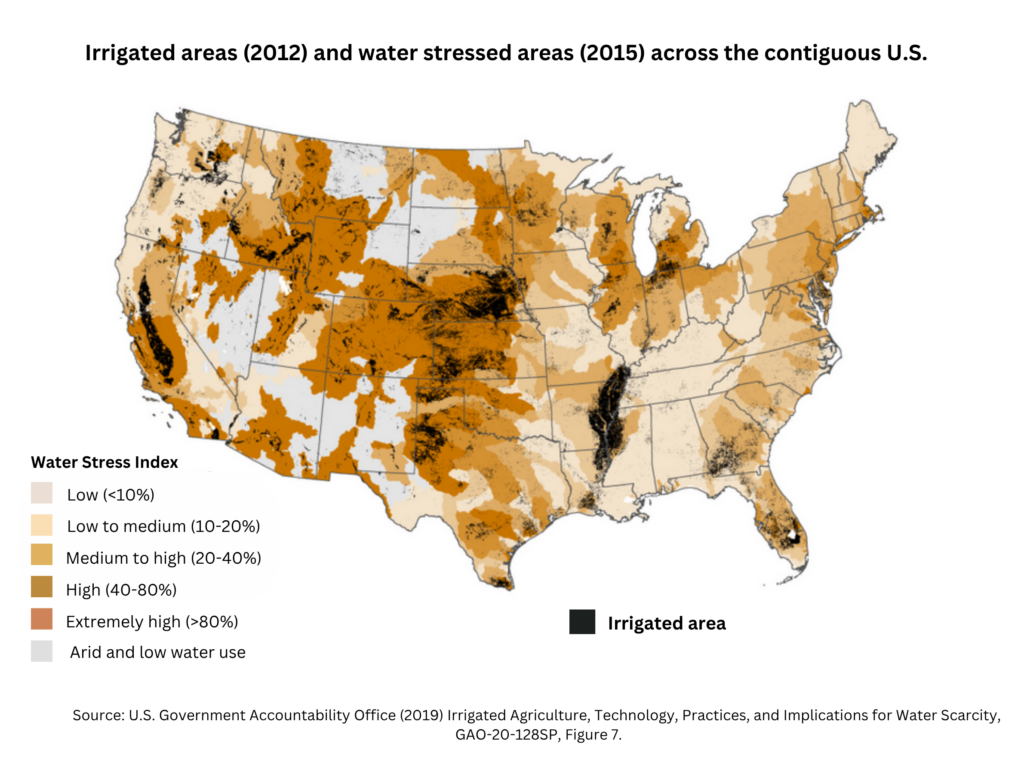 Scientists project increased water shortages in many areas if no significant restrictions are placed on irrigation practices.[3]
Hrozencik, R. Aaron and Marcel Aillery (2021). Trends in U.S. Irrigated Agriculture: Increasing Resilience Under Water Supply Scarcity, USDA Economic Research Service, EIB-229, Abstract.
U.S. Government Accountability Office (2019) Irrigated Agriculture, Technologies, Practices, and Implications for Water Scarcity, GAO-20-128SP, p. 15.
Brown, T. C., et al., (2019). Adaptation to future water shortages in the United States caused by population growth and climate change. Earth’s Future, 7(3), 219-234, p. 228.
The top 5 states accounted for ~56% of the nation’s consumption of irrigation water.[1]
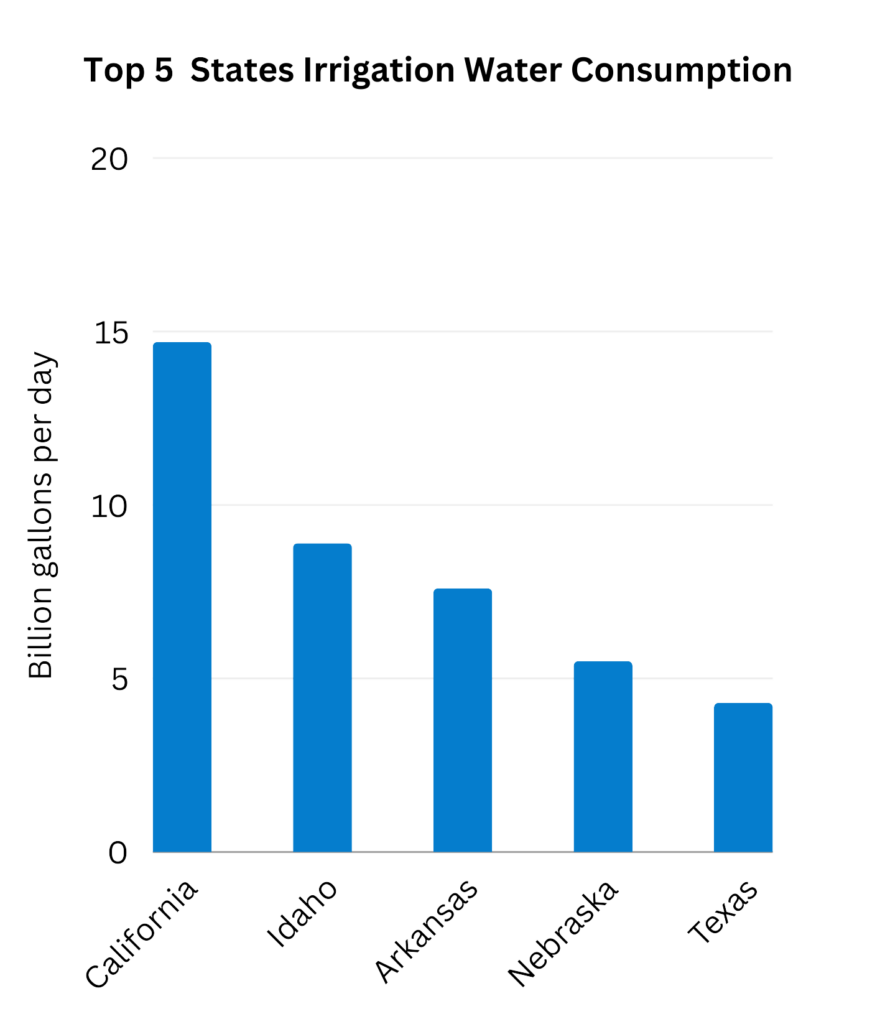
Dieter, C.A., et al., (2018) Estimated Use of Water in the United States in 2015, U.S. Geological Survey, Table 7, p. 27. [Total 5 states consumption = 41 Bgal/d / 73.2 Bgal/d == 56%]
The 17 conterminous Western States cumulatively accounted for 81% of the nation’s total irrigation withdrawals. (By source, it was 91% of total surface-water irrigation withdrawals and 71% of total groundwater irrigation withdrawals.)[1]
One experienced research team calculated that crop irrigation in the 17 Western States is responsible for 86% of the total water consumption in those states. Total domestic use (in residences) in those same states is responsible for just 6% of consumption.[2]
Dieter, C.A., et al., (2018) Estimated Use of Water in the United States in 2015, U.S. Geological Survey, p. 28.
Richter, B. D., et al., (2020). Water scarcity and fish imperilment driven by beef production. Nature Sustainability, 3(4), 319–328, Table 1.
According to the USDA 2023 Irrigation and Water Management Survey, ~50 million acres of cropland were irrigated in 2023.[1] The 2022 Census of Agriculture reports ~301 million acres were harvested.[2]
USDA NASS (2024) Census of Agriculture, 2023 Irrigation and Water Management Survey, Vol 3, AC-22-SS-1, Table 3. [Total cropland acres irrigated in 2023 = 50,414,439]
USDA (2024) 2022 Census of Agriculture, United States, Vol 1, Part 51, Table 9, p. 14. [Total acres harvested cropland in 2022 = 301,327,737]
The total value of all irrigated crops is approximately $130 billion. This is less than one-half of one percent of U.S. GDP.[1-5]
Almost 80% of the nation’s water consumption creates less than one-half of one percent of the total value of the nation’s goods and services.
Calculation: Total crop cash receipts in 2024 = ~$245 billion. Share of value of irrigated crops is estimated at about 50-55%, likely not more than ~$130 billion. As a share of 2024 U.S. GDP of $29.7 trillion = .44% or less than one-half of one percent. See the following references.
USDA (February 6, 2025) Farm Income and Wealth Statistics. [Value added by U.S. agriculture (includes net farm income) in 2024 = $245.2 billion]
R. Aaron Hrozencik (1/8/25) Irrigation & Water Use, USDA.
https://www.ers.usda.gov/topics/farm-practices-management/irrigation-water-use [“According to the 2017 Census of Agriculture, farms with some form of irrigation accounted for more than 54 percent of the total value of U.S. crop sales…”]USDA (2024) 2022 Census of Agriculture, Summary and State Data, AC-17-A-51, Table 11. [Total value of crop production for “any land irrigated” = $141,065,404 / $280,628,093 (value of crop production on “all farms”) suggests that maximum value of all irrigated crops was ~$140 billion, again about 50% of total crop value.]
Federal Reserve Bank of St. Louis (May 29, 2025) Gross Domestic Product. [2024 U.S. GDP = ~$29.7 trillion]