The EPA calculates that in 2022, the U.S. agriculture sector was responsible for 9.4% of total U.S. anthropogenic greenhouse gas emissions.[1-3]
Agricultural emissions have increased ~8% since 1990, while also decreasing 1.9% from 2021 to 2022.[4] The drop was due at least in part to a decrease in beef cattle populations.[5]
EPA (2024) Inventory of U.S. Greenhouse Gas Emissions and Sinks: 1990-2022, EPA 430-D-24-004, Table ES-3. [Total agriculture of 593.4 million metric tonnes CO2 eq / total gross emissions of 6,343.2 MMT = 9.355%). Calculation includes: agricultural soil management, enteric fermentation in domestic livestock, livestock manure management, rice cultivation, urea fertilization, liming, and field burning of agricultural residues. Consistent with the Paris Agreement and the UNFCC, “the emissions and removals presented in this report and this chapter are organized by source and sink categories and calculated using internationally accepted methods in the 2006 IPCC Guidelines…” at p. ES-1]
Also see, EPA on-line data tool: Greenhouse Gas Inventory Data Explorer.
https://cfpub.epa.gov/ghgdata/inventoryexplorer/When including agriculture’s share of emissions of fossil fuels and electricity use, the agriculture economic sector is responsible for about 10% of total emissions. See, EPA (2024) Inventory of U.S. Greenhouse Gas Emissions and Sinks, table ES-5 and fn 23. [Agriculture 634.0 MMT CO2 Eq. / Total gross emissions 6,343.2 MMT CO2 Eq. = 9.995%]
EPA (2024) Inventory of U.S. Greenhouse Gas Emissions and Sinks, p. 2-23.
Ben Lilliston (2024) US ag emissions declined in 2022. A blip or trend? Institute for Agriculture & Trade Policy. https://www.iatp.org/us-ag-emissions-declined-2022-blip-or-trend
No, they’re much higher on a per capita basis. Since U.S. per capita total emissions are more than 2.6 times the world average, agricultural contributions can be viewed as “low” only in relation to the comparatively high overall level of U.S. emissions.[1]
On a per capita basis, U.S. agricultural emissions equal ~60% of the entire emissions of the average person in India.[2] If total U.S. emissions were on a par with the per capita world average, U.S. agriculture’s current share of U.S. total emissions would be ~25% of those “expected world-average” emissions instead of the EPA’s current estimate of 9.4%.[3]
This comparatively high level of agricultural emissions per capita is not driven by strong agricultural exports. In 2023, the value of U.S. agricultural imports was greater than the value of agricultural exports.[4]
Crippa, M., et al., (2023). GHG emissions of all world countries, Publications Office of the European Union, Luxembourg, 2023, p. 39. [(World) – 6.762 tonnes per capita. p. 242 (US) 17.901 tonnes per capita. 17.901 / 6.762 = 2.647]
Crippa, M. et. al., (2023), p. 133 (India) and p. 242 (US). [Calculation: U.S per capita emissions = 17.9 tonnes CO2 eq. and India = 2.79 tonnes. 17.9 * .094 = 1.68. 1.68 / 2.79 = 60.2%. For 9.4% figure see, EPA (2024) Inventory of U.S. Greenhouse Gas Emissions and Sinks: 1990-2022]
Calculation: Agriculture sector emissions of 9.4% x 2.65 (per capita total emissions multiplier) = 24.9%. [See sources in footnote above]
USDA Economic Research Service (2024) U.S. agricultural import values outpaced export values in fiscal year 2023. https://www.ers.usda.gov/data-products/chart-gallery/gallery/chart-detail/?chartId=58310
The 3 largest drivers of U.S. agricultural emissions are:[1]
![]() Nitrous oxide (N2O) from soil management – mostly from chemical fertilizers and manure applied to or deposited on cropland and grazing land.[2]
Nitrous oxide (N2O) from soil management – mostly from chemical fertilizers and manure applied to or deposited on cropland and grazing land.[2]![]() Methane (CH4) from enteric fermentation, the digestive fermentation process of ruminants – mostly from beef and dairy cattle.[3]
Methane (CH4) from enteric fermentation, the digestive fermentation process of ruminants – mostly from beef and dairy cattle.[3]![]() N2O and CH4 from the storage and handling of manure – mostly from dairy cattle, pig, and beef cattle operations.[4]
N2O and CH4 from the storage and handling of manure – mostly from dairy cattle, pig, and beef cattle operations.[4]
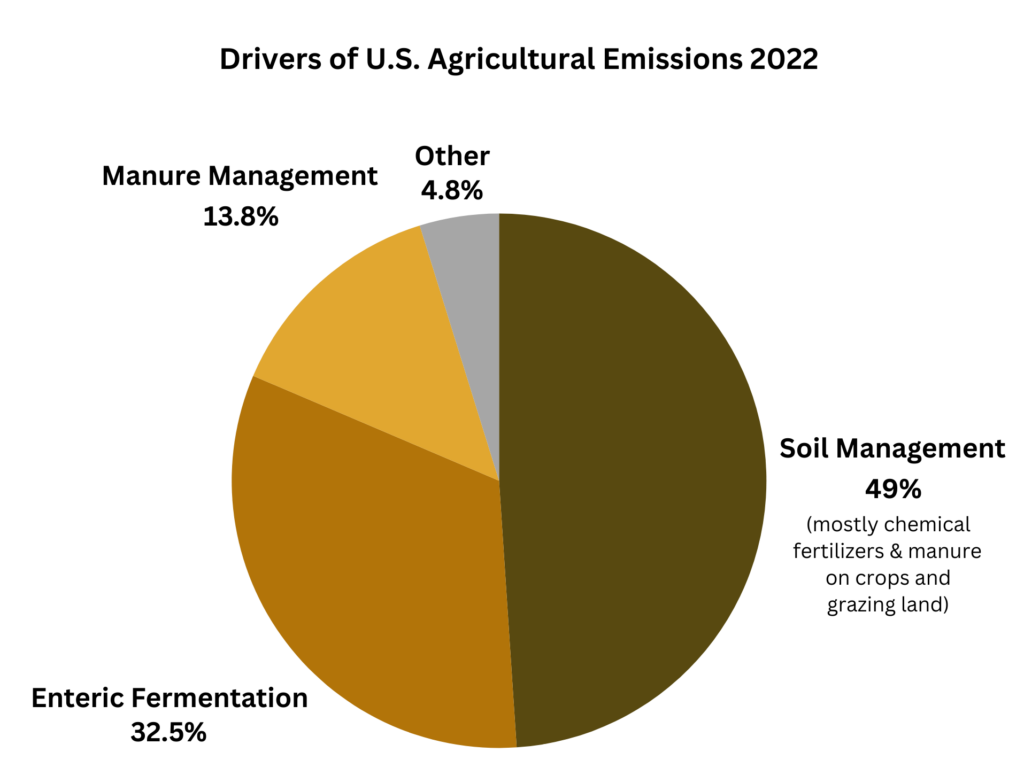
EPA (2024) Inventory of U.S. Greenhouse Gas Emissions and Sinks: 1990-2022, EPA 430-D-24-004, Table 5-1.[Soil management = 290.8 million metric tonnes CO2 eq. / 593.4 = 49.0%. Enteric fermentation = 192.6 / 593.4 = 32.5%. Manure management = 64.7 + 17 / 593.4 = 13.8%. Other = 4.8%]
Shcherbak, I., et al., (2014). Global meta-analysis of the nonlinear response of soil nitrous oxide (N2O) emissions to fertilizer nitrogen. Proceedings of the National Academy of Sciences, 111(25), 9199-9204, p. 9199. [N2O emissions from agricultural soils are “primarily as a result of the addition of synthetic nitrogen (N) fertilizers and animal manure to soil.”]
EPA (2024) Inventory of U.S. Greenhouse Gas Emissions and Sinks: 1990-2022, p. 5-4 and Table 5-3. [In 2022, 71 % attributed to beef cattle, and 25% to dairy cattle]
EPA (2024) Inventory of U.S. Greenhouse Gas Emissions and Sinks: 1990-2022, Table 5-6. [In 2022, 48% of manure management emissions attributed to dairy cattle operations, 31% to pig operations, and 13% to beef cattle operations]

EPA (2024) Inventory of U.S. Greenhouse Gas Emissions and Sinks: 1990-2022, EPA 430-D-24-004.[soil management, section 5.4; enteric fermentation, section 5.1; manure management, section 5.2; rice cultivation, section 5.3; liming, section 5.5; urea fertilization, section 5.6; field burning, section 5.7]

The largest share is N2O (nitrous oxide), primarily due to fertilizer applications and farming practices that increase nitrogen availability in the soil (~94% of agricultural N2O).[1]
The largest share of CH4 (methane) comes from livestock enteric fermentation and manure management (~93% of agricultural CH4).[2]
EPA (2024) Inventory of U.S. Greenhouse Gas Emissions and Sinks: 1990-2022, EPA 430-D-24-004, Table 5-1. [“These activities include synthetic nitrogen fertilization; application of managed livestock manure; application of other organic materials such as biosolids (i.e., treated sewage sludge); deposition of manure on soils by domesticated animals in pastures, range, and paddocks (PRP) (i.e., unmanaged manure); retention of crop residue (nitrogen-fixing legumes and non-legume crops and forages); and drainage of organic soils.” at p. 5-28]
EPA (2024) Inventory of U.S. Greenhouse Gas Emissions and Sinks: 1990-2022, Table 5-1. [“This microbial fermentation process, referred to as enteric fermentation, produces CH4 as a byproduct, which can be exhaled or eructated by the animal.” at p. 5-4. “When livestock manure is stored or treated in systems that promote anaerobic conditions (e.g., as a liquid/slurry in lagoons, ponds, tanks, or pits), the decomposition of the volatile solids component in the manure tends to produce CH4.” at p. 5-11]
Global warming potential (GWP) is a multiplier used to compare the relative impact of different greenhouse gases by converting emissions into CO2 equivalents. Different gases can have different effects on the Earth’s warming in two ways: the ability to absorb energy (capacity to trap and radiate heat downwards) and the length of time the gases stay in the atmosphere. GWP accounts for both aspects.[1] The EPA follows the GWP protocols of the IPCC as follows:[2]
![]() Carbon dioxide (CO2) – is used as a reference and has a GWP factor of 1. CO2 remains in the climate system for more than a thousand years, with some portions remaining for hundreds of thousands of years.[3,4]
Carbon dioxide (CO2) – is used as a reference and has a GWP factor of 1. CO2 remains in the climate system for more than a thousand years, with some portions remaining for hundreds of thousands of years.[3,4]
![]() Methane (CH4) – The EPA calculates its lifetime in the atmosphere at 12 years. Methane has a GWP factor of 28 over a 100-year period.
Methane (CH4) – The EPA calculates its lifetime in the atmosphere at 12 years. Methane has a GWP factor of 28 over a 100-year period.
![]() Nitrous Oxide (N2O) – The EPA calculates its lifetime in the atmosphere at 114 years. It has a GWP factor of 265 over a 100-year period.[5]
Nitrous Oxide (N2O) – The EPA calculates its lifetime in the atmosphere at 114 years. It has a GWP factor of 265 over a 100-year period.[5]
U.S. EPA (2024) Understanding Global Warming Potentials. https://www.epa.gov/ghgemissions/understanding-global-warming-potentials
EPA (2024) Inventory of U.S. Greenhouse Gas Emissions and Sinks: 1990-2022, EPA 430-D-24-004, p. ES-3.
NOAA Research (May 23, 2023) NOAA index tracks how greenhouse gas pollution amplified global warming in 2022. https://research.noaa.gov/2023/05/23/noaa-index-tracks-how-greenhouse-gas-pollution-amplified-global-warming-in-2022/ [“A substantial fraction of CO2 emitted today will persist in the atmosphere for more than 1,000 years.”]
IPCC (2013) Climate Change 2013: The Physical Science Basis. Contribution of Working Group I to the Fifth Assessment Report of the Intergovernmental Panel on Climate Change. (Stocker, T.F., et al., (eds.). Cambridge University Press, Cambridge, United Kingdom and New York, NY, USA, Chapter 6, Box 6.1, pp. 472-473. [The removal of some portions of CO2 are completed “within several hundred thousand years…”]
U.S. EPA (2024) Inventory of U.S. Greenhouse Gas Emissions and Sinks: 1990-2022, p. ES-3.
The EPA reports GHG emissions in carbon dioxide equivalents, or “CO2 Eq.” This is a unit of measurement applied to greenhouse gases other than CO2 that equalizes the global warming potential (GWP), assigning multipliers to gases like methane and nitrous oxide which pound-for-pound have much higher impacts.[1] This protocol follows guidelines set by the IPCC and in accord with the Paris Agreement to which the U.S. is a party.[2]
EPA (2024) Inventory of U.S. Greenhouse Gas Emissions and Sinks: 1990-2022, EPA 430-D-24-004, p. ES-3. [GHG emissions are also reported in kilotons (without CO2 equivalencies)]
EPA (2024) Inventory of U.S. Greenhouse Gas Emissions and Sinks, Box ES-1, pp. ES-1 to ES-2.