A subsidy is “Monetary assistance granted by a government to a person or group in support of an enterprise regarded as being in the public interest.”[1]
A more nuanced definition explains that a subsidy is “any government assistance that (i) allows consumers to purchase goods and services at prices lower than those offered by a perfectly competitive private sector, or (ii) raises producers’ incomes beyond those that would be earned without this intervention.”[2]
“subsidies” (n.d.) American Heritage Dictionary.com
Schwartz, G., & Clements, B. (1999). Government subsidies. Journal of Economic Surveys, 13(2), 119-148, p. 120.
![]() Complexity – The number of subsidy programs is astonishingly large and the details within each program can be complex.[1-3]
Complexity – The number of subsidy programs is astonishingly large and the details within each program can be complex.[1-3]
![]() Constant Variation – The subsidy landscape changes from year to year, and sometimes from month to month depending on laws and policy decisions, weather, markets, diseases, and other unpredictable circumstances.
Constant Variation – The subsidy landscape changes from year to year, and sometimes from month to month depending on laws and policy decisions, weather, markets, diseases, and other unpredictable circumstances.
U. S. GAO (December 2024) Farm Programs: USDA Financial Assistance to Agricultural Producers for Fiscal Years 2019–2023, GAO-25-107174, p. 21. [The report notes that it covers 27 subsidy programs while acknowledging that there are a wide range of programs beyond their scope: “Our analysis did not include technical assistance, farm loan programs, or subsidies paid to crop insurance companies to offset the administrative and operating expenses incurred to provide insurance policies to producers. Additionally, our analysis did not include certain conservation programs that made payments to partners or third-party entities rather than directly to agricultural producers.”]
Congressional Research Service (Dec. 16, 2024) The 2024 Farm Bill: H.R. 8467 Compared with Current Law, R48167. [Note: See more than a hundred pages of Table 2: “Current Law/Policy” that includes a vast of array of current agricultural subsidy programs. pp. 22-134.]
Chris Edwards (2023) Cutting Federal Farm Subsidies, CATO Institute Briefing Paper, No. 162, p. 1. https://www.cato.org/briefing-paper/cutting-federal-farm-subsidies [According to the author’s informal tally, the USDA “runs more than 150 programs that provide direct subsidies and indirect support to farm businesses.”]
The 2 largest categories of subsidies are crop insurance and the group of programs known as direct payments. Most payments to farms and farmers come from these 2 categories.
![]() Crop insurance – The USDA maintains a database that includes total subsidies by year and by crop.[1,2]
Crop insurance – The USDA maintains a database that includes total subsidies by year and by crop.[1,2]
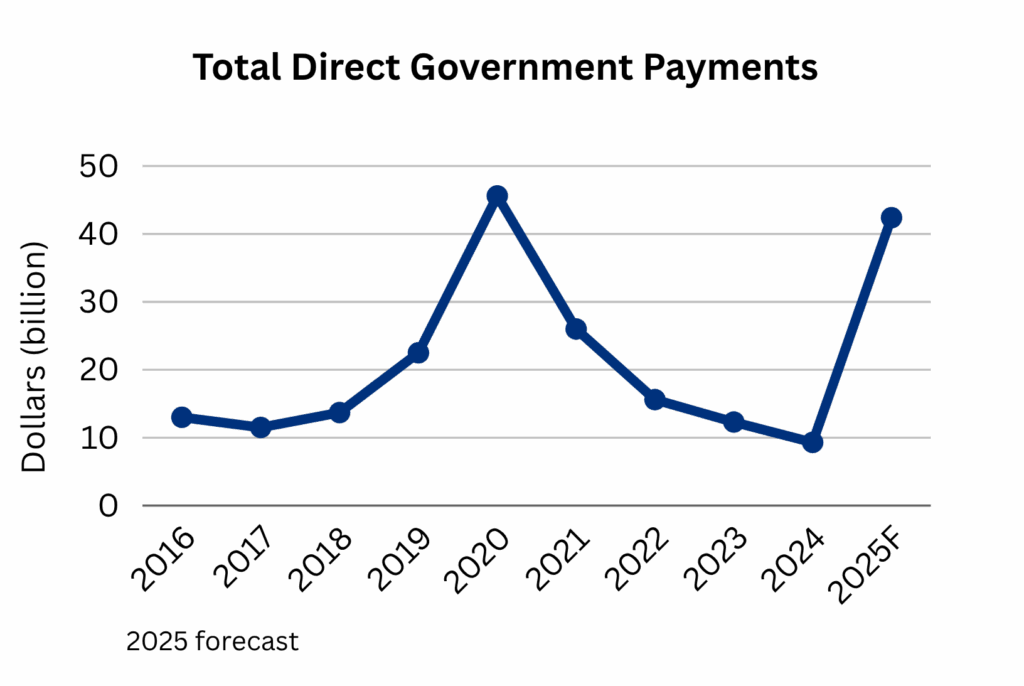
![]() Direct payments – The USDA also maintains a site documenting yearly farm income figures that tallies individual programs considered direct payments to agricultural operations, along with grand totals by year.[3]
Direct payments – The USDA also maintains a site documenting yearly farm income figures that tallies individual programs considered direct payments to agricultural operations, along with grand totals by year.[3]
USDA Risk Management Agency Summary of Business Reports. https://www.rma.usda.gov/tools-reports/summary-of-business/national-summary-of-business-reports
Note: Total costs of crop insurance are made up of 3 components: a) crop insurance subsidies or the portion of insurance premiums paid by the government, b) administrative costs, and c) underwriting gains paid to insurers. See, USDA ERS (4/21/25) Risk Management – Crop Insurance at a Glance, Federal Crop Insurance Program. [“In 2022, the cost of the program delivery (administrative costs) was $2.18 billion and $4.18 billion was paid as underwriting gains to AIPs (Approved Insurance Providers). Total FCIP outlays (the sum of premium subsidies, program delivery costs, and underwriting gains) for 2012–22 averaged $10.58 billion, which is a notable increase compared to the prior decade’s average (direct costs averaged $5.85 billion for 2001–11).”]
USDA ERS (updated February 6, 2025) Farm Income and Wealth Statistics – Government payments by program. https://data.ers.usda.gov/reports.aspx?ID=4050
Ten-year trends are shown below:[1,2]

For breakdown, totals, and references, see: Estimated Cost of Major Agricultural Subsidies. https://docs.google.com/spreadsheets/d/1S8LMCG0XIX7Jt2JhdCn6aGhBH6EpTQNC–jpKsv0Y68/edit?gid=0#gid=0
Note: Both past and forecast figures are often updated by various agencies. Some figures vary slightly between agencies. We did not make extra efforts to adjust according to the latest updates. Our goal on these pages is to tell the big picture about subsidies.
The average cost of federal agricultural subsidies is about $30 billion per year.[1-4]
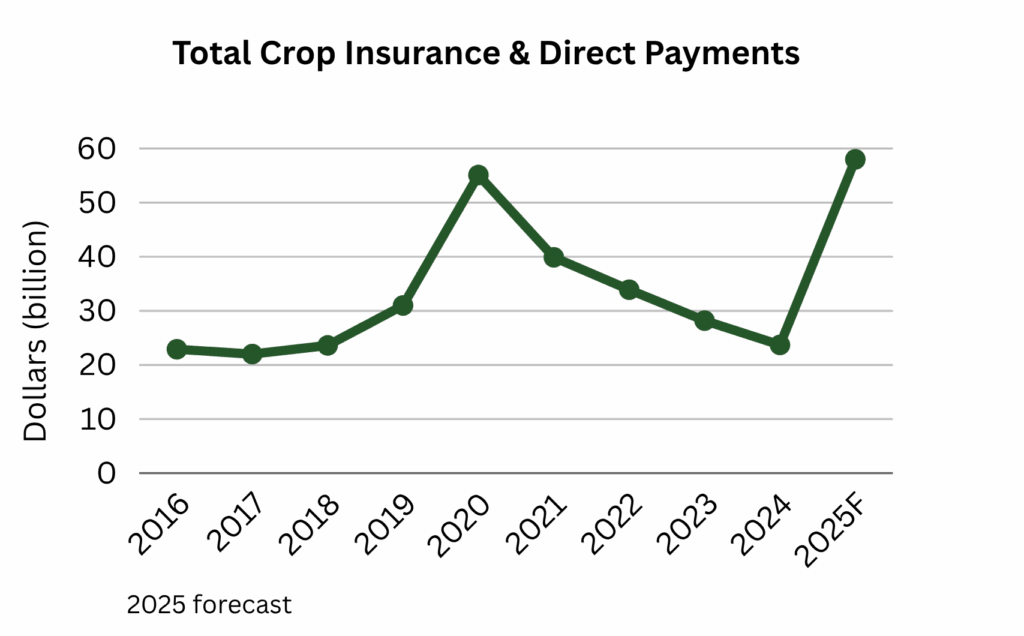
This is a conservative estimate: ![]() It only includes the two largest categories: crop insurance and direct payments.
It only includes the two largest categories: crop insurance and direct payments.![]() It does not include many other subsidies, such as farm loans, marketing aids, export assistance, tax credits, food purchasing programs, and agricultural research, including cooperative extensions. Some of these are multi-billion dollar programs.[5,6]
It does not include many other subsidies, such as farm loans, marketing aids, export assistance, tax credits, food purchasing programs, and agricultural research, including cooperative extensions. Some of these are multi-billion dollar programs.[5,6]![]() The effects of climate change, wildfires, drought, and shrinking freshwater supplies are steadily increasing risks for all producers.
The effects of climate change, wildfires, drought, and shrinking freshwater supplies are steadily increasing risks for all producers.![]() Total subsidies in recent years have trended higher.[7]
Total subsidies in recent years have trended higher.[7]![]() Our calculations are based on some figures that have not been inflation-adjusted.
Our calculations are based on some figures that have not been inflation-adjusted.![]() Recent changes to agricultural subsidy policy will likely add to subsidy costs in future years.[8]
Recent changes to agricultural subsidy policy will likely add to subsidy costs in future years.[8]
For context, $30 billion is a little less than 1/2 of one percent of total federal spending, or about 45 cents out of every hundred dollars. It is also more than 3 times the size of the $9 billion budget for the EPA in 2024 (including its 15,000-person workforce).[9]
If $30 billion were divided equally among the 864,000 farms with annual sales of $10,000 or more, each farm would receive about $35,000.[10]
For breakdown and totals, see, Estimated Cost of Major Agricultural Subsidies. https://docs.google.com/spreadsheets/d/1S8LMCG0XIX7Jt2JhdCn6aGhBH6EpTQNC–jpKsv0Y68/edit?gid=0#gid=0 [We do not include the forecast figure for 2025 in our calculation.]
U.S. GAO (December 2024) Farm Programs: USDA Financial Assistance to Agricultural Producers for Fiscal Years 2019–2023, GAO-25-107174, p. 8. [“On average, USDA distributed about $32.1 billion in each of the 5 years.”]
Baldwin, K., et. al., (2024). Recent developments in ad hoc assistance programs for agricultural producers, USDA ERS, Report No. EIB-278. [See Figure 1, p. 13 showing 11 years since 1999 above $30 billion. Includes a wide range of subsidy programs; figures are not inflation-adjusted.]
Chris Edwards (2023) Cutting Federal Farm Subsidies, CATO Institute Briefing Paper, No. 162, p. 1. [“The federal government spends more than $30 billion a year on subsidies for farm businesses and agriculture.”]
See for example, Congressional Research Service (November 22, 2022) Agricultural Research: Background and Issues, R40819, Summary. [“Discretionary funding for the REE mission area (Research, Education, and Economics) totaled approximately $3.5 billion in FY2022, and mandatory funding from the 2018 farm bill adds another $208 million per year on average.”]
Congressional Research Service (July 25, 2024) Trends in USDA Procurement of U.S. Food and Agricultural Products, R48141, Summary. [In 2023 the USDA “accounted for the majority of purchases of food and agricultural products, totaling roughly $5.0 billion…”]
For 2025 forecast of direct payments, see: USDA ERS (updated 2/6/25) Farm sector income & finances: Farm sector income forecast. https://www.ers.usda.gov/topics/farm-economy/farm-sector-income-finances/farm-sector-income-forecast [“Direct Government farm program payments are forecast at $42.4 billion for 2025, a $33.1-billion increase above the $9.3-billion total forecast for 2024. This overall increase reflects higher anticipated payments from supplemental and ad hoc disaster assistance, mainly from the funding authorized in Disaster Relief Supplemental Appropriations Act, 2025 contained in the American Relief Act, 2025.”]
U.S. Congress, H.R.1 – One Big Beautiful Bill Act, 119th Congress (2025-2026)
U.S. EPA (May 30, 2025) EPA’s Budget and Spending. https://www.epa.gov/planandbudget/budget
USDA (2024) 2022 Census of Agriculture, Table 1, p. 3. [$30,000,000,000 / 863,780 farms = $34,722. These include all farms producing more than $10,000 in value of agricultural products sold, including crops or animal products or both.]
In the years from 2018 through 2024, income from direct payments and from crop insurance have constituted about 23% of net farm income.[1-3]

For analysis, see, U.S. Subsidy Payments to Farmers 2018–2025 https://docs.google.com/spreadsheets/d/1woG3fsFfXx0yg6ATTuTkRd340l4x0H_EHjBcl4KTO9k/edit?gid=0#gid=0
Notes: a) Not including the spike in 2020 due to covid relief, the share is about 20%. b) The forecasted figure for 2025 is above $50B as of July 2025. c) The government pays 62% of crop insurance premiums. We use 62% of all paid indemnities as the value of the farm income from crop insurance. This is likely a conservative figure, since the government also pays administrative and operating costs along with additional underwriting gains to the approved insurance companies to enhance their profitability. Presumably the farmers are getting an added benefit from these additional payments and without them, their insurance costs would be higher.
For 62% figure, see, U. S. GAO (December 2024) Farm Programs: USDA Financial Assistance to Agricultural Producers for Fiscal Years 2019–2023, GAO-25-107174, p. 7. [“The crop insurance program subsidizes, on average, 62 percent of the premiums that producers pay on an annual basis.”]
![]() Farmers, ranchers, and factory farm operators increase their incomes.[1-3]
Farmers, ranchers, and factory farm operators increase their incomes.[1-3]![]() Farmers, ranchers, and landowners increase their wealth and the value of their land holdings.[4-6]
Farmers, ranchers, and landowners increase their wealth and the value of their land holdings.[4-6]![]() The cost of renting farmland increases.[7]
The cost of renting farmland increases.[7]![]() Slightly more crops are grown, especially monoculture feed crops.[8-10]
Slightly more crops are grown, especially monoculture feed crops.[8-10]![]() Americans probably get a little unhealthier.[11]
Americans probably get a little unhealthier.[11]![]() Some marginal lands are put into crop rotation negatively impacting the environment and wildlife.[12]
Some marginal lands are put into crop rotation negatively impacting the environment and wildlife.[12]
There is little information regarding the impact of agricultural subsidies on food prices. As noted above, much of the value from subsidies translates into increases in farmer income and wealth, land values, and land rental prices. It seems intuitive that subsidies would slightly decrease final costs due to the somewhat higher levels of production, though evidence of this is limited. And it seems possible that the higher land values and rental costs would offset the effects of slightly larger production.
As noted above, ~20% of farm income comes from government subsidies.
Kirwan, B. E. (2009). The incidence of US agricultural subsidies on farmland rental rates. Journal of political economy, 117(1), 138-164. [“Accounting for nearly the full subsidy dollar with these two largely independent estimates provides confidence in an approximately 25/75 landlord-tenant split of the marginal subsidy dollar.” The “tenant” is the farm operator, who gains most of the value of the subsidy.]
Lim, K., et al., (2024). America’s farms and ranches at a glance: 2024 edition. USDA ERS, Report No. EIB-283, p. 15. [Considering only family farms and not non-family farms (generally with higher incomes), in 2023 family farms had a median income about 22% above average. “As in previous years, the median total income of all U.S. family farm households ($97,984) was greater in 2023 than the median income of all U.S. households ($80,610).”]
Ciaian, P., et al., (2021). The capitalization of agricultural subsidies into land prices. Annual Review of Resource Economics, 13(1), 17-38, p. 26. [“The average capitalization rate across all estimates and subsidy types is 33% for land rents and 12% for land values. On average, the estimates for rents are greater for the United States (42%) than for the EU (26%), while for land values, they tend to be more alike (14% and 9%, respectively)…”]
Cynthia Nickerson et. al., (2012) Trends in U.S. Farmland Values and Ownership Economic Information, USDA ERS, Bulletin Number 92, p. 19 and Figure 15, p. 20. [“Although cropland values generally increase with insurance premium subsidies, the pattern is less consistent for DCP (direct and counter-cyclical) payments.”]
Lim, K., et al., (2024), p. 16. [“Median total household wealth for family farm households in 2023 was $1.44 million … higher than that for all U.S. households ($0.20 million) and self-employed U.S. households ($0.46 million). The value of land comprises the largest share of most farm households’ wealth.”]
Kirwan, B. E., & Roberts, M. J. (2016). Who really benefits from agricultural subsidies? evidence from field‐level data. American journal of agricultural economics, 98(4), 1095-1113, p. 1111. [“The marginal subsidy dollar causes rental rates to increase by 24.9 cents on soybean fields, 20.0 cents on rice fields, and 27.5 cents on cotton fields.”]
Lubowski, R. N., et al., (2006). Environmental effects of agricultural land-use change: The role of economics and policy. USDA ERS, Rpt. No. 25, p. 46. [“Our results indicate that the increase in crop insurance subsidies changed land use measurably, but modestly.”]
Yu, J., Smith, A., & Sumner, D. A. (2018). Effects of crop insurance premium subsidies on crop acreage. American Journal of Agricultural Economics, 100(1), 91-114, p. 111. [“Our estimates imply that crop insurance premium subsidies have economically significant effects on crop acreage. …a 10% increase in the subsidy per dollar of liability increases the planted acreage by 0.43%.”]
Alizamir, S., et al., (2019). An analysis of price vs. revenue protection: Government subsidies in the agriculture industry. Management Science, 65(1), 32-49. p. 34. [“While the PLC (Price Loss Coverage) program always motivates the farmers to plant more acres compared to when no subsidy is offered, the farmers may plant fewer acres under ARC (Agriculture Risk Coverage).”]
Siegel, K. R., et al., (2016). Association of higher consumption of foods derived from subsidized commodities with adverse cardiometabolic risk among US adults. JAMA internal medicine, 176(8), 1124-1132, Abstract. [“Among US adults, higher consumption of calories from subsidized food commodities was associated with a greater probability of some cardiometabolic risks… the government from 1995 to 2010 spent $170 billion on subsidizing the production of foods that were associated with obesity…”]
Lubowski, R. N., et al., (2006), p. 47 and 51. [“While the insurance policy change is estimated to affect just about 1 percent of total cultivated cropland, the increase in insurance subsidies appears to have had the largest effect for low-productivity and certain environmentally sensitive land … Estimated lands in cultivation due to the increase in crop insurance subsidies include some areas with high populations of imperiled wildlife species.”] See the following page with more details: Perspectives on Subsidies [question: Do subsidies have direct environmental impacts?]
There are many reports showing that the majority of farm subsidies support the largest producers, and that some very large payments go to wealthy farmers and landowners.
![]() According to the GAO, from 2019 through 2023, about 7% of program participants received 63% of total assistance (including directs payments and crop insurance).[1]
According to the GAO, from 2019 through 2023, about 7% of program participants received 63% of total assistance (including directs payments and crop insurance).[1]
![]() According to the U.S. Census of Ag, about 41% of government payments in 2022 (not including crop insurance) went to farms with sales above $1 million. These farms produced about 79% of the total market value of agricultural production.[2]
According to the U.S. Census of Ag, about 41% of government payments in 2022 (not including crop insurance) went to farms with sales above $1 million. These farms produced about 79% of the total market value of agricultural production.[2]
![]() According to the GAO, in 2022 more than 1,300 crop insurance policyholders had adjusted gross incomes over $900,000. They noted however, that this group accounted for about 0.5 percent of total premiums in the program.[3]
According to the GAO, in 2022 more than 1,300 crop insurance policyholders had adjusted gross incomes over $900,000. They noted however, that this group accounted for about 0.5 percent of total premiums in the program.[3]
![]() According to the GAO, from 2019 through 2023, the top 100 producers received about $6 million per year on average (direct payments and crop insurance) while the top 10 producers received $18 million per year on average. In 2022 one recipient received an astonishing $215 million.[4]
According to the GAO, from 2019 through 2023, the top 100 producers received about $6 million per year on average (direct payments and crop insurance) while the top 10 producers received $18 million per year on average. In 2022 one recipient received an astonishing $215 million.[4]
![]() According to the Environmental Working Group, more than 9,000 producers have received funds for 40 straight years.[5] EWG also reported that 25 members of the House of Representatives collected a total of $14 million in federal farm subsidies from 1995-2021.[6]
According to the Environmental Working Group, more than 9,000 producers have received funds for 40 straight years.[5] EWG also reported that 25 members of the House of Representatives collected a total of $14 million in federal farm subsidies from 1995-2021.[6]
![]() In addition, a large portion of crop insurance costs support insurance companies, many of them publicly traded or foreign owned. As EWG reports, “Crop insurance companies and agents received almost $33.3B from taxpayers and farmers over the last 10 years.”[7]
In addition, a large portion of crop insurance costs support insurance companies, many of them publicly traded or foreign owned. As EWG reports, “Crop insurance companies and agents received almost $33.3B from taxpayers and farmers over the last 10 years.”[7]
U. S. GAO (December 2024) Farm Programs: USDA Financial Assistance to Agricultural Producers for Fiscal Years 2019–2023, GAO-25-107174, p. 1 “What GAO Found.”
2022 Census of Ag Table 3 – [Calculation: Government payments of $4.29B / $10.44B = 41%. Market value of agricultural products sold of $427.7B / $543.1B = 79%]
U.S. GAO (November 2023) Crop Insurance: Update on Opportunities to Reduce Program Costs, GAO-24-106086.
U. S. GAO (December 2024) Farm Programs: USDA Financial Assistance to Agricultural Producers for Fiscal Years 2019–2023, p. 15.
Jared Hayes (May 20, 2025) Almost 10,000 farmers have received subsidies for 40 straight years, Environmental Working Group. https://www.ewg.org/news-insights/news/2025/05/almost-10000-farmers-have-received-subsidies-40-straight-years
Jared Hayes & Eve Devens (March 28, 2023) 25 current members of the House collected $14 million in federal farm subsidies, Environmental Working Group.
https://www.ewg.org/news-insights/news/2023/03/25-current-members-house-collected-14-million-federal-farm-subsidiesAnne Schechinger (July 12, 2023) One-third of all crop insurance subsidies flow to massive insurance companies and agents, not farmers. Environmental Working Group. https://www.ewg.org/research/one-third-all-crop-insurance-subsidies-flow-massive-insurance-companies-and-agents-not