The figures on worker demographics from the Census Bureau and the BLS (Bureau of Labor Statistics) should generally be considered baseline figures only. There are significant challenges in determining citizenship status, country of birth, race, gender, and ethnicity of U.S. workers, particularly in the slaughter and processing industry.[1,2] This is due in part to the lack of comprehensive government figures for undocumented immigrants, as would be expected.[3]
Government surveys are also likely to undercount those workers who may not be firmly rooted in their communities such as workers on one-year H2B visas, refugees resettled by the government, or immigrants who have overstayed their period of lawful admission.[4-8]
As one example of the potential disparities between government figures and on-site realities, a recent USDA report evaluating worker health at six large pig slaughter plants found that for about 90% of survey participants, a language other than English was their primary language.[9,10]
Congressional Research Service (Sept. 2024). In Focus: Citizenship and Immigration Statuses of the U.S. Foreign-Born Population. https://crsreports.congress.gov/product/pdf/IF/IF11806 [“Researchers find that government surveys tend to undercount the foreign-born population, particularly the unauthorized, compared with the native-born population.”]
Angela Stuesse & Nathan T. Dollar (2020). Who are America’s meat and poultry workers? Economic Policy Institute. [“Specifically, ethnographic research suggests that the ACS (U.S. Census Bureau’s American Community Survey) likely significantly undercounts people in undocumented poultry and meatpacking communities, suppressing the numbers of Latinx and other foreign-born and noncitizen workers represented in the data.”]
U.S. Dept. of Labor, BLS (2024) Employment Situation Frequently Asked Questions.
https://www.bls.gov/news.release/empsit.faq.htm [“It is likely that both surveys include at least some undocumented immigrants. However, neither the establishment nor the household survey is designed to identify the legal status of workers.”Costa, D. (March 2021). Claims of labor shortages in H-2B industries don’t hold up to scrutiny, Economic Policy Institute, Working Economics Blog, table 1. [Reports that 11,059 H-2B positions were certified in 2020 for workers in occupations classified as Meat, Poultry, and Fish Cutters and Trimmers.]
Samantha Ayoub (October 31, 2024). Agricultural Labor: The H-2B Program, Market Intel, American Farm Bureau. [Reports that 9,582 H-2B positions were certified in 2023 for workers in occupations classified as Meat, Poultry, and Fish Cutters and Trimmers.]
David Kallick & Cyierra Roldan (2018). Refugees as Employees: Good Retention, Strong Recruitment, Fiscal Policy Institute, p. 29. [Report notes an analysis of 2016 data showing that 1.3% of refugees in the U.S. work in animal slaughter and processing. About 60,000 refugees were admitted to the U.S. in 2023, according to the Dept of Homeland Security.]
Simone Foxman and Ella Ceron (March 11, 2024). Tyson Is Hiring New York Immigrants for Jobs No One Else Wants, Bloomberg News. https://www.bloomberg.com/news/articles/2024-03-11/tyson-is-hiring-new-york-immigrants-for-jobs-no-one-else-wants [“Dolan (a senior manager) says the company expects about 40% of the 100,000 people in these roles will leave each year, a statistic he says is standard across the meatpacking industry.”]
Frydenlund, S. & Dunn, E.C. (2022). Refugees and racial capitalism: Meatpacking and the primitive accumulation of labor. Political Geography, 95, 102575, p. 2. [“While the greatest proportion of immigrants in US meatpacking are still from Mexico, over the last ten years the industry has increasingly relied on refugees who are placed in the plants by the agencies who resettle them on behalf of the US government. People displaced by civil war and conflict in Myanmar, Somalia, South Sudan, Ethiopia and other locations are now a vital source of workers for the meatpacking industry.”]
USDA FSIS (January 9, 2025). Swine Processing Line Speed Evaluation Study, Harris-Adamson, C. et al., (Researchers, Univ. of California, San Francisco), p. 108, Appendix 5. [We averaged the rates by plant, with 5 plants above 90% and one plant at ~70%. Average is 91%]
UFCW Local 7 news release (September 24, 2024). UFCW Local 7 condemns JBS for abusing immigrant workers. https://www.ufcw7.org/l7press/2024-09-24-ufcw-local-7-condemns-jbs-for-abusing-immigrant-workers [According to union workers at the JBS plant in Greeley, Co., “By the very end of 2023 and throughout 2024, new hires are now largely Haitian refugees, a vulnerable population that has been unduly targeted across the country… The overwhelming majority of workers at the plant are immigrants, and the plant has historically employed large numbers of Latin American, Horn of Africa, and Myanmar immigrants. Employees at the facility speak over 50 different languages.”]
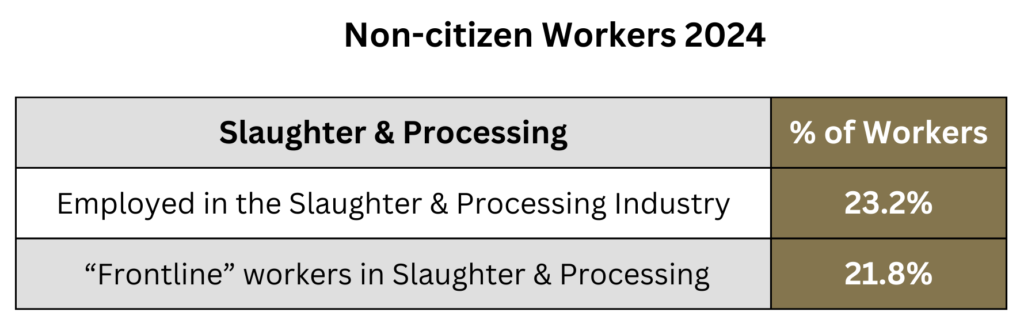
According to the U.S. Census Bureau, in 2024, ~23% of all workers in the livestock/poultry slaughter and processing industry were noncitizens.[1] Of workers considered “frontline” by job description and duties, ~22% were non-citizens.[2]
For this question as well as the following questions, we distinguish between all industry workers and those that might be considered “frontline.” Industry figures include workers engaged in the actual handling of meat or poultry, as well as those in other areas, such as administration, transportation, and sanitation. The sub-category of “frontline” workers, although an imprecise term, we use to estimate those most likely working on slaughter lines or using knives and machinery to disassemble animal carcasses.[4] (The term is used in the media with varying definitions and is sometimes conflated with industry figures.)
U.S. Census Bureau, American Community Survey 1-year Public Use Microdata Samples 2024. [Variables: NAICS Animal Slaughtering & Processing and Citizenship status. Total workers = 538,953; not a U.S. citizen = 125,244, or 23.2%] Note: The 2025 survey was not released of of this writing.
U.S. Census Bureau, American Community Survey 1-year Public Use Microdata Samples 2024. [variables: Citizenship Status and Standard Occupation Classification (PRD Butchers and Other Meat, Poultry, and Fish Processing Workers). Total workers = 294,040; not a U.S. citizen = 64,199, or 21.8%]
For the distinction between the BLS classification of workers by industry and by job description as well as more detailed info on how we delineate “frontline” workers, see Slaughter and Processing Worker Totals.
According to the U.S. Census Bureau, in 2024, ~36% of all workers in the livestock/poultry slaughter and processing industry were foreign-born.[1] Of workers considered “frontline” by job description and duties, ~35% were foreign-born.[2]
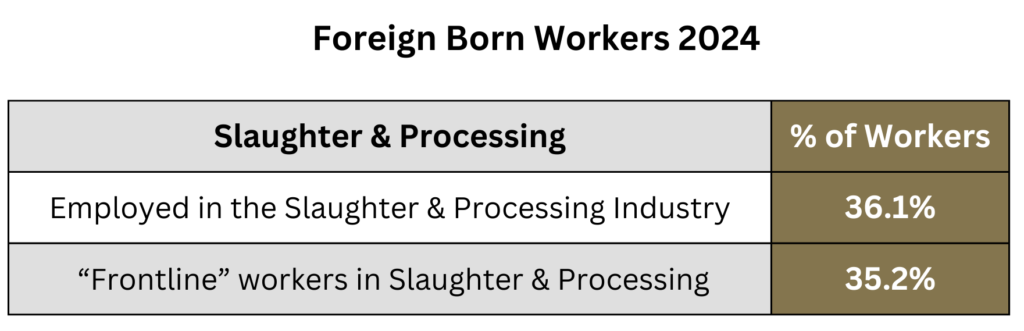
U.S. Census Bureau, American Community Survey 1-year Public Use Microdata Samples 2024. [Variables: NAICS Animal Slaughtering & Processing Industry and Citizenship status. Total workers = 538,953. Born in the U.S. = 344,156. Therefore 538,953 – 344,156 = 194,797 (foreign born) / 538,953 = 36.1%] Note: The survey for 2025 was not released as of this writing.
U.S. Census Bureau, American Community Survey 1-year Public Use Microdata Samples 2024. [Variables: Standard Occupational Classification (PRD Butchers and Other Meat, Poultry, and Fish Processing Workers). Total workers = 294,040. Born in the U.S. = 190,602. Therefore 294,040 – 190,602 = 103,438 foreign born / 294,040 = 35.2%]
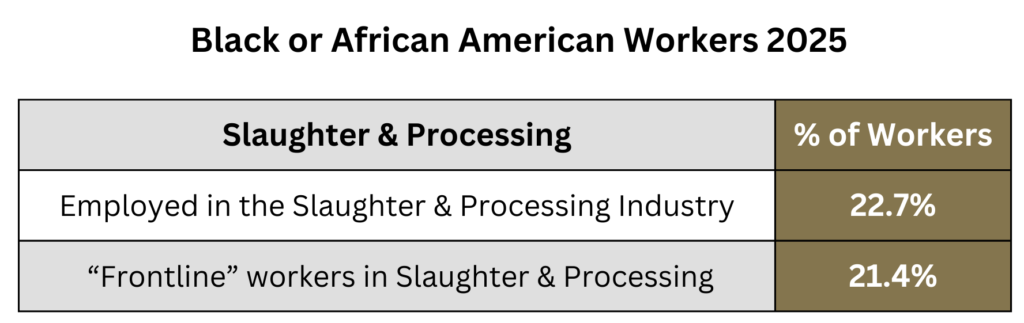
According to the Bureau of Labor Statistics, in 2025, ~23% of workers in the livestock/poultry slaughter & processing industry identify as Black or African American.[1] Of workers considered “frontline” workers, ~21% identify as Black or African American.[2]
About 5% of workers in the industry are Asian.[3] Of workers considered “frontline” by job description and duties, ~6% are Asian.[4]
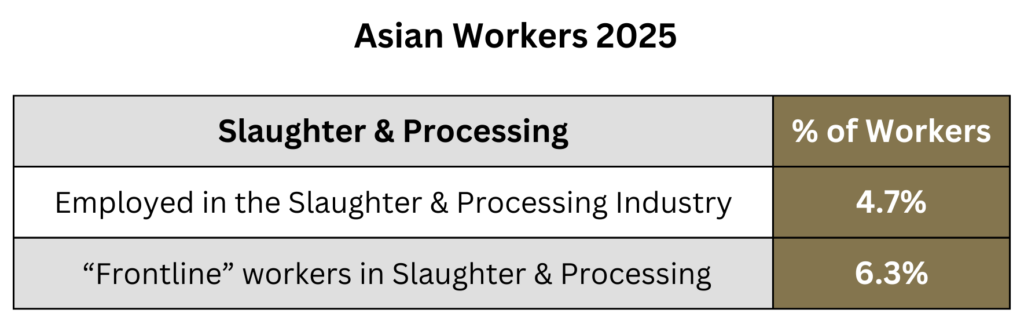
U.S. BLS, Labor Force Statistics from the Current Population Survey, 2025 Annual Averages, Employed persons by detailed industry, sex, race, and Hispanic or Latino ethnicity, Table 18, Food manufacturing/Animal slaughtering and processing.
U.S. BLS, Labor Force Statistics from the Current Population Survey, 2025 Annual Averages, Employed persons by detailed occupation, sex, race, and Hispanic or Latino ethnicity, Table 11, Production occupations/Butchers and other meat, poultry, and fish processing workers.
U.S. BLS, Labor Force Statistics from the Current Population Survey, Table 18.
Current Population Survey, Table 11.
According to the Bureau of Labor Statistics, in 2025, ~40% of workers in the livestock/poultry slaughter & processing industry are women.[1,2] Of workers considered “frontline” by job description and duties, ~22% are women.[3]
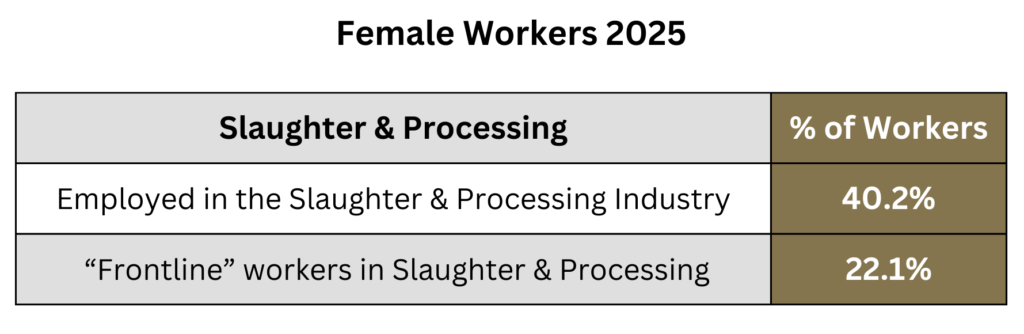
The industry figure is roughly in line with filings by two major U.S. meat and poultry manufacturers, Tyson and Hormel, each reporting that about 39-40% of their total workforce are women.[4,5]
U.S. BLS, Labor Force Statistics from the Current Population Survey, 2025 Annual Averages, Employed persons by detailed industry, sex, race, and Hispanic or Latino ethnicity, Table 18, Food manufacturing/Animal slaughtering and processing.
U.S. BLS, Labor Force Statistics from the Current Population Survey, 2025 Annual Averages, Employed persons by detailed industry, sex, race, and Hispanic or Latino ethnicity, Table 11, Production occupations/Butchers and other meat, poultry, and fish processing workers. [Descriptions of “frontline” workers is more detailed in Slaughter and Processing Worker Totals.]
U.S. Securities and Exchange Commission, Tyson Foods, Inc., Annual Report Form 10-K (Sept. 28,2024), p. 7.[Tyson’s 2025 annual report does not identify the percentage of women in their workforce.]
U.S. Securities and Exchange Commission, Hormel Foods Corp., Annual Report Form 10-K (October 29, 2024), p. 4. [Hormel’s 2025 annual report does not identify the percentage of women in their workforce.]
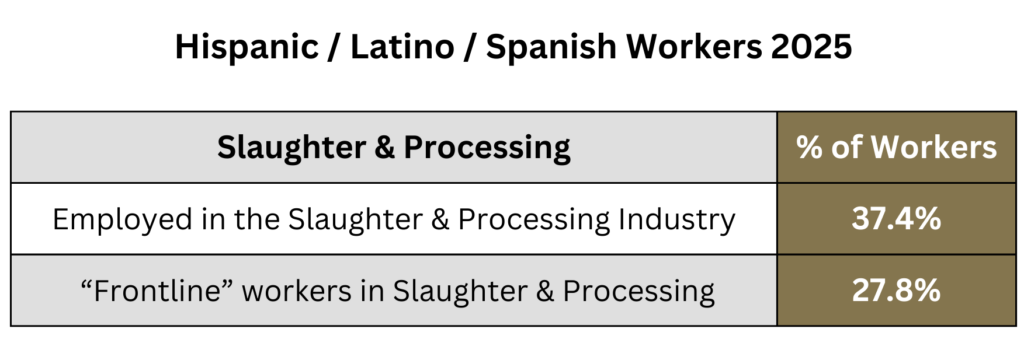
According to the Bureau of Labor Statistics, in 2025, those who identify as Hispanic, Latino, or Spanish, comprise ~37% of workers in the livestock/poultry slaughter and processing industry.[1,2] Of workers considered “frontline” by job description and duties, ~28% identify as Hispanic, Latino, or Spanish.[3,4]
This latter count of frontline workers by the BLS is significantly less than the count in 2023 (~37%). The large difference is probably due to the growing number of immigrants and refugees working in slaughterhouses – workers who are most likely undercounted in the household survey conducted by BLS.[5]
U.S. BLS, Labor Force Statistics from the Current Population Survey, 2025 Annual Averages, Employed persons by detailed industry, sex, race, and Hispanic or Latino ethnicity, Table 18, Food manufacturing/Animal slaughtering and processing.
Note: In the Current Population Survey respondents are asked if they are of Hispanic, Latino, or Spanish origin, which appears before the question on race. Next, all respondents are asked to choose one or more of the following races they consider themselves to be: White, Black or African American, American Indian or Alaska Native, Asian, or Native Hawaiian or Other Pacific Islander. They are reminded that Hispanic origin is not a race. Responses of “other” are accepted and allocated among the race categories. Respondents may choose more than one race. [U.S. Census Bureau & U.S. BLS (2019) Design and Methodology: Current Population Survey, Technical Paper 77, p. 6]
For the distinction between the BLS classification of workers by industry and by job description as well as more detailed info on how we delineate “frontline” workers, see Slaughter and Processing Worker Totals.
U.S. BLS, Labor Force Statistics from the Current Population Survey, 2025 Annual Averages, Employed persons by detailed industry, sex, race, and Hispanic or Latino ethnicity, Table 11, Production occupations/Butchers and other meat, poultry, and fish processing workers.
See, Question #1 above which looks at the disparities between government figures and the on-site realities.