The Bureau of Labor Statistics (BLS) does not try to determine the number of workers specifically on factory farms. Rather, the BLS uses the term “Animal Production and Aquaculture” (NAICS 112) as a classification of industries that “raise or fatten animals for the sale of animals or animal products and/or raise aquatic plants and animals in controlled or selected aquatic environments for the sale of aquatic plants, animals, or their products.”[1]
This category is further broken down into subsectors by animal types and their use in the market, e.g., broilers or poultry hatcheries. Of the workers in “Animal Production,” the great majority are working on factory farms.
U.S. Office of Management and Budget (2022) National American Industry Classification System, p. 88. https://www.census.gov/naics/reference_files_tools/2022_NAICS_Manual.pdf
For 2024, the Bureau of Labor Statistics estimates there were ~237,800 workers employed in “Animal Production.”[1, note a]
The USDA Farm Labor Survey estimates there were ~220,000 hired workers on farms producing livestock, dairy, and poultry in 2024.[2, note b]
A third estimate comes from the U.S. Census Bureau which reports ~591,000 workers employed in all “Animal Production & Aquaculture” industries (NAICS 112).[3] This figure is not a true estimate of annual employment as it is based on the American Community Survey (ACS) which is a household survey (as opposed to a business establishment survey) that includes those currently employed in the industry, as well as those unemployed or not in the labor force who worked in the industry within the past 5 years. However, the ACS survey may capture information on self-employed, unincorporated, and other farm workers that are excluded from the BLS data.[4]
1. U.S. Bureau of Labor Statistics, Quarterly Census of Employment and Wages, 2024 Annual Averages, [search parameters: dairy cattle & milk production (NAICS 11212); cattle ranching & farming, incl feedlots (NAICS 11211); hog & pig farming (NAICS 1122); sheep & goat farming (NAICS 1124); poultry & egg production (including broilers, turkey, poultry hatcheries, and other poultry production) (NAICS1123)] https://data.bls.gov/cew/apps/data_views/data_views.htm#tab=Tables
Note (a): The BLS data uses the North American Industry Classification System (NAICS), a classification of business establishments by their primary activity or production process. Because the data is drawn from state unemployment insurance programs, it does not cover smaller farm employers in those States that exempt them from participation in the unemployment system. At the same time, however, the worker totals are figures for the whole industry which include occupations other than that of working with animals, such as administration, property maintenance, and transportation.
2. USDA, NASS (May 21,2025) Farm Labor, ISSN: 1949-0909.
Note (b): The USDA data comes from a survey targeting operations which meet the definition of a farm or ranch (any place with $1,000 or more in annual agricultural sales or potential sales). Because the survey is based on interviews with a random sampling of farm employers, smaller farms have a chance of being included. In the Labor Report, figures are based on the five sampled weeks between January 2024 and January 2025. An average of 34% worked on livestock, dairy, and poultry farms (p. 20), or ~220,000 workers out of the avg. of total hired farmworkers (646,200) workers in the same period (p. 3). The farm labor survey does not include workers who are employed by farm labor contractors. [See, CRS (January 24, 2025) Measuring Employment in the Agricultural Sector in the Context of the H-2A Visa Program, p. 13.]
3. U.S. Census Bureau, American Community Survey 1-year Public Use Microdata Samples 2024. [Variable: AGR – Animal production & aquaculture (NAICS 1122) by Industry]
4. U.S. Census Bureau email response to inquiry re: difference in Animal Production and Aquaculture workers from BLS data (May 3, 2023).
Dairy cattle and milk production (104,477) have the highest worker totals, accounting for ~44% of total animal production in the NAICS system.[1]

Livestock farming (87,043) accounts accounts for ~37%.[2]
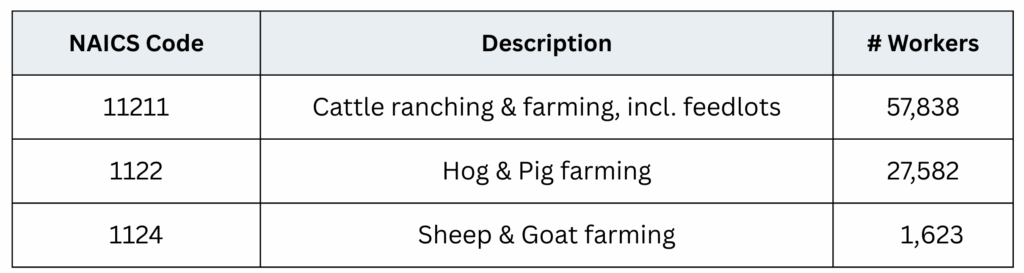
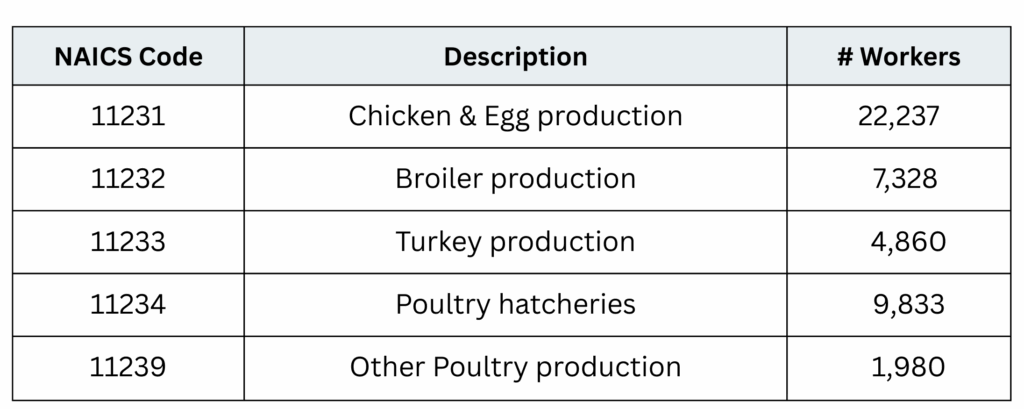
Poultry and egg production (46,238) accounts for ~19%.[3]
1. U.S. Bureau of Labor Statistics, Quarterly Census of Employment and Wages (QCEW) 2024 Annual Averages, Private, NAICS 11212 [excludes aquaculture. Note: The BLS is the only agency that provides data on workers in the sub-sectors of the animal production industries.] (Date accessed 12/6/25; numbers may have changed slightly since that time.)
2. QCEW NAICS 112, 11221, 1124
3. QCEW NAICS 11231, 11232, 11233, 11234, 112390 [Other poultry production comprises operations primarily engaged in raising poultry (except chickens for meat or egg production and turkeys), e.g., ducks, pheasant, geese.]
The BLS almost certainly underestimates the numbers of farm workers as it primarily draws its data from state unemployment insurance records which would not include many of those with temporary visas and certainly would exclude undocumented workers.[1]
According to the Congressional Research Service, in 2023 about 311,000 H-2A visas were issued, of which 6%, or 18,600 were in the “animal production” category.[2] Half of the states exempt H-2A workers from state unemployment taxes, which means that those workers are unlikely to be counted by the BLS.[3,4]
Though there is no official record of the industries that often hire undocumented immigrants, one journalist who has written extensively on the Wisconsin dairy industry (the 2nd largest dairy producing state) estimates that undocumented immigrants perform 80% of the work on Wisconsin dairy farms.[5]
And in a survey of 691 dairy farms across the country, it was estimated that there were almost 130,000 hired workers on U.S. dairy farms in 2018,[6] as opposed to the BLS estimate in the same year of 106,000 employees in the dairy production industry.[7] Thus, it is clear that the BLS data is not capturing the entire dairy farmworker population – nor does the agency purport to do so.
U.S. Bureau of Labor Statistics (2023) Quarterly Census of Employment and Wages: Collections & data sources.
CRS (January 24, 2025) Measuring Employment in the Agricultural Sector in the Context of the H-2A Visa Program, R48368, pp. 17-18.
Martin P. and Rutledge, Z. (2022) Proposed changes to the H-2A program would affect labor costs in the United States and California. Calif Agr 75(3):135-141.
U.S. Bureau of Labor Statistics, Quarterly Census of Employment and Wages, email response (2/28/23) to inquiry
Ruth Conniff (October 2022) Getting past toxic partisanship: Dairy farmers and undocumented
workers, Wisconsin Examiner https://wisconsinexaminer.com/2022/10/24/getting-past-toxic-partisanship-dairy-farmers-and-undocumented-workers/Ribera, L. et al., (March 2020) A National Survey of Hiring, Compensation and Employee Treatment Practices on U.S. Dairy Farms, Center for North American Studies, Table 12. https://nationaldairyfarm.com/wp-content/uploads/2020/07/Nationwide-Dairy-Labor-Survey_FARM-Workforce-Development.pdf
U.S. Bureau of Labor Statistics, Quarterly Census of Employment and Wages 2018 Annual Averages Private, NAICS 112120.