Put simply, nutrient pollution is “too much nitrogen and phosphorus in the air and water.”[1] Nutrient pollution negatively impacts water quality, air quality, greenhouse gas balances, ecosystems and biodiversity, and soil quality.[2]
Since water pollution is the primary impact, nutrient pollution is sometimes specifically defined as “excess amounts of nitrogen and phosphorus in aquatic systems.”[3] Nutrient pollution in water leads to eutrophication.[4]
U.S. EPA (2012) The Facts about Nutrient Pollution, 840-F12-003. [A more complete definition would say “air, water, and soil.”]
Sutton, M. A., et al., (2013). Our nutrient world. The challenge to produce more food & energy with less pollution. Centre for Ecology & Hydrology. [Experienced researchers present a comprehensive overview of the global environmental impacts of nutrient pollution on pp. 32-51, with a good summary on p. 32.]
U.S. EPA (2015) A Compilation of Cost Data Associated with the Impacts and Control of Nutrient Pollution, 820-F-15-096, p. ES-1.
U.S. EPA (2021) Ambient Water Quality Criteria to Address Nutrient Pollution in Lakes and Reservoirs, 822-R-21-005, p. 1. [“One visible consequence of nutrient pollution in lakes and reservoirs … is cultural (anthropogenic) eutrophication, an increase in primary productivity and algal abundance that increases the amount of organic matter in a water body.”]
Eutrophication – is the process by which water accumulates excess nutrients, primarily nitrogen (N) and phosphorus (P), leading to accelerated growth of algae and aquatic plants. This results in depletion of dissolved oxygen, reduced transparency, and changes in species compositions and loss of biodiversity.[1-3]
U.S. EPA (2015) Preventing Eutrophication: Scientific Support for Dual Nutrient Criteria, 820-S-15-001, p. 1. [“Excess N and P in aquatic systems can stimulate production of plant (including algae and vascular plants) and microbial biomass, which leads to depletion of dissolved oxygen, reduced transparency, and changes in biotic community composition – this is called eutrophication.”]
USDA NALT Concept Space. “Eutrophication.” [“Process by which bodies of water become enriched in dissolved nutrients, e.g., phosphates, nitrates, nitrogenous compounds. The nutrients deplete the dissolved oxygen of the water by stimulating the growth of algae and other aquatic plant life.”]
U.S. National Oceanic and Atmospheric Administration (n.d.) What is eutrophication? [In marine environments, “Harmful algal blooms, dead zones, and fish kills are the results of a process called eutrophication—which begins with the increased load of nutrients to estuaries and coastal waters.”]
There is strong evidence that nutrient pollution leading to eutrophication is the largest water pollution problem worldwide.[1-3]
Smith, V. & Schindler, D. W. (2009). Eutrophication science: where do we go from here? Trends in Ecology & Evolution (Amsterdam), 24(4), 201–207, p. 201. [“Cultural eutrophication (excessive plant growth resulting from nutrient enrichment by human activity) is the primary problem facing most surface waters today.”]
Eutrophication: Causes, Consequences and Control Volume 2 (2014) Ansari & S. S. Gill, (Eds.) Springer Netherlands. [“On the hydrological map of the world eutrophication has become the primary water quality issue.” p. 1.1]
Kleinman, P.J.A., et al., (2020). “Managing Animal Manure to Minimize Phosphorus Losses from Land to Water” In Animal Manure (H.M. Waldrip, et al., eds.), p. 201. [“Eutrophication is the most pervasive concern to freshwater and estuarine water bodies worldwide, with phosphorus (P) pollution continuing to expand the extent of eutrophication, its impacts on aquatic life and its disruption of the benefits of ecosystems to humankind.”]
Yes. In a widely cited model, nine planetary boundaries have been identified, including proposed limits for nitrogen and phosphorus discharge. [1-4]
According to the latest update of the planetary boundaries framework, “six of the nine boundaries are transgressed, suggesting that Earth is now well outside of the safe operating space for humanity.”[5] Nutrient pollution boundaries are the most definitively transgressed due to excessive nitrogen and phosphorus discharges into the environment.[6]
Some scientists are pleading for a full reckoning of the damages, saying, “Many are aware of nitrogen as one of the most transgressed ‘planetary boundaries’. What is less widely understood is that nitrogen also affects the exceedance of all of the other planetary boundaries.”[7] Current usage of both nitrogen and phosphorus is estimated at about 2 to 3 times the proposed global limits.[8]
Global agriculture plays a dominant role in this transgression.[9,10] The U.S. is one of a handful of regions in which nitrogen and phosphorus overuse is concentrated.[11]
Rockström, J., et al., (2009). A safe operating space for humanity. Nature (London), 461(7263), 472–475. [Note: This is the first of 3 reports assessing the status of the planetary boundaries. The reports were published in 2009, 2015, and 2023, along with a 2024 overview. The other assessed boundaries are for climate, ozone, ocean acidification, biodiversity, land use, freshwater, novel entities, and aerosols.]
Steffen, W., et al., (2015). Planetary boundaries: Guiding human development on a changing planet. Science, 347(6223), 1259855.
Richardson, K., et al., (2023). Earth beyond six of nine planetary boundaries. Science advances, 9(37), eadh2458.
Rockström, J., et al., (2024). Planetary Boundaries guide humanity’s future on Earth. Nature Reviews Earth & Environment, 5(11), 773-788.
Richardson, K., et al., (2023), Abstract.
Richardson, K., et al., (2023), p. 4, figure 1. [Showing N and P deep into the “high risk zone.”]
Sutton, M. A., et al., (2021). The nitrogen decade: mobilizing global action on nitrogen to 2030 and beyond. One Earth, 4(1), 10-14, p. 10. [“By massively increasing the supply of nitrogen compounds, humans are worsening air and water quality, contributing to climate change and stratospheric ozone depletion, and thereby threatening health, biodiversity, and livelihoods.”]
Richardson, K., et al., (2023), p. 5, Table 1. [The P boundary set at 11 Tg with current use at 22.6 Tg. The N boundary at 62 Tg, with current use at 190 Tg. ]
Sutton, M. A., et al., (2021), Figure 1, p. 11.
Campbell, B., et al., (2017). Agriculture production as a major driver of the Earth system exceeding planetary boundaries. Ecology and Society, 22(4), 8, p. 4. [“We estimate agriculture’s role in the PB (transgression of planetary boundary) as being greater than 90%.”]
Steffen, W., et al., (2015), Figure 2, p. 3.
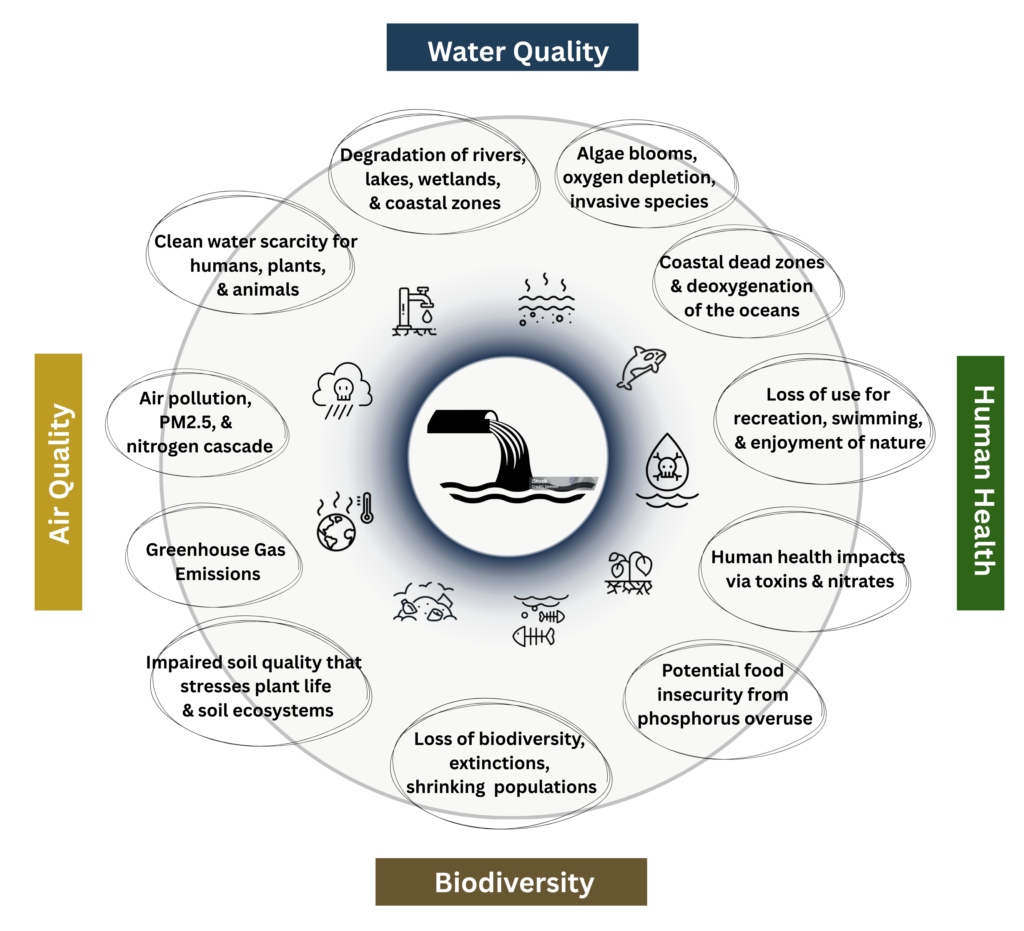
Nutrient pollution contributes to:[1]![]() The degradation of rivers, lakes, wetlands, and coastal zones.[2]
The degradation of rivers, lakes, wetlands, and coastal zones.[2]![]() Algae blooms, oxygen depletion, invasive species.[3]
Algae blooms, oxygen depletion, invasive species.[3]![]() Coastal dead zones and deoxygenation of the oceans.[4]
Coastal dead zones and deoxygenation of the oceans.[4]![]() Loss of use for recreation, swimming, and enjoyment of nature.[5]
Loss of use for recreation, swimming, and enjoyment of nature.[5]![]() Human health impacts via toxins and nitrates.[6]
Human health impacts via toxins and nitrates.[6]![]() Potential food insecurity from phosphorus overuse leading to global or regional shortages or price spikes.[7]
Potential food insecurity from phosphorus overuse leading to global or regional shortages or price spikes.[7]![]() Loss of biodiversity, extinctions, shrinking populations.[8]
Loss of biodiversity, extinctions, shrinking populations.[8]![]() Impaired soil quality that stresses plant life.[9]
Impaired soil quality that stresses plant life.[9]![]() Greenhouse gas emissions.[10]
Greenhouse gas emissions.[10]![]() Air pollution, PM2.5, and the nitrogen cascade.[11]
Air pollution, PM2.5, and the nitrogen cascade.[11]![]() Clean-water scarcity for humans, plants, and animals.[12]
Clean-water scarcity for humans, plants, and animals.[12]
For an extensive review of impacts, see: Sutton, M. A., et al., (2013). Our nutrient world. Centre for Ecology & Hydrology. [Experienced researchers present a good overview of the global environmental impacts of nutrient pollution, focused on 5 major impacts: water quality, air quality, greenhouse gas balances, ecosystems and biodiversity, and soil quality. See, pp. 32-51. Note: most of these subjects are covered at length in various pages on the site or in the following pages in this category. None of these points are controversial. We offer a single reference for each with the understanding that they are all important, complex, and interconnected.]
U.S. EPA (2024). National Water Quality Inventory: Report to Congress, Figure 1, p. 4.
Munn, M.D., et al., (2018). Understanding the influence of nutrients on stream ecosystems in agricultural landscapes: U.S. Geological Survey Circular 1437, 80, p. 17. [“A major problem associated with excessive nutrient concentrations in streams is eutrophication, which occurs when excessive nutrients stimulate the growth of aquatic vegetation. Excessive vegetation can result in the depletion in dissolved oxygen, which can have a detrimental influence on aquatic biota.”]
Diaz, R. J. & Rosenberg, R. (2008). Spreading Dead Zones and Consequences for Marine Ecosystems. Science (American Association for the Advancement of Science), 321(5891), 926–929, p. 928. [“In the northern Gulf of Mexico, the occurrence and extent of the dead zone are tightly coupled with freshwater discharge from the Mississippi River, which delivers large quantities of nutrients from U.S. agricultural activities.”]
Environmental Integrity Project (EIP) (2022) The Clean Water Act at 50: Promises Half Kept at the Half-Century Mark, Table 1, p. 4. [Based on state water quality assessments, “about half of the river and stream miles and lake acres that have been studied across the U.S. are so polluted they are classified as “impaired.” That means they are too polluted to meet standards for swimming and recreation, aquatic life, fish consumption, or as drinking water sources.”]
Ward, M. H., et al., (2018). Drinking water nitrate and human health: an updated review. International journal of environmental research and public health, 15(7), 1557, p. 20. [“Populations with the highest exposure to nitrate from their drinking water are those living in agricultural regions, especially those drinking water from shallow wells near nitrogen sources (e.g., crop fields, animal feeding operations).”]
W. J. Brownlie, et al., (eds.) (2022) Our Phosphorus Future. Towards global phosphorus sustainability. UK Centre for Ecology & Hydrology, Edinburgh, p. 24. [“Five countries hold around 85% of known phosphate rock reserves, with 70% found in Morocco and Western Sahara alone. Most countries do not have any phosphate rock reserves and are reliant on imports to supply their phosphorus demands to maintain food security. China, Morocco and Western Sahara, the USA and Russia currently produce around 80% of the planet’s phosphate rock supply.” at p. 22]
U.S. EPA (2023). National Rivers and Streams Assessment: The Third Collaborative Survey, 841-R-22-004. [“Poor biological condition was more likely when rivers and streams were in poor condition for nutrients.”]
Davidson, E. A., et al., (2012). Excess nitrogen in the US environment: trends, risks, and solutions. Issues in ecology, (15), p. 4. [“Both nitrogen and sulfur from air pollution contribute to the acidification of soils, which leads to the loss of essential plant nutrients, such as calcium and magnesium, and alters the availability of phosphorus. Soil acidification mobilizes elements like aluminum, which is toxic to many plants on land and to many fish and other fauna in streams and lakes. Acidification of soils can increase forest susceptibility to disease and drought by stressing plants.”]
U.S. EPA (2024) Inventory of U.S. Greenhouse Gas Emissions and Sinks: 1990-2022, EPA 430-D-24-004, Figure 5-4, p. 5-29. [“Sources and Pathways of Nitrogen that Result in N2O Emissions from Agricultural Soil Management”]
Wyer, K. E., et al., (2022). Ammonia emissions from agriculture and their contribution to fine particulate matter: A review of implications for human health. Journal of Environmental Management, 323, 116285–116285, p. 7. [“There is currently a chain that exists between NH3 emissions, the formation of PM2.5, and the subsequent impacts that this PM2.5 has on human health.”]
Wang, M., et al., (2024). A triple increase in global river basins with water scarcity due to future pollution. Nature Communications, 15(1), 880–880, p. 2. [“We find that current and future water scarcity becomes a substantially more severe issue globally when implementing our clean-water scarcity assessment… Due to their high nitrogen pollution levels, many sub-basins in South China, Central Europe, North America, and Africa become water scarcity hotspots.”]
Yes. Nutrient pollution is the primary driver of water pollution in U.S. waterways.
Nutrient pollution is acknowledged by the EPA as “the most widespread stressor” in the nation’s lakes, rivers and streams, and coastal areas.[1-3]
Even more critically, excess nutrients (nitrogen or phosphorus or both) have the highest “attributable risk” for lakes, rivers and streams.[4-6] Attributable risk is the metric assigned by the EPA to measure the improvements to waterways that could be gained from reducing specific pollutants.[7] Attributable risk is based on the improvement of biological condition, the key indicator of waterways health throughout the EPA’s assessments of water quality.[8]
For coastal areas, the EPA report does not assign attributable risk, however, nutrient pollution is clearly the critical factor, with eutrophication “the most significant problem in coastal waters.”[9] For wetlands, nutrients are the primary pollutant, although physical alterations (wetlands filling, flow obstruction, vegetation removal) are larger threats to overall conditions.[10]
The EPA occasionally acknowledges nutrient pollution as the primary driver of water pollution, stating a decade ago, “The finding that nutrient pollution is the leading cause of use impairment in U.S. waters is supported by data from states’ water quality assessment reports, National Aquatic Resources Surveys, and associated reports to Congress…”[11] It has specifically acknowledged high nutrient levels as “the leading problem” for the nation’s lakes.[12,13]
U.S. EPA (2024) National Lakes Assessment. [For lakes, “Nutrient pollution was the most widespread stressor measured.”]
U.S. EPA (2023) National Rivers and Streams Assessment: The Third Collaborative Survey, 841-R-22-004. [For rivers and streams, “Nutrients (phosphorus and nitrogen) were the most widespread stressors.”]
U.S. EPA (2021) National Coastal Condition Assessment: A Collaborative Survey of the Nation’s Estuaries and Great Lakes Nearshore Waters, 841-R-21-001, p. 53. [For coastal areas, including estuaries and Great Lakes near-shore areas, “Similar to findings from other assessments, the NCCA found that elevated nutrient levels are widespread stressors.”]
U.S. EPA (2024). National water quality inventory: report to Congress. [“Attributable risk analysis for rivers and streams shows that reducing nutrients could result in the greatest benefit to biological condition at the national scale.” at p. 24. For lakes “Calculating attributable risk, EPA found that reducing phosphorus and nitrogen could result in the greatest benefit to benthic macroinvertebrate condition nationally.” at p. 24. “Biological condition for coastal waters, lakes, rivers, and streams is based on benthic macroinvertebrates.” at p. 21. “Biological condition is the most comprehensive indicator of water body health: when the biology of a stream is healthy, the chemical and physical components of the stream are also typically in good condition.” at p. 10. Note: in most reports, the EPA unfortunately requires an in-depth reading and a complicated multi-step analysis to discover that excess nutrients are the primary driver of polluted waterways.]
U.S. EPA (2023) National Rivers and Streams Assessment: The Third Collaborative Survey. [For rivers and streams, “Attributable risk analysis shows that reducing nutrients could result in the greatest benefit to biological condition at the national scale…” And again, “Biological condition is the most comprehensive indicator of water body health…” From, EPA National water quality inventory: report to Congress, p. 10]
U.S. EPA (2024) National Lakes Assessment. [For lakes, “EPA found that reducing phosphorus could result in the greatest benefit to benthic macroinvertebrate condition nationally…” And again, “Biological condition for coastal waters, lakes, rivers, and streams is based on benthic macroinvertebrates.” at p. 21]
EPA (2024). National water quality inventory: report to Congress, pp. 23-24. [Attributable risk is “a single value that provides an estimate of the potential improvement that could be achieved by reducing or eliminating the stressor.”] For more info about attributable risk, see: EPA, Relative Extent, Relative Risk and Attributable Risk https://www.epa.gov/national-aquatic-resource-surveys/relative-extent-relative-risk-and-attributable-risk]
See, for example, a) EPA National Water Quality Inventory: Report to Congress, pp. 23-24, wherein “attributable risk” is based on biological condition, and b) the “Summary of National Water Quality” at p. 4 and Figure 1, and c) “Biological condition is the most comprehensive indicator of water body health: when the biology of a stream is healthy, the chemical and physical components of the stream are also typically in good condition.” (at p. 10) and d) the prior NWQA: EPA National Water Quality Inventory: Report to Congress (2017) 841-R-16-011, focused on the biological condition of each category of waterway in the “Executive Summary” at p. 2]
U.S. EPA (2021) National Coastal Condition Assessment: A Collaborative Survey of the Nation’s Estuaries and Great Lakes Nearshore Waters, 841-R-21-001. [“Eutrophication continues to be the most significant problem in coastal waters…” at p. 7. Further notes that just 33% of estuarine waters are in good condition for eutrophication, including 18% of gulf waters. at p. 25, Figure 3.2.1]
U.S. EPA (2024) National Wetland Condition Assessment: The third collaborative survey of wetlands in the United States, 843-R-24-001. [“In addition to looking at the six physical alterations separately, analysts also examined the combined impact by adding up the numeric scores across all indicators. This enabled the EPA to determine the extent to which wetlands were subject to multiple types of alterations and to estimate the combined effect on wetland conditions.” However, referring to an earlier (no longer available) wetlands assessment, the EPA noted that “Calculating attributable risk at the national scale EPA found that reducing total phosphorus in wetland waters could result in the greatest benefit to biological condition.” See, EPA (2024) National water quality inventory: report to Congress at p. 24. This was apparently before 6 types of physical alterations were combined into a single “attributable risk.” Naturally the greatest threat to wetlands is their alteration or obliteration to make way for alternate land uses. Note that with regard to nitrogen and phosphorus conditions, “because many wetlands did not have surface water, 40% of wetland area could not be assessed for water chemistry.“]
U.S. EPA (2015) A Compilation of Cost Data Associated with the Impacts and Control of Nutrient Control of Nutrient Pollution, 820-F-15-096, see, Introduction, p. I.1.
U.S. EPA (2024). National water quality inventory: report to Congress, p. 10.
Note: We assume that the agency’s reticence to clearly state the obvious and primary role of nutrient pollution stems mostly from agricultural exceptionalism along with a hesitation to draw attention to several decades of failed policies that have allowed high levels of damaging agricultural pollutants to continue unabated.
The EPA is the key agency tasked with monitoring the health of U.S. waterways and enforcing regulations to maintain water quality. Nutrient pollution is a central factor in these assessments and in their regulatory efforts. Other agencies play a smaller role.
EPA Assessment – The EPA monitors the status and trends of the nation’s waterways, choosing metrics or “indicators” that reflect the physical, chemical, and biological conditions along with characteristics that pose risks to human health.[1] The agency generates reports approximately every 5 years assessing each of 4 categories of waterways: Rivers & Streams, Lakes, Wetlands, and Coastal Zones including near-shore areas of the Great Lakes. Together the reports are known as the National Aquatic Resource Surveys (NARS). “The purpose of these surveys is to generate statistically-valid reports on the condition of our nation’s water resources and identify key stressors to these systems.”[2]
EPA Regulation – The EPA is tasked, via the Clean Water Act, with regulating discharges of pollutants into waters of the United States and regulating quality standards for surface waters.[3] Despite the original mandate for the “control of both point and nonpoint sources of pollution,” in practice, the EPA has had limited ability and very little effectiveness in reducing nutrient pollution from crops and factory farms.[4]
USGS – The USGS (U.S. Geological Surveys) is “the Federal source for science about the Earth, its natural and living resources, natural hazards, and the environment.”[5] The USGS is an independent fact-finding agency with no regulatory or management authority.[6] Through the National Water Quality Assessment Program (NAWQA) the agency generates many reports evaluating specific locations and indicators of water quality, with several key reports addressing regional nutrient pollution.[7]
USDA – The USDA offers programs and guidelines through its Natural Resources Conservation Service (NRCS) to encourage farming conservation strategies to “conserve water and keep valuable nutrients on the field and out of local waterways.” Participation in NRCS programs is voluntary.[8] Despite decades of spending, research, and incentives to farmers, the USDA has had limited impact on agriculture’s overall contributions to nutrient pollution.[9]
U.S. EPA (2024). National water quality inventory: report to Congress. [This report to Congress aggregates the results of the 4 separate water category reports. See p. 4 for an overview and a listing of those 4 reports] For more info on those reports, see, Lakes, Rivers, & Streams Pollution
U.S. EPA. National Lakes Assessment 2022. Field Operations Manual. Version 1.2, 841-B-16-011, p. 1.
Clean Water Act 33 U.S. Code § 1251, Congressional declaration of goals and policy. [“It is the national policy that programs for the control of nonpoint sources of pollution be developed and implemented in an expeditious manner so as to enable the goals of this chapter to be met through the control of both point and nonpoint sources of pollution.”]
See, Clean Water Act Animal Ag Regulations and NPDES for CAFOs
Robertson, D.M. and Saad, D.A. (2019) Spatially referenced models of streamflow and nitrogen, phosphorus, and suspended-sediment loads in streams of the Midwestern United States, U.S. Geological Survey Scientific Investigations Report 2019–5114, 74 p. ii. [This identifying “tagline” is used in many other USGS publications.]
U.S. Geological Survey. Information Policies and Instructions. https://www.usgs.gov/information-policies-and-instructions
U.S. Geological Survey. National Water Quality Program. [“The National Water Quality Program provides an understanding of water-quality conditions; whether conditions are getting better or worse over time; and how natural features and human activities affect those conditions.”]
USDA, Natural Resources Conservation Service, Supporting America’s Working Lands (n.d.)
Ribaudo, M. & Shortle, J. (2019). Reflections on 40 years of applied economics research on agriculture and water quality. Agricultural and Resource Economics Review, 48(3), 519-530, p. 522. [This presentation was co-written by a USDA researcher who spent 35 years at the agency trying to address nutrient pollution from agriculture. “The voluntary approach has generally not led to sufficient aggregation of conservation efforts in impaired watersheds to produce needed improvements in water quality.”]
No. This is made clear by the failing grades of waterways as assessed by the EPA in its latest round of evaluations. ![]() Less than half of U.S. freshwater bodies are in good biological condition.[1]
Less than half of U.S. freshwater bodies are in good biological condition.[1]![]() Almost three-fourths of U.S. lakes are eutrophic.[2]
Almost three-fourths of U.S. lakes are eutrophic.[2]![]() Less than one-third of rivers and streams have healthy biological communities.[3]
Less than one-third of rivers and streams have healthy biological communities.[3] ![]() The 5-year average size of the Gulf of Mexico dead zone is ~4,800 square miles.[4]
The 5-year average size of the Gulf of Mexico dead zone is ~4,800 square miles.[4]
Nutrient pollution from animal ag is the leading cause of these widely degraded conditions.[5]
U.S. EPA (2024). National Water Quality Inventory: Report to Congress, 841-R-23-001, p. 4.
See, Lakes, Rivers & Streams Pollution [question: What are the eutrophication levels of lakes?]
U.S. EPA (2023) National Rivers and Streams Assessment 2018 – 2019 Key Findings. [“Less than one-third of our river and stream miles (28%) had healthy biological communities…”]
NOAA (August 2025) This year’s Gulf of Mexico ‘dead zone’ is 21% smaller than estimates from early June by NOAA Headquarters. [This is more than twice the size of the 5-yr average goal agreed to in 2001 (1,930 sq. miles), set with a target date of 2015.]
See, Animal Ag’s Contributions to Water Pollution