About 75% of U.S. soybean production by weight goes to animal feed. Using the relative value of coproducts, ~58% of soybean usage went to animal feed. These are two-year averages covering 2023 and 2024.
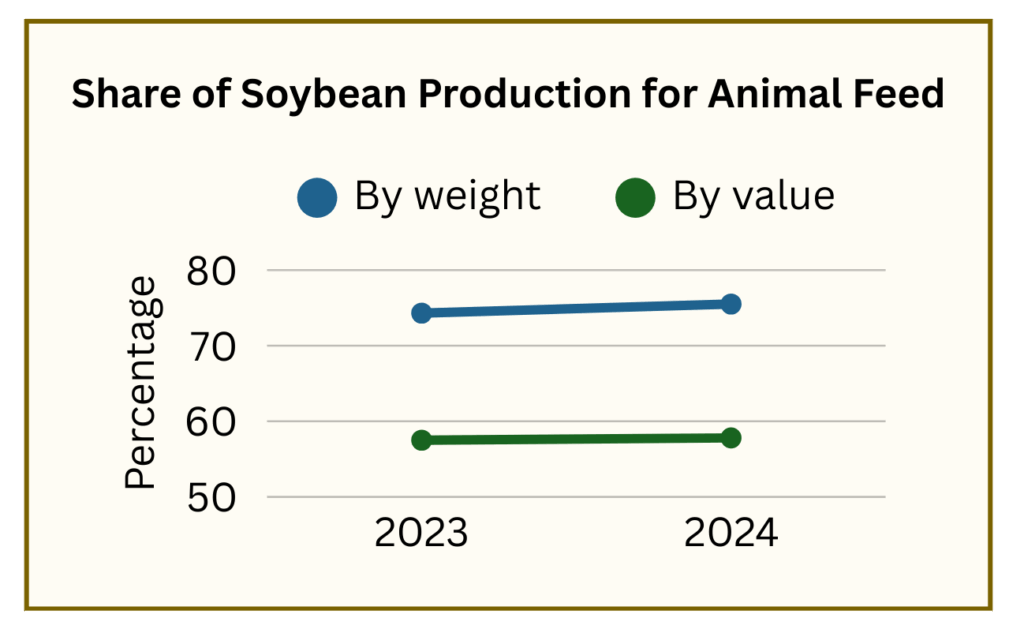
Our tallies (used throughout the site) of total share of crops going to animal feed use the figure of ~58% for soybeans, based on the relative value of coproducts. (See the following questions for references and calculations.)
Most soybeans undergo a process called “crush” which generates the two major coproducts of soybeans – meal and oil. The weight proportions of crush are generally stable at about 80% meal and 20% oil.[1,2] The value proportions fluctuate depending on market factors.[3]
Although credible evaluations for soy usage use weight,[4] there is a strong case to be made that value is the key driver of decisions on acreage planted for any crop.
For soybean estimates, the first calculations and charts below show distribution channels based on weight. The final calculation on this page makes one simple adjustment to re-calculate based on value.[5] Throughout these feed crop pages we prioritize value of coproducts rather than weight when the relative values are available.
U.S. Energy Information Administration (2019) Soybean oil comprises a larger share of domestic biodiesel production. https://www.eia.gov/todayinenergy/detail.php?id=39372# [The soybean crush yields about 80% soybean meal and 20% soybean oil.]
CME Group (2015) CBOT Soybeans vs. DCE Soybean Meal and Soybean Oil – Crush Spread, p. 2. [1 unit of soybeans produces 80% meal, 18.3% oil and 1.7% waste.]
USDA Economic Research Service, Oil Crops Yearbook, Soy and Soybean Products, table 3 (updated 3/20/25) Soybeans U.S. supply, disappearance and price.
Fraanje, W. & Garnett, T. (2020). Soy: food, feed, and land use change (Foodsource: Building Blocks). Food Climate Research Network, University of Oxford.
The charts going by weight of coproducts use an 80:20 meal-to-oil ratio. The final chart based on value recalculates using a 60:40 meal-to-oil ratio.
In 2024, about 33% of total soybean usage went to domestic animal feed, based on the weight of coproducts.
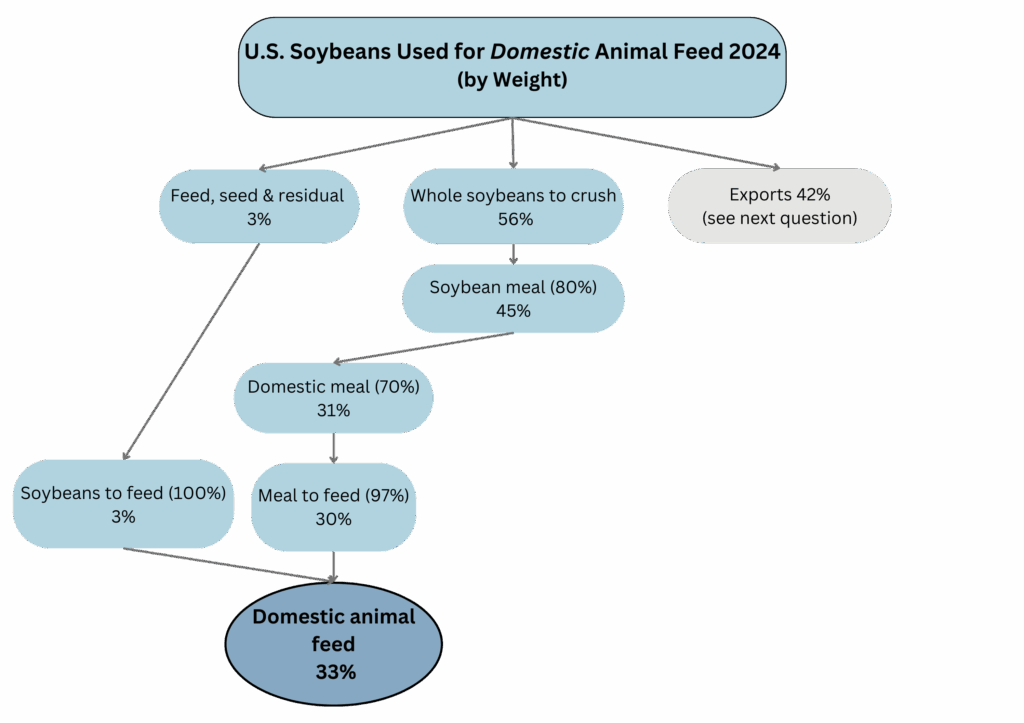
Note: The chart does not track non-feed usages, such as the amount of domestic crush that goes to oil for human consumption or industrial use.
Disappearance – In 2024, calculations begin with the USDA soybean production figure for “total disappearance.”[1]
Crush – About 56% of soybeans were processed to make “crush” which refers to the physical process of converting soybeans into soybean meal and soybean oil.[2]
Meal – Of the crush, typically 80% by weight is soybean meal, about 18% is oil, and 1%-2% is waste.[3-5]
Domestic Meal – About 70% of soybean meal went to domestic use.[6]
Meal to Animal Feed – In the U.S. about 97% of soybean meal goes to feed livestock and poultry.[7-9]
Whole Soybeans to Feed – In addition, about 3% of whole soybeans goes directly to feed.[10]
The animal feed usage is calculated as a percent of “disappearance” rather than “production.” Disappearance refers to the usage in a single year. It can be different from production because of imports and changes in beginning and ending stocks. Disappearance is therefore a good reflection of usage. The calculations do not consider imports; since we are not calculating final weights, but rather percentages of usage, we assume that imports have similar usage patterns to domestic production. Soybean imports are negligible, less than 1% of total supply.
USDA Economic Research Service, Oil Crops Yearbook, Soy and Soybean Products, table 3 (updated 3/20/25) Soybeans U.S. supply, disappearance and price. [Soybeans processed for crush = 2,410 million bushels / Total disappearance of soybeans = 4,329 million bushels == 55.7%]
U.S. Energy Information Administration (2019) Soybean oil comprises a larger share of domestic biodiesel production. https://www.eia.gov/todayinenergy/detail.php?id=39372# [The soybean crush yields about 80% soybean meal and 20% soybean oil.]
CME Group (2015) CBOT Soybeans vs. DCE Soybean Meal and Soybean Oil – Crush Spread, p. 2. [1 unit of soybeans produces 80% meal, 18.3% oil and 1.7% waste.]
U.S. Soybean Export Council (2015) Conversion Table. https://ussec.org/resources/conversion-table/ [79.2% to soybean meal, 17.8% soybean oil, 3.0% waste]
Oil Crops Yearbook, Soy and Soybean Products, table 4, Soybean meal: U.S. supply, disappearance and price [Soybean meal to domestic use = 40 million tons / Total disappearance of soybean meal = 57.6 million tons = 69.8%]
American Soybean Association, Animal Agricultural. https://soygrowers.com/key-issues-initiatives/key-issues/other/animal-ag/# [97% of U.S. soybean meal used for livestock and poultry.]
United Soybean Board (October 2023) Soybean Meal: A Dependable Feed Ingredient. https://www.unitedsoybean.org/hopper/us-soybean-meal-a-dependable-feed-ingredient/ [“The global animal agriculture industry consumes 97 percent of all U.S. soybean meal…”]
United Soybean Board, Market View Database, U.S. Soybean Flow Infographic (MY 2023/2024). [Disappearance shows companion animals and aquaculture using ~3% of domestic soybean meal, with livestock & poultry using ~97%.]
This figure is derived from the USDA category of “feed, seed, and residual” use which was 2.63% of total soybean disappearance in 2024 [Oil Crops Yearbook, Soy and Soybean Products, Table 3. We assume that seed use is incidental, since 96% of soybean crops are genetically engineered and seeds cannot be replanted [USDA Economic Research Service, Adoption of Genetically Engineered Crops in the U.S. (updated 1/4/25)] and we follow USDA’s general assumption that “feed and residual” is viewed as “implied feed use.” [Tom Capehart (2013) Feed Outlook: Special Article, USDA Economic Research Service, FDS-13e-SA.]
About 42% of total soybean disappearance went to animal feed via exports, based on the weight of coproducts. There were 3 routes: a) whole soybeans exported and then crushed into soybean meal in other countries, b) whole soybeans exported and then fed directly to animals, and c) domestically processed soybean meal exported from the U.S. and fed to animals.
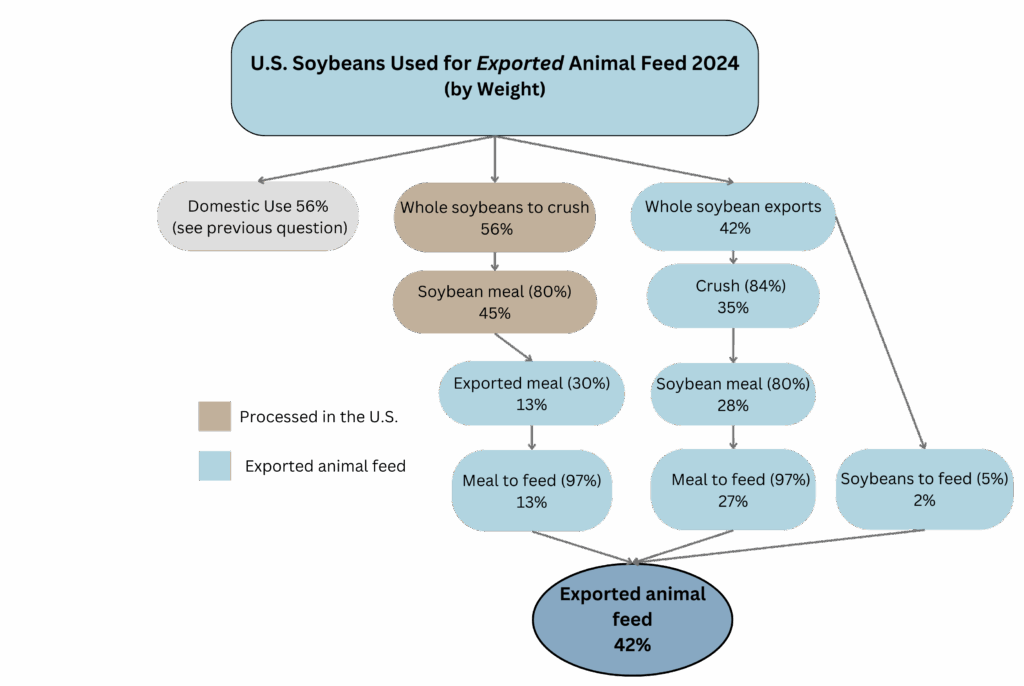
Exported whole soybeans used for crush – In 2024, the U.S. exported ~42% percent of its soybeans as whole soybeans.[1] Collectively, the top 10 markets crushed ~84% of their imported soybeans.[2,3] Using the 80:18:2 weight ratio of soybean meal to oil to waste and the accepted percentage of soybean meal fed to livestock and poultry (97%), then ~27% of total disappearance went to animal feed via this route.[4,5]
Exported whole soybeans used for feed – Of the 42% of exported soybeans, ~5% was used directly for animal feed in the top 10 export markets, accounting for ~2% of total disappearance.[6]
Exported soybean meal – In addition to whole soybeans, the U.S. exported ~30% of the soybean meal that was domestically crushed.[7] Thus, another 13% of total disappearance was attributed to exported soybean meal used for animal feed.
In sum, a total of ~42% of total soybean disappearance goes to exported soybeans and exported soybean meal used for animal feed. This includes 27% of whole soybeans crushed to make animal feed, 13% for exported soybean meal, and 2% for exported whole soybeans used for feed.
USDA Economic Research Service, Oil Crops Yearbook, Soy and Soybean Products, table 3 (updated 3/20/25), Soybeans U.S. supply, disappearance and price.[Soybeans exported = 1,825 million bushels / Total soybean disappearance = 4,329 million bushels = 42.16%]
USDA Foreign Agricultural Trade of the United States, Top 10 U.S. agricultural export markets for wheat, corn, soybeans, and cotton, by volume, Feb. update of Dec. 2024 data (Jan – Dec 2024) [The top 10 U.S. export markets imported ~48 million metric tons of soybeans out of a total of ~52 million metric tons exported by the U.S, or 92%. For our analysis, we assume that the remaining 8% of export markets used U.S. soybeans in similar ways.]
USDA Foreign Agricultural Service, Production, Supply and Distribution (PS&D) database, reporting period August 2025 for year 2024. [Analysis: a) Graphical queries for 9 of top 10 markets (calculating “crush” as a percentage of “total domestic consumption” of whole soybeans. b) Weighting the percentage of crush by country.] [Indonesia percentage of crush from OECD Agricultural Outlook 2024-2033, Table C.18.2]
The USDA’s Foreign Agricultural Service PS&D database uses the term “Feed Waste Domestic Consumption” when referring to animal feed. See, PS&D online, About PSD Online, FAQ’s, Define oilseeds attributes and the marketing year used for oilseeds and products. [Definition: “This is volume used for animal feeding. This includes soybeans crushed for feed use (i.e., full-fat soybeans). Waste includes beans lost along the way.”]
United Soybean Board (October 2023) Soybean Meal: A Dependable Feed Ingredient. [“The global animal agriculture industry consumes 97 percent of all U.S. soybean meal…”]
USDA Foreign Agricultural Service, Production, Supply and Distribution (PS&D) database, reporting period August 2025 for year 2024. [Analysis: a) Graphical queries for top 10 markets, calculating “feed waste domestic consumption” as a percentage of “total domestic consumption” for whole soybeans. b) Weighting the percentage of soybeans by country to “feed waste domestic consumption.”]
Oil Crops Yearbook, Soy and Soybean Products (3/20/25), table 4, Soybean meal U.S. supply, disappearance and price. [Exported soybean meal = 17.4 million tons / Soybean meal total disappearance = 57.6 million tons == 30.2%. Therefore .56 (to crush) * .80 (to meal) * .30 (exported meal) * .97 (use for animal feed) = ~13%.]
About 75% of U.S. soybeans goes to animal feed (using weight of coproducts).

This U.S. figure of 75% is generally in line with estimates of global usage.[1] It is also similar to the USDA’s “just over 70%” estimate which, to our knowledge, has not been updated since 2015.[2]
Fraanje, W. & Garnett, T. (2020). Soy: food, feed, and land use change (Foodsource: Building Blocks). Food Climate Research Network, University of Oxford. Page 4 and Figure 3 [“While soy is often seen as a valuable source of protein in plant-based diets, most soy (around 75% measured by weight) is currently fed to animals in livestock production systems.”]
USDA (2015) Coexistence Fact Sheets Soybeans, Office of Communications. https://www.usda.gov/sites/default/files/documents/coexistence-soybeans-factsheet.pdf [This highly cited factsheet on a tangential subject does not provide any reference for this data point.]
Using the relative value of oil and crush, rather than the weight, the total share of soybeans going to animal feed is estimated at ~58% for 2024. The two-year average for 2023 and 2024 is also ~58%.

Though most evaluations of soy usage refer to relative weight,[2-4] there is a strong argument that value drives the market forces that spur decisions on the amounts of crop acreage planted for any crop. Throughout these pages we prioritize value of coproducts rather than weight when the relative values are available.
Value is of course subject to fluctuations and may vary between the U.S. and other countries. Meal value in the U.S. (as a share of both meal plus oil value) shows a 5-year variance ranging from a low of ~53% to a high of ~67%, a 5-year average at ~59% and a 10 yr average at ~62%. In 2024, the meal value was ~60% of total value.[5,6]
Based on current information, we use a 60:40 meal-to-oil value ratio as a reasonable estimate for both U.S. and export markets.[7-9] This leads to a final estimate of ~58% of U.S. soybeans going to animal feed in 2024. We use this figure as part of our tallies of total crop share used for animal feed.[10]
The final chart is identical to the previous charts except that the “soybean meal” blocks shift from an 80% “conversion to meal” factor to a 60% “conversion to meal” factor to reflect value instead of weight. Because there is data available for export markets on usage by weight and because the weight ratios of meal and oil are relatively stable, usage estimates by weight can be calculated with a higher degree of certainty. Still, we propose that value is the more important gauge.
Fraanje, W. & Garnett, T. (2020). Soy: food, feed, and land use change (Foodsource: Building Blocks). Food Climate Research Network, University of Oxford. [“While soy is often seen as a valuable source of protein in plant-based diets, most soy (around 75% measured by weight) is currently fed to animals in livestock production systems.”]
CME Group (2015) CBOT Soybeans vs. DCE Soybean Meal and Soybean Oil – Crush Spread, p. 2. [1 unit of soybeans produces 80% meal, 18.3% oil and 1.7% waste.]
U.S. Soybean Export Council (2015) Conversion Table. [79.2% to soybean meal, 17.8% soybean oil, 3.0% waste]
USDA Economic Research Service, Oil Crops Yearbook, Soy and Soybean Products, table 9, (updated 3/20/25), Soybeans U.S. supply, disappearance and price.
Note: We have limited data on the meal-to-oil value ratios in top export markets, which use more than half of U.S. soybean production. Most soybean exports are whole soybeans that are then crushed in foreign markets for oil and meal. Prices for commodity-type products like soybean oil or meal tend to stay more-or-less in line. The following 3 sources (footnotes 7-9) show soybean meal in Chinese markets (by far the largest U.S. export market) at about 60% of the total value of oil and meal.
Platts Global Soybean Price Assessment – Platts Asian Soybean Daily Commentary – [As of May 2025, meal priced at 2,902 yuan per metric ton, and oil at 8,022 per ton. 2,902 * 4 = 11,608 yuan. 8,022 + 11,608 = 19,630. 11,608 / 19,630 = 59.1%.]
Mei Mei Chu (January 30, 2024) China’s soyoil, meal futures tumble to over six-month low on slowing demand, Reuters. https://www.reuters.com/markets/commodities/chinas-soyoil-meal-futures-tumble-over-six-month-low-slowing-demand-2024-01-30/ [Soy oil at 7,204 yuan ($1,003.79) per metric ton. Soymeal at 2,944 yuan ($410.21) per ton. $410 x 4 = $1,640 / ($1640 + $1004) = 62%]
Yun Qiang Tan (August 2023) China soybean crush margin turns positive after 2 months, headwind remains, S&P Global Commodity Insights. [Meal at 4,075/mt ($559/mt) Aug. 25, 2023; Oil at 8,486/mt ($1,164/mt) – $559 x 4 = 2236.2236 + 1164 = 3400. 2236/3400 = 66%.]
See, Total Feed Crops Share