1. Nitrates in drinking water are a significant, though poorly understood health threat; the risks include blue baby syndrome, birth defects, low birth weights, and several types of cancers.
2. Most studies suggest that the EPA’s current maximum contaminant level (MCL) underestimates the threat.
3. Nitrates often contaminate groundwater; the largest health impacts are on rural families with private wells that do not test their drinking water.
4. The primary source of nitrates is factory farming; nitrates are a form of nutrient pollution from concentrated manure and excess chemical fertilizers.
5. The poor health outcomes for families (especially infants) and expensive water treatments are negative externalities transferred from the producers and consumers of factory-farmed meat and dairy to rural residents with private wells and to small community water suppliers.
6. Efforts by the EPA to reassess the threat were started in 2017, derailed in 2019, restarted in 2023, and are uncertain as of 2026.
Nitrates (NO3) are a form of nitrogen coming mostly from manure and chemical fertilizers that leach into fresh waterways and groundwater.[1,2]
In waterways, nitrates are a component of nutrient pollution that leads to eutrophication.[3] In groundwater used for drinking water, excessive nitrates are a serious health concern.[4]
Most of the nitrogen in waterways and groundwater is in the form of nitrates.[5,6]
Singh, B. and Craswell, E. (2021). Fertilizers and nitrate pollution of surface and ground water: an increasingly pervasive global problem. SN Applied Sciences, 3(4), 518, p. 1. [“Nitrogen (N) in the form of nitrate is a common pollutant in both surface and ground waters. Nitrate-N can readily leach down beyond the root zone in agricultural soils and reach the ground and surface waters. At levels exceeding the permissible limits, nitrate-N makes the ground water unfit for drinking purposes.”]
Ransom, K. M., et al., (2022). Machine learning predictions of nitrate in groundwater used for drinking supply in the conterminous United States. The Science of the Total Environment, 807(Pt 3), Article 151065, Abstract. [USGS researchers. “In areas of predicted high nitrate concentration, applied manure, farm fertilizer, and agricultural land use were influential predictor variables.”]
See, Nutrient Pollution of Waterways
Ward, M., et al., (2018). Drinking Water Nitrate and Human Health: An Updated Review. International Journal of Environmental Research and Public Health, 15(7), 1557, p. 20. [“Considering all studies to date, the strongest evidence for a relationship between drinking water nitrate ingestion and adverse health outcomes (besides methemoglobinemia) is for colorectal cancer, thyroid disease, and neural tube defects.”]
DeSimone, L. A., et al., (2014). The quality of our Nation’s waters: Water quality in principal aquifers of the United States, 1991-2010, USGS, Circular 1360, p. 82. [“Most of the nitrogen in groundwater is in the form of nitrate.”]
U.S. EPA (September 2017). IRIS Assessment Plan for Nitrate and Nitrite [CASRNs 14797-55-8 and 14797-65-0], EPA/635/R-17/331, p. 2. [“Nitrates account for most of the available total nitrogen in both ground and surface waters.”]
No. But nitrates are likely the primary water quality problem in groundwater.[1,2] About 40% of Americans source their drinking water from groundwater.[3,4]
Nitrates are the primary water quality problem for people in agricultural areas who source their water from groundwater from private wells.[5,6] About 13% of Americans (more than 40 million people) source their water from private wells.[7]
Hrozencik, A., et al., (2023). Irrigation organizations: groundwater management. USDA, Economic Brief Number 34 .[“Nitrates are the most commonly cited groundwater contaminant…”]
Sutton, M. A., et al., (2013). Our nutrient world: the challenge to produce more food and energy with less pollution. NERC/Centre for Ecology & Hydrology, p. 34. [“In groundwater, the key problem is accumulation of nitrate.”]
Groundwater Use in the United States of America (2020). National Groundwater Association [“41% of America’s population regularly depends upon groundwater for its drinking water supply.” Includes ~90 million Americans sourcing from community water systems, and ~41 million from private wells. See following footnote re private wells. ]
Dieter, C.A. et al., (2018). Estimated Use of Water in the United States in 2015, U.S. Geological Survey, p. 22 and Table 6, p. 23. [“An estimated 42.5 million people in the United States, or 13 percent of the population, provided their own water for domestic use in 2015.” 98 percent were from groundwater.]
DeSimone, L. A., et al., (2014). The quality of our Nation’s waters: Water quality in principal aquifers of the United States, 1991-2010, USGS, Circular 1360, p. 2. [“Nitrate was the only constituent from manmade sources that exceeded its human-health benchmark in more than 1 percent of wells.” at p. 2. “22 percent of wells in agricultural settings had concentrations greater than the MCL, and nearly two-thirds had concentrations greater than 1 mg/L as N.” at p. 83]
Ward, M., et al., (2018). Drinking Water Nitrate and Human Health: An Updated Review. International Journal of Environmental Research and Public Health, 15(7), 1557, p. 20. [“Populations with the highest exposure to nitrate from their drinking water are those living in agricultural regions, especially those drinking water from shallow wells near nitrogen sources (e.g., crop fields, animal feeding operations).”]
Dieter, C.A. et al. (2018), p. 22 and Table 6, p. 23. [“An estimated 42.5 million people in the United States, or 13 percent of the population, provided their own water for domestic use in 2015.” 98 percent were from groundwater.]
Yes, without question. It is widely understood that agriculture is the primary source of nutrient pollution, i.e., excess nitrogen and phosphorus in waterways and groundwater.[1] Regarding nitrogen specifically, agriculture is the source of about two-thirds of nitrogen pollution.[2] Of this about two-thirds comes from animal ag.[3]
Animal ag is therefore responsible for about 45% of all nitrogen pollution, making it the primary source.[4]
Many reports confirm that nitrates specifically in groundwater are a direct result of nitrogen pollution from agriculture.[5-8] In one study, USGS researchers concluded that the primary source was applied manure.[9]
Brehob, M. M., et al., (2025). The US EPA’s National Nutrient Inventory: Critical Shifts in US Nutrient Pollution Sources from 1987 to 2017. Environmental Science & Technology, p. A. [“As an example, agriculture is generally the largest contributor to nutrient pollution in the United States.”]
Sabo, R. D., et al., (2021). Considerations when using nutrient inventories to prioritize water quality improvement efforts across the US. Environmental research communications, 3(4), 045005, pp. 5-7. [“Respectively, about 67% and 80% of the anthropogenic N and P surplus is attributable to the N and P left in fields and pastures across the country…”]
For further details and calculations on this point, see, Animal Ag Contributions to Water Pollution
Calculation: .67 * .67 (agriculture’s share of N pollution * animal ag’s share of agricultural N pollution) = ~45%.
Galloway, J. N., et al., (2003). The nitrogen cascade. Bioscience, 53(4), 341-356. [“The primary anthropogenic Nr source for groundwater on a global basis is leaching from agroecosystems… Nitrate is the most common Nr species.”]
Schaider, L. A., et al., (2019). Environmental justice and drinking water quality: are there socioeconomic disparities in nitrate levels in U.S. drinking water? Environmental Health, 18(1), Article 3, p. 2. [Study from 2010-2014] [“Extent of agricultural land use and reliance on groundwater sources were significantly associated with nitrate.”]
McDonald, C. P., et al., (2015). Characterizing the sources of elevated groundwater nitrate in Dane County, Wisconsin. Final Report to WDNR for Wisconsin Groundwater Joint Solicitation Program, 218, p. 2. [“In Wisconsin, 90% of the groundwater nitrate contamination is estimated to have originated from agriculture, 9% from septic systems, and 1% from other sources.”]
Water Quality Association (2014). Nitrate / Nitrite Fact Sheet, p. 2. [“The principle sources of nitrate contamination in water are thus fertilizers, animal waste, and septic tank wastes.”]
Ransom, K. M., et al. (2022). Estimated Nitrate Concentrations in Groundwater Used for Drinking. Science of the Total Environment, 807, 151065, Abstract and p. 9. [“In areas of predicted high nitrate concentration, applied manure, farm fertilizer, and agricultural land use were influential predictor variables… Nitrogen from applied manure was the highest ranked nitrogen source variable and had a clear positive relation with nitrate predictions.”]
The EPA has set the maximum contaminant level (MCL) for nitrate in public drinking water supplies in the U.S. at 10 mg/per liter to protect against infant methemoglobinemia (or blue baby syndrome).[1,2] In setting the MCL, other health effects including cancer and adverse reproductive outcomes were not considered.[3,4]
The agency acknowledges that “concentrations greater than 3mg/L generally indicate contamination.”[5]
The MCL for nitrates applies to public water systems. For private wells it is only a guideline.[6,7] Private well owners are responsible for testing and treatment.[8]
Code of Federal Regulations, Title 40, Chapter I, Subchapter D, Part 141 – National Primary Drinking Water Regulations. See “Detection Limits for Inorganic Contaminants.”
Levin, R., et al., (2024). US drinking water quality: exposure risk profiles for seven legacy and emerging contaminants. Journal of Exposure Science & Environmental Epidemiology, 34(1), 3–22, p. 10. [“The US recommended standard for nitrate in drinking water was originally set in 1962 by the US Public Health Service as 10 mg NO3 -N/L, based on infant methemoglobinemia.”]
Ward, M., et al., (2018). Drinking Water Nitrate and Human Health: An Updated Review. International Journal of Environmental Research and Public Health, 15(7), 1557, p. 2. [“The MCL was set to protect against infant methemoglobinemia; however other health effects including cancer and adverse reproductive outcomes were not considered.”]
Levin, R., et al., (2024), p. 10. [“EPA’s subsequent MCL only considered this outcome (methemoglobinemia) … other health effects were not considered.”]
U.S. EPA (June 5, 2025) Estimated Nitrate Concentrations in Groundwater Used for Drinking. [“While nitrate does occur naturally in groundwater, concentrations greater than 3 mg/l generally indicate contamination, and a more recent nationwide study found that concentrations over 1 mg/l nitrate indicate human activity.”]
Blaisdell, J., et al., (2019). Prenatal exposure to nitrate in drinking water and the risk of congenital anomalies. Environmental research, 176, 108553, p. 3 [“Additionally, private well systems are not required to adhere to EPA MCL limits and over 15 million U.S. households rely on such water systems.”]
Pennino, M. J., et al., (2017). Trends in drinking water nitrate violations across the United States. Environmental science & technology, 51(22), 13450-13460, p. 2. [“About 86% of the U.S. population obtains their water from a public water system (PWS); the other 14% gets their water from a private source, typically unregulated domestic wells.”]
Levin, R., et al., (2024), p. 10. [“Treatment of private wells is the responsibility of the property owner, leading to racial/ethnic, rural/urban, and socioeconomic disparities in access to safe drinking water.”]
Although many reports present evidence of a wide range of human health impacts, most researchers acknowledge that the studies are not conclusive.[1] Researchers use words like “suggest” and “associations” even when their evidence appears surprisingly strong.[2] The reasons:
![]() There are not enough studies.[3]
There are not enough studies.[3]![]() Even strong associations do not confirm causation. For example, high nitrate levels in drinking water often indicate the likelihood of other contaminants such as pesticides and VOCs due to shared pollution sources and pathways.[4]
Even strong associations do not confirm causation. For example, high nitrate levels in drinking water often indicate the likelihood of other contaminants such as pesticides and VOCs due to shared pollution sources and pathways.[4]![]() Studying human health and dietary habits is inherently difficult.[5]
Studying human health and dietary habits is inherently difficult.[5] ![]() Studying nitrate levels in private wells is difficult, requiring individual testing; there is little easily accessible data.[6,7]
Studying nitrate levels in private wells is difficult, requiring individual testing; there is little easily accessible data.[6,7]![]() Nitrate levels change, even with the seasons.[8]
Nitrate levels change, even with the seasons.[8]
The households most at risk are those not testing their well water, making it particularly difficult to perform large longitudinal studies.
Ward, M., et al., (2018). Drinking Water Nitrate and Human Health: An Updated Review. International Journal of Environmental Research and Public Health, 15(7), 1557, p. 19. [“However, the number of studies of any one outcome was not large and there are still too few studies to allow firm conclusions about risk.”]
Brender, J. D., et al., (2013). Prenatal nitrate intake from drinking water and selected birth defects in offspring of participants in the national birth defects prevention study. Environmental health perspectives, 121(9), 1083, p. 1087. [“Results from this large population-based case–control study suggest that prenatal nitrate intake from drinking water is associated with NTDs, oral cleft defects, and limb deficiencies in offspring.”]
Picetti, R., et al., (2022). Nitrate and nitrite contamination in drinking water and cancer risk: A systematic review with meta-analysis. Environmental Research, 210, Article 112988, pp. 19-20. [“Despite the growing body of evidence synthesized here, it is not possible to reach a definitive conclusion on the risk of cancer associated with nitrate in drinking water, since most cancer types were investigated by four studies or less. The degree of uncertainty was high, with wide confidence intervals.”]
Schaider, L. A., et al., (2019). Environmental justice and drinking water quality: are there socioeconomic disparities in nitrate levels in U.S. drinking water? Environmental Health, 18(1), Article 3, p. 2. [“Elevated levels of nitrate can signal the presence of other contaminants of concern; a study of over 2000 private wells found that wells with >1mg/L NO3-N were more likely to have levels of pesticides and volatile organic compounds…”] Citing to Dubrovsky, N. M., et al. (2010). The Quality of Our Nation’s Water— Nutrients in the Nation’s Streams and Groundwater, 1992–2004, USGS Circular 1350, p. 112]
Note: It is difficult to ascertain, for example, how much water participants drink. What are their sources? Are they accurately recalling, or telling the truth?
Schaider, L. A., et al., (2019), p. 13. [“Nitrate data for private wells, which are even more vulnerable to nitrate contamination, are lacking.”]
Ward, M., et al., (2018), p. 20. [“A major challenge in conducting studies in these regions is the high prevalence of private well use with limited nitrate measurement data for exposure assessment.”]
Picetti, R., et al., (2022), pp. 19-20. [“The concentration of nitrate in these sources varies with seasons.”]
High or sometimes moderate levels of nitrates in drinking water are linked to:![]() Blue baby syndrome (methemoglobinemia)[1,2]
Blue baby syndrome (methemoglobinemia)[1,2] ![]() Birth defects.[3-5]
Birth defects.[3-5] ![]() Low birth weight.[6,7]
Low birth weight.[6,7]
Many of these health risks have been identified at levels well below the EPA’s MCL (maximum contaminant level) of 10 mg/L.[8,9] All researchers believe that the issues warrant further study.
U.S. EPA (2024) National Primary Drinking Water Regulations. [“Infants below the age of six months who drink water containing nitrate in excess of the MCL could become seriously ill and, if untreated, may die. Symptoms include shortness of breath and blue-baby syndrome.”]
Johnson, S. F. (2019). Methemoglobinemia: Infants at risk. Current problems in pediatric and adolescent health care, 49(3), 57-67, p. 65. [“Because most people do not test their well water for nitrates and/or bacteria, methemoglobinemia is a lurking danger for infants under 6 months of age drinking well water.”]
Brender, J. D., et al., (2013). Prenatal nitrate intake from drinking water and selected birth defects in offspring of participants in the national birth defects prevention study. Environmental health perspectives, 121(9), 1083, p. 1087. [“Results from this large population-based case–control study suggest that prenatal nitrate intake from drinking water is associated with neural tube defects, oral cleft defects, and limb deficiencies in offspring.”]
Blaisdell, J., et al., (2019). Prenatal exposure to nitrate in drinking water and the risk of congenital anomalies. Environmental research, 176, 108553, p. 6. [“Expectant mothers that consumed on average more than 5.0 mg per day of nitrate through drinking water had nearly twice the odds of giving birth to a child with a limb deficiency compared to mothers that consumed less than 1.0 mg per day.” at p. 8. “The average monthly concentrations ranged from 0.03 to 6.36 mg/L. All estimated average exposures were below the EPA’s MCL of 10 mg/L.” at p. 6]
Levin, R., et al., (2024). US drinking water quality: exposure risk profiles for seven legacy and emerging contaminants. Journal of Exposure Science & Environmental Epidemiology, 34(1), 3–22, p. 10. [“Among epidemiologic studies with individual level data, seven studies (in Australia, Canada, California, Texas, and Denmark) found increased central nervous system (CNS) malformations in children whose mothers consumed drinking water with high nitrate concentrations during pregnancy. In six studies, the increase in CNS malformations occurred at levels below the MCL.”]
Stayner, L. T., et al., (2017). Atrazine and nitrate in drinking water and the risk of preterm delivery and low birth weight in four Midwestern states. Environmental research, 152, 294-303. [“We observed significant evidence of a linear exposure-response relationship between nitrate in water and the risk of both very pre-term delivery and very low birth weight in several models.”]
Temkin, A., et al., (2019). Exposure-based assessment and economic valuation of adverse birth outcomes and cancer risk due to nitrate in United States drinking water. Environmental research, 176, 108442, p. 7. [“Based on risk estimates reported in epidemiological studies on drinking water nitrate exposure and pregnancy outcomes, we calculated that annually 2939 very low birth weight births, 1725 very preterm births, and 41 births with neural tube defects could be attributable to nitrate exposure.”]
Levin, R., et al., (2024), p. 10. [“In six studies, the increase in central nervous system malformations occurred at levels below the MCL.”]
Stayner, L. T., et al., (2017), p. 302. [“Only approximately 2% of the monthly average atrazine and nitrates exposure levels in the study exceeded the EPA’s MCL (3 ppb and 10 ppm respectively). Analyses performed excluding the data that exceeded the MCLs did not alter the results.”]
The body of reports is steadily growing connecting a variety of cancer risks to nitrates in drinking water, including colorectal, thyroid, ovarian, and gastric cancers.[1-8]
Many of these cancer risks have been identified at levels well below the EPA’s MCL (maximum contaminant level) of 10 mg/L.[9] There is still a great deal of uncertainty for all the reasons noted above.
Mendy, A. & Thorne, P. S. (2024). Long-term cancer and overall mortality associated with drinking water nitrate in the United States. Public Health, 228, 82-84. [“Conclusions: Levels of drinking water nitrate may be an overlooked contributor to cancer mortality in the U.S.”]
Ward, M., et al., (2018). Drinking Water Nitrate and Human Health: An Updated Review. International Journal of Environmental Research and Public Health, 15(7), 1557, p. 20. [“ Four of the five published studies of colorectal cancer found evidence of an increased risk of colorectal cancer or colon cancer associated with water nitrate levels that were mostly below the respective regulatory limits.”]
Temkin, A., et al., (2019). Exposure-based assessment and economic valuation of adverse birth outcomes and cancer risk due to nitrate in United States drinking water. Environmental research, 176, 108442, p. 11. [“Our data suggest that exposure to nitrate in drinking water could account for 1–8% of total colorectal cancer cases, which translates into 1,233–10,379 cancer cases annually. Of these cases, 12–24% are due to nitrate exposure for private well users, especially for people whose well water has 5 mg/L or more nitrate.”]
Ward, M. H., et al., (2010). Nitrate intake and the risk of thyroid cancer and thyroid disease. Epidemiology, 21(3), 389-395, Abstract. [“We found an increased risk of thyroid cancer with higher average nitrate levels in public water supplies and with longer consumption of water exceeding 5 mg/L.”]
Ammons, S., et al., (2025). Nitrate and disinfection by-products in drinking water and risk of ovarian cancer. Environmental epidemiology, 9(3), e382, p. 6. [“Our findings suggest that higher average nitrate levels in drinking water are associated with increased ovarian cancer risk.”]
Picetti, R., et al., (2022). Nitrate and nitrite contamination in drinking water and cancer risk: A systematic review with meta-analysis. Environmental Research, 210, Article 112988, Abstract, p. 19. [“We identified an association of nitrate in drinking water with gastric cancer but with no other cancer site. … However, even though most studies do not show statistically significant associations between nitrate in water and cancer, the point estimates reported suggest that there may be a higher risk, with few exceptions.”]
For a listing of further studies on cancer and nitrates see: EWG (April 2020) Nitrates in Drinking Water Factsheet . https://static.ewg.org/reports/2020/covid-stimulus/EWG_Nitrate_Factsheet_PP01.pdf
Natasha Gilbert (January 30, 2025) As EPA considers cancer links to nitrates in drinking water, industry downplays the risks. U.S. Right to Know.
Ward, M., et al., (2018), p. 20. [“ Four of the five published studies of colorectal cancer found evidence of an increased risk of colorectal cancer or colon cancer associated with water nitrate levels that were mostly below the respective regulatory limits.”]
It depends on the definition of “high.” The EPA has set the maximum contaminant level (MCL) at 10 mg/L for nitrates.[1] However, there is significant evidence that levels of 3-5 mg/L, or even lower can create health concerns.[2-5]
![]() Approximately 1.4 million people in the U.S. rely on groundwater sources that exceed the EPA’s maximum contaminant level (MCL) of 10 mg/L for drinking water.[6]
Approximately 1.4 million people in the U.S. rely on groundwater sources that exceed the EPA’s maximum contaminant level (MCL) of 10 mg/L for drinking water.[6]
![]() Approximately 5.6 million people relied on a public water supply with 5 mg/L or greater.[7] (This figure does not include an estimate of private well users with 5 mg/L or greater.)
Approximately 5.6 million people relied on a public water supply with 5 mg/L or greater.[7] (This figure does not include an estimate of private well users with 5 mg/L or greater.)
![]() Much larger populations are at risk when considering intermittent exceedances, untested private wells, and/or lower nitrate concentrations in public water supplies.[8,9]
Much larger populations are at risk when considering intermittent exceedances, untested private wells, and/or lower nitrate concentrations in public water supplies.[8,9]
U.S. EPA (June 2025). Estimated Nitrate Concentrations in Groundwater Used for Drinking. [“EPA’s maximum contaminant level (MCL) for nitrate set to protect against blue-baby syndrome is 10 mg/l.”]
Ward, M., et al., (2018). Drinking Water Nitrate and Human Health: An Updated Review. International Journal of Environmental Research and Public Health, 15(7), 1557, Abstract and p. 2. [“ Many studies observed increased risk with ingestion of water nitrate levels that were below regulatory limits. … The MCL was set to protect against infant methemoglobinemia; however other health effects including cancer and adverse reproductive outcomes were not considered.”]
Blaisdell, J., et al., (2019). Prenatal exposure to nitrate in drinking water and the risk of congenital anomalies. Environmental research, 176, 108553, p. 6. [“Approximately 3% of babies born in the U.S. each year are affected by a birth defect and birth defects account for 20% of infant deaths nationally.” at p. 2. “The average monthly concentrations ranged from 0.03 to 6.36 mg/L. All estimated average exposures were below the EPA’s MCL of 10 mg/L.” at p. 6. “Expectant mothers that consumed on average more than 5.0 mg per day of nitrate through drinking water had nearly twice the odds of giving birth to a child with a limb deficiency compared to mothers that consumed less than 1.0 mg per day.” at p. 8]
Schaider, L. A., et al., (2019). Environmental justice and drinking water quality: are there socioeconomic disparities in nitrate levels in U.S. drinking water? Environmental Health, 18(1), Article 3, p. 10. [“Epidemiological studies have suggested that long-term exposure to water with nitrate concentrations above 5 mg/L may be associated with some types of cancer, birth defects, and preterm birth.”]
U.S. EPA (June 2025). Estimated Nitrate Concentrations in Groundwater Used for Drinking. [“While nitrate does occur naturally in groundwater, concentrations greater than 3 mg/l generally indicate contamination, and a more recent nationwide study found that concentrations over 1 mg/l nitrate indicate human activity.”]
Ransom, K. M., et al., (2022). Estimated Nitrate Concentrations in Groundwater Used for Drinking. Science of the Total Environment, 807, 151065, p. 9. [“Although the aerial proportion of high nitrate concentrations is not large, a significant number of people are potentially affected. Our results indicate that 450 K people relying on domestic wells and 910 K equivalent people relying on public-supply wells are potentially at risk…” High nitrate concentrations defined as “(MCL) of 10 mg/L as N.”]
Schaider, L. A., et al., (2019), p. 2. [Study from 2010-2014. “5.6 million Americans are served by a CWS that had an average nitrate concentration = 5 mg/L NO3-N between 2010 and 2014. Extent of agricultural land use and reliance on groundwater sources were significantly associated with nitrate.”]
Blaisdell, J., et al., (2019), p. 3. [“Additionally, private well systems are not required to adhere to EPA MCL limits and over 15 million U.S. households rely on such water systems.”]
Anne Schechinger (June 24, 2020) EWG Investigation: Across Farm Country, Nitrate Pollution of Drinking Water for More Than 20 Million Americans Is Getting Worse. Environmental Working Group. https://www.ewg.org/interactive-maps/2020-nitrate-pollution-of-drinking-water-for-more-than-20-million-americans-is-getting-worse/
A 2022 study by USGS scientists estimated that nationally about 900,000 people relied on public supply wells that exceeded the EPA’s MCL of 10mg/L (at a point in time).[1]
A 2019 national study evaluating EPA data of nitrate exposures in U.S. community water systems from 2010 to 2014 estimated that about 5.6 million people were exposed to nitrate levels at ≥5mg/L.[2]
An analysis of public records by the non-profit Environmental Working Group found that between 2003-2017, public water systems serving more than 45 million people detected levels of nitrate at or above 3mg/L at least once over that period.[3]
Public wells are less prone to nitrate exceedances because they are usually deeper than private wells, but naturally they affect more people. Many public wells install water purification systems to counter the nitrate pollution. As of 2016, about 15% of public water supply systems had nitrate removal technology.[4] These systems can be very costly, especially for small communities.[5] The costs of maintenance are a financial transfer from polluters to consumers.[6]
Ransom, K. M., et al. (2022). Estimated Nitrate Concentrations in Groundwater Used for Drinking. Science of the Total Environment, 807, 151065, p. 9. [“Although the aerial proportion of high nitrate concentrations is not large, a significant number of people are potentially affected. Our results indicate that 450 K people relying on domestic wells and 910 K equivalent people relying on public-supply wells are potentially at risk…” High nitrate concentrations defined as “(MCL) of 10 mg/L as N.”]
Schaider, L. A., et al., (2019). Environmental justice and drinking water quality: are there socioeconomic disparities in nitrate levels in U.S. drinking water? Environmental Health, 18(1), Article 3, Abstract. [“5.6 million Americans are served by a CWS that had an average nitrate concentration = 5 mg/L NO3-N between 2010 and 2014. Extent of agricultural land use and reliance on groundwater sources were significantly associated with nitrate.”]
Anne Schechinger (June 24, 2020) EWG Investigation: Across Farm Country, Nitrate Pollution of Drinking Water for More Than 20 Million Americans Is Getting Worse. Environmental Working Group.
Pennino, M. J., et al., (2018). Trends in Drinking Water Nitrate Violations Across the United States, Environ Sci Technol 51(22) 134050, p. 5. [All EPA authors. “…the percent of all active systems with nitrate removal technologies increased from 13.9% to 15.0% (20,803 to 22,122 systems) between 2014 and 2016.”]
DeSimone, L. A., et al., (2014) The quality of our Nation’s waters: Water quality in principal aquifers of the United States, 1991-2010, USGS, Circular 1360, p. 89. [“Where groundwater used for public supply is contaminated with nitrate, treatment can decrease nitrate concentrations but is costly, particularly for small communities.”]
Rauh, E. & Hughes, S. (2024). Collaboration for source water protection in the United States: Community water systems engagement in nitrate pollution reduction. Wiley Interdisciplinary Reviews: Water, 11(2), e1682, p. 5. [“While treatment systems have historically provided safe drinking water to millions of people, nitrate treatment can be cost prohibitive for existing CWSs and shifts the burden of financing safe source water from polluters to CWSs and their customers.”]
About 42 million U.S. consumers source their water from self-supplied groundwater wells.[1] Private wells are generally shallower than public wells, and shallow wells are more vulnerable to nitrate contamination. Because the EPA does not regulate or track nitrates in private wells, they typically have higher nitrate concentrations than public water systems.[2] Because private well owners are not generally required to test for contaminants, high nitrate levels may go undetected.[3,4]
A national water quality study by the USGS estimated that 6% of private wells exceeded the 10mg/L level, with the highest nitrate concentrations in agricultural areas where “applied manure, farm fertilizer, and agricultural land use were influential predictor variables.” The study estimated that about 900,000 consumers would be affected.[5]
An analysis of data in Iowa – the state with the most EPA-defined CAFOs and the most crop acreage dedicated to corn and soybeans – showed that 12% of private wells averaged at or above 10 mg/L.[6]
Dieter, C.A. et al., (2018). Estimated Use of Water in the United States in 2015, U.S. Geological Survey, p. 22 and Table 6, p. 23. [“An estimated 42.5 million people in the United States, or 13 percent of the population, provided their own water for domestic use in 2015.” 98 percent were from groundwater.]
Levin, R., et al., (2024). US drinking water quality: exposure risk profiles for seven legacy and emerging contaminants. Journal of Exposure Science & Environmental Epidemiology, 34(1), 3–22, p. 10. [“Private wells typically have higher nitrate concentrations than CWSs due to their shallower depth. … Treatment of private wells is the responsibility of the property owner, leading to racial/ethnic, rural/urban, and socioeconomic disparities in access to safe drinking water.]
Schaider, L. A., et al., (2019). Environmental justice and drinking water quality: are there socioeconomic disparities in nitrate levels in U.S. drinking water? Environmental Health, 18(1), Article 3, p. 13. [Private wells are “also more likely to be located in rural areas and may be in closer proximity to agriculture and livestock production sources. … Nitrate data for private wells, which are even more vulnerable to nitrate contamination, are lacking.”]
Anne Schechinger (2019) Iowa’s Private Wells Contaminated by Nitrate and Bacteria. Environmental Working Group and Iowa Environmental Council. [“Almost two-thirds of all the wells tested for nitrate or bacteria were tested only once in 16 years.”]
Ransom, K. M., et al., (2022). Estimated Nitrate Concentrations in Groundwater Used for Drinking. Science of the Total Environment, 807, 151065, Abstract, and see Table 1, p. 4. [All authors worked for the USGS.]
Anne Schechinger (2019). Iowa’s Private Wells Contaminated by Nitrate and Bacteria. [6,600 / 55,000 = 12%]
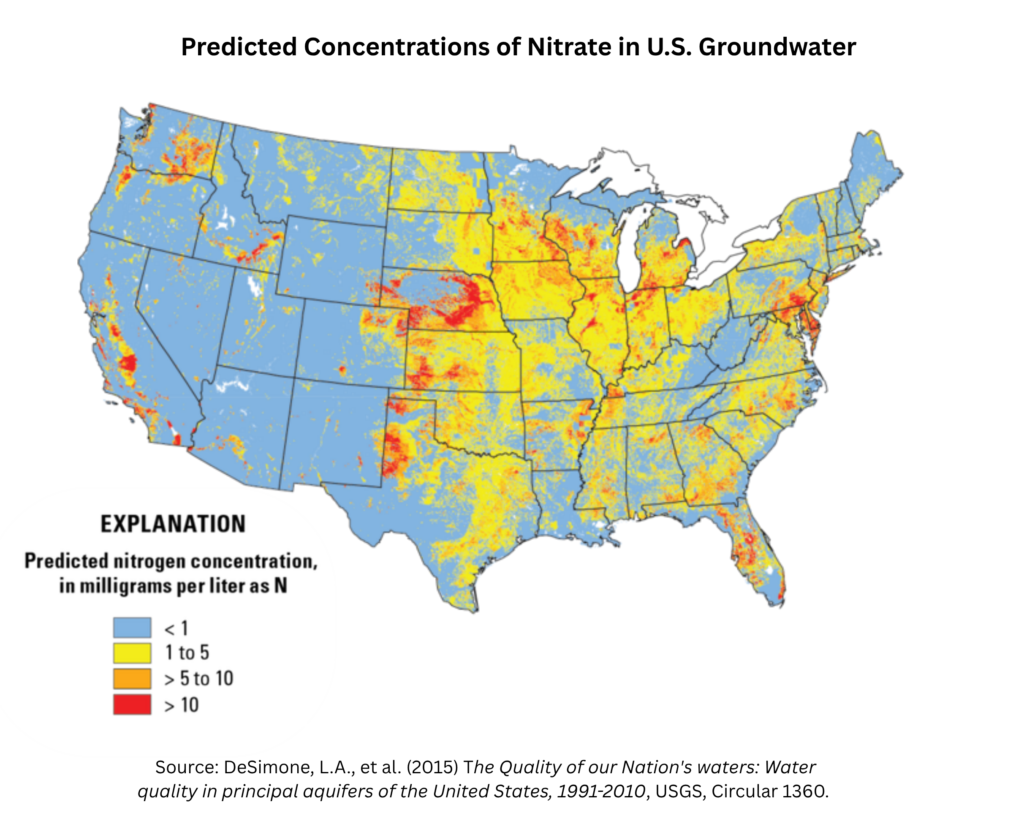
High nitrate levels are region-specific, mostly in agricultural areas.[1] Other factors include geology, climate, precipitation, and land use practices (such as the installation of drainage systems).[2]
The USGS has determined that concentrations are especially high beneath agricultural land in the mid-Atlantic region, the Midwest, the Northwest, and in California. These areas have high nitrogen inputs and conditions favorable to nitrogen transport in groundwater.[3,4]
Ransom, K. M., et al., (2022) Estimated Nitrate Concentrations in Groundwater Used for Drinking. Science of the Total Environment, 807, 151065, Abstract and p. 9. [“In areas of predicted high nitrate concentration, applied manure, farm fertilizer, and agricultural land use were influential predictor variables… Nitrogen from applied manure was the highest ranked nitrogen source variable and had a clear positive relation with nitrate predictions.”]
DeSimone, L. A., et al., (2014). The quality of our Nation’s waters: Water quality in principal aquifers of the United States, 1991-2010, USGS, Circular 1360, p. 87.
DeSimone, L. A., et al., (2014), p. 85.
map from DeSimone, L. A., et al., (2014), p. 90.
Several states with consistently high levels of nitrates in water (as predicted by the USGS map above) are regularly in the news. For example:
![]() Iowa – A 2025 report commissioned by Polk County found that “nitrate concentrations greater than 5.0 mg/L have been a widespread occurrence in the Des Moines River under a range of hydrologic conditions.”[1] The sources of nitrate were found to be primarily chemical fertilizer, manure, and atmospheric deposition (much of which comes from manure).[2] An earlier analysis of private well data from 2002 to 2017 by Environmental Working Group found that 12% of private wells averaged at or above the 10 mg/L drinking water standard for nitrate.[3] Cancer rates in Iowa are a growing concern.[4] Environmental groups have provided detailed information about the threats to Iowa’s drinking water.[5]
Iowa – A 2025 report commissioned by Polk County found that “nitrate concentrations greater than 5.0 mg/L have been a widespread occurrence in the Des Moines River under a range of hydrologic conditions.”[1] The sources of nitrate were found to be primarily chemical fertilizer, manure, and atmospheric deposition (much of which comes from manure).[2] An earlier analysis of private well data from 2002 to 2017 by Environmental Working Group found that 12% of private wells averaged at or above the 10 mg/L drinking water standard for nitrate.[3] Cancer rates in Iowa are a growing concern.[4] Environmental groups have provided detailed information about the threats to Iowa’s drinking water.[5]
![]() Nebraska – According to a state government study, about 17% of the private wells in Nebraska exceed the 10 mg/L MCL for nitrates, threatening the health of more than 60,000 consumers.[6] In a statewide free nitrate testing effort, the average MCL for all sampled private wells was just under 5 mg/L – a level commonly understood to be a health risk.[7] According to the Nebraska Association of Resources Districts, “Approximately 10% of Nebraska’s community water systems have exceeded the EPA’s maximum contaminant level for nitrates at least one time since 2010.”[8] Media coverage points out that the problem has existed for a long time.[9]
Nebraska – According to a state government study, about 17% of the private wells in Nebraska exceed the 10 mg/L MCL for nitrates, threatening the health of more than 60,000 consumers.[6] In a statewide free nitrate testing effort, the average MCL for all sampled private wells was just under 5 mg/L – a level commonly understood to be a health risk.[7] According to the Nebraska Association of Resources Districts, “Approximately 10% of Nebraska’s community water systems have exceeded the EPA’s maximum contaminant level for nitrates at least one time since 2010.”[8] Media coverage points out that the problem has existed for a long time.[9]
![]() Wisconsin – A 2025 state report on groundwater quality notes that “Nitrate is Wisconsin’s most widespread groundwater contaminant and is increasing in extent and severity in the state.”[10] The report estimates that about 7% of tested private wells exceed the EPA’s MCL of 10mg/L. This puts about 140,000 residents in clear danger.[11] The Alliance for the Great Lakes has effectively noted the challenges, stating that “Wisconsin is facing a public health and environmental crisis fueled by widespread nitrate contamination in drinking water.”[12] Researchers have estimated the significant economic and human health costs.[13]
Wisconsin – A 2025 state report on groundwater quality notes that “Nitrate is Wisconsin’s most widespread groundwater contaminant and is increasing in extent and severity in the state.”[10] The report estimates that about 7% of tested private wells exceed the EPA’s MCL of 10mg/L. This puts about 140,000 residents in clear danger.[11] The Alliance for the Great Lakes has effectively noted the challenges, stating that “Wisconsin is facing a public health and environmental crisis fueled by widespread nitrate contamination in drinking water.”[12] Researchers have estimated the significant economic and human health costs.[13]
Currents of Change: An analysis of the Raccoon and Des Moines Rivers in Central Iowa (2025). Polk County Final Scientific Assessment of Source Water Research Report, p. 120. “For the 5.0 mg/l threshold (bottom), the past 20 years’ average annual number of exceedances was 206, over 50% of days. Nitrates exceeded this lower threshold over half the time in numerous years. In 2015 and 2016, nitrate exceeded 5.0 mg/l on approximately 90% of days. Even in years with low streamflow, the number of days above this threshold was often as high as 100.”]
Currents of Change: An analysis of the Raccoon and Des Moines Rivers in Central Iowa, p. 25. [Iowa is one of the country’s leading producers of hogs, cattle, and poultry, as well as a leading producer of corn and soybeans used to feed the animals. See, Jones, C. J., et al. (2018) Livestock manure driving stream nitrate. Ambio, Vol 48: 1143]
Anne Schechinger (April 2019). Iowa’s Private Wells Contaminated by Nitrate and Bacteria, Environmental Working Group and Iowa Environmental Council.
Tom Philpott (October 22, 2025). Of Corn and Cancer: Iowa’s Deadly Water Crisis. The New Republic. https://newrepublic.com/article/201118/corn-cancer-iowa-deadly-water-crisis
Iowa Environmental Council (2024). Nitrate in drinking water: A public health concern for all Iowans. Iowa Environmental Council, Des Moines.
Nebraska Nitrate in Drinking Water Study (November 2024). Nebraska Department of Environment and Energy (NDEE), p. ES-8, p. 1. [“Available data suggests around 17% of private domestic wells in the state exceed the SDWA nitrate standard.” … Therefore, it is estimated that approximately 360,000 Nebraskans depend on private domestic wells for their drinking water.]
Nebraska Nitrate in Drinking Water Study (November 2024). [“The average nitrate concentration for the samples collected as part of the free sampling effort was 4.83 mg/L.”]
Water Quality: Nitrate Contamination (September 3, 2025). Nebraska’s Natural Resources Districts. https://www.nrdnet.org/news/09-03-2025/water-quality-nitrate-contamination
Yanqi Xu (February 14, 2025). Many Nebraskans still under threat of high nitrate in drinking water, report finds. Flatwater Free Press. [“Rural Nebraska’s nitrate problem doesn’t appear to be getting any better – the results of the recent testing are roughly in line with the 20-year testing average for private wells.”] https://flatwaterfreepress.org/many-nebraskans-still-under-threat-of-high-nitrate-in-drinking-water-report-finds/
Wisconsin Groundwater Coordinating Council Report to the Legislature 2025, p. 91.
Wisconsin Groundwater Coordinating Council Report to the Legislature 2025, p. 93. [Calculation: Report notes that approximately one-third of 6M residents use private wells for drinking water. Therefore .07 * .33 * 6M = 138,600]
Nitrates on Tap – The Cost of Nitrate Contamination in Wisconsin’s Drinking Water (2025). Alliance for the Great Lakes, p. 4.
Mathewson, P. D., et al., (2020). Health and economic impact of nitrate pollution in drinking water: a Wisconsin case study. Environmental Monitoring and Assessment, 192(11), 724, Abstract. [“We estimate that annually, 111–298 combined cases of colorectal, ovarian, thyroid, bladder, and kidney cancer in Wisconsin may be due to nitrate contamination of drinking water. Each year, up to 137–149 cases of very low birth weight, 72–79 cases of very preterm birth, and two cases of neural tube defects could be due to nitrate exposure from drinking water.”]
Like many other negative externalities of animal ag, the costs of nitrate pollution are mostly borne by rural populations in agricultural settings.[1] They are likely to have shallow wells untested for nitrate pollution, thereby exposing their families to disease.[2,3]
Small communities with public water supplies may struggle to afford expensive nitrate treatment equipment.[4-6]
The nitrate pollution of drinking water, like many negative externalities of animal ag, transfer costs from large corporations and meat consumers to nonconsenting third parties, and often to vulnerable communities.[7-9]
DeSimone, L. A., et al., (2014). The quality of our Nation’s waters: Water quality in principal aquifers of the United States, 1991-2010, USGS, Circular 1360, p. 89. [“Concentrations were considerably higher in shallow groundwater beneath agricultural land than in shallow groundwater beneath urban areas or in deeper groundwater used for drinking-water supplies: 22 percent of wells in agricultural settings had concentrations greater than the MCL.”]
Pennino, M. J., et al., (2017). Trends in drinking water nitrate violations across the United States. Environmental science & technology, 51(22), 13450-13460, p. 2. [“Numerous studies indicate significant contamination of groundwater by nitrate across the U.S., particularly in shallow or unconfined groundwater wells underlying agricultural areas with high levels of fertilizer use and well-drained soil.”]
Ward, M., et al., (2018). Drinking Water Nitrate and Human Health: An Updated Review. International Journal of Environmental Research and Public Health, 15(7), 1557, p. 20. [“Populations with the highest exposure to nitrate from their drinking water are those living in agricultural regions, especially those drinking water from shallow wells near nitrogen sources (e.g., crop fields, animal feeding operations).”]
Rauh, E. & Hughes, S. (2024). Collaboration for source water protection in the United States: Community water systems engagement in nitrate pollution reduction. Wiley Interdisciplinary Reviews: Water, 11(2), e1682, p. 5. [“While treatment systems have historically provided safe drinking water to millions of people, nitrate treatment can be cost prohibitive for existing CWSs and shifts the burden of financing safe source water from polluters to CWSs and their customers.”]
DeSimone, L. A., et al., (2014), p. 89. [“Where groundwater used for public supply is contaminated with nitrate, treatment can decrease nitrate concentrations but is costly, particularly for small communities.”]
Anne Schechinger (EWG) Craig Cox (2018) America’s Nitrate Habit Is Costly and Dangerous. Environmental Working Group.
Schaider, L. A., et al., (2019). Environmental justice and drinking water quality: are there socioeconomic disparities in nitrate levels in US drinking water?. Environmental Health, 18(1), 3, p. 12. [“We found that communities with higher proportions of Hispanic residents tend to be served by community water systems with higher nitrate and greater likelihood of being over 5mg/L.”]
Levin, R., et al., (2024). US drinking water quality: exposure risk profiles for seven legacy and emerging contaminants. Journal of Exposure Science & Environmental Epidemiology, 34(1), 3–22, p. 10. [“Treatment of private wells is the responsibility of the property owner, leading to racial/ethnic, rural/urban, and socioeconomic disparities in access to safe drinking water.”]
VanDerslice, J. (2011). Drinking water infrastructure and environmental disparities: evidence and methodological considerations. American journal of public health, 101(S1), S109-S114, p. S111. [“There were several case studies of low income and minority communities in rural agricultural areas that relied on groundwater that had high levels of nitrates or other agricultural chemicals.”]
Unfortunately, no. As noted above, many families are subject to serious health threats, mostly from industrial animal agriculture.
The limit of 10mg/L was originally proposed by the EPA in 1962, focused on methemoglobinemia (blue baby syndrome).[1,2] The Safe Drinking Water Act was passed by Congress in 1974.[3] In 1975, the EPA instituted the current MCL of 10mg/L under that act.[4,5]
In the following 50 years, the EPA has not revised that determination despite the large body of literature investigating nitrates’ health effects (as noted above).
In 2017, the EPA began a review to assess whether nitrate levels should be changed.[6] That review was derailed in 2018.[7] In 2023 the review was “unsuspended,” though there is no sign of a new assessment coming out any time soon.[8]
U.S. Department of Health, Education, and Welfare. 1962. Public Health Service Drinking Water Standards 1962, Public Health Service Publication No. 956, Washington, DC, pp. 47-51.
Levin, R., et al., (2024). US drinking water quality: exposure risk profiles for seven legacy and emerging contaminants. Journal of Exposure Science & Environmental Epidemiology, 34(1), 3–22, p. 10. [“The US recommended standard for nitrate in drinking water was originally set in 1962 by the US Public Health Service as 10 mg NO3 -N/L, based on infant methemoglobinemia.”]
Safe Drinking Water Act (SDWA): A Summary of the Act and Its Major Requirements, Congress.gov., footnote 5. https://www.congress.gov/crs-product/RL31243 [“The 1974 act directed EPA to establish “national interim primary drinking water regulations,” with enforceable standards (i.e., maximum contaminant levels) for a list of contaminants based on the 1962 U.S. Public Health Service interstate carrier drinking water quality standards.”]
National primary drinking water regulation for nitrate and nitrite Conference (January 1, 1989). American Chemical Society, Division of Environmental Chemistry, Preprints; (USA) U.S. Department of Energy (1989) Office of Scientific and Technical Information. [“The US Environmental Protection Agency (EPA) promulgated National Interim Primary Drinking Water Regulations on December 24, 1975. These regulations included an interim maximum contaminant level (MCL) for nitrate of 10 mg/L as nitrogen.”]
Code of Federal Regulations, Title 40, Chapter I, Subchapter D, Part 141, National Primary Drinking Water Regulations. [“Source: 40 FR 59570, Dec. 24, 1975, unless otherwise noted.”]
IRIS Assessment Plan for Nitrate and Nitrite [CASRNs 14797-55-8 and 14797-65-0] (September 2017). EPA/635/R-17/331. [“The Integrated Risk Information System (IRIS) Program is undertaking a reassessment of the health effects of nitrate and nitrite.”]
U.S. EPA (November 2023) Nitrate, CASRN 14797-55-8 | DTXSID5024217. https://iris.epa.gov/Document/&deid=337470 [“EPA suspended the assessment in fiscal year 2019. It may be restarted as Agency priorities change.”]
U.S. EPA (October 2023) A Message from the IRIS Program, IRIS Program Outlook, p. 4. [“The nitrates/nitrites IRIS assessment was suspended in December 2018 due to realignment of Agency priorities… The assessment was unsuspended and announced in the June 2023 Outlook.”]