Agricultural land use leading to habitat loss is the primary driver of biodiversity loss.
Animal agriculture has driven the transformation of more than half of the land in the contiguous U.S.; about 35% is grazing land and about 10% is used specifically for animal feed.
Grasslands converted to monoculture croplands have imperiled one of the world’s most biodiverse ecosystems; about 60% of U.S. grasslands have been lost.
Corn and soybeans are mostly grown on land that was originally grassland; birds and insects, including bees, are among the most harmed species.
The ongoing degradation of grazing lands as assessed by federal agencies point to major negative impacts on biodiversity.
It is widely accepted that globally, agricultural land use leading to habitat loss is the primary driver of biodiversity loss.[1-7]
Campbell, B. M., et al., (2017). Agriculture production as a major driver of the Earth system exceeding planetary boundaries. Ecology and Society, 22(4). [“In the absence of better information, we suggest 80% as the role of agriculture in the status of the biosphere integrity.” Biosphere integrity refers to rates of extinction and reduction in populations.]
Tilman, D., et al., (2017). Future threats to biodiversity and pathways to their prevention. Nature, 546(7656), 73-81. [“About 80% of all threatened terrestrial bird and mammal species are imperiled by agriculturally driven habitat loss.”]
Díaz, S., et al., (2019). Pervasive human-driven decline of life on Earth points to the need for transformative change. Science, 366(6471), eaax3100, p. 4. [“Within terrestrial and freshwater ecosystems, the driver (of biodiversity loss) with the highest relative impact is land use change, mainly land conversion for cultivation, livestock raising, and plantations.” This report distills the major findings of the IPBES (2019) Global Assessment Report on Biodiversity and Ecosystem Services.]
Bajželj, B., et al., (2014). Importance of food-demand management for climate mitigation. Nature Climate Change, 4(10), 924-929, Abstract. [“However, agriculture is the main driver of losses of biodiversity…”]
Rockström, J., et al., (2025). The EAT–Lancet Commission on healthy, sustainable, and just food systems. The Lancet, 406(10512), 1625-1700. p. 1643. [“Agricultural systems, particularly extensive monocultures, are the single largest drivers of both biosphere and ecosystem functional integrity loss…”]
Cox, N., et al., (2022). A global reptile assessment highlights shared conservation needs of tetrapods. Nature, 605(7909), 285-290, p. 288. [“For all tetrapod groups, agriculture threatens the most species…”]
Sánchez-Bayo, F., & Wyckhuys, K. A. G. (2019). Worldwide decline of the entomofauna: A review of its drivers. Biological Conservation, 232, 8–27, p. 8. [“Habitat change and pollution are the main drivers of such (insect) declines. In particular, the intensification of agriculture over the past six decades stands as the root cause of the problem…”]
About 43% of the ice- and desert-free land in the world is devoted to agriculture.[1,2]
Poore, J. & Nemecek, T. (2018). Reducing food’s environmental impacts through producers and consumers. Science, 360(6392), 987-992, p. 1. [“Today’s agricultural system is also incredibly resource intensive, covering ~43% of the world’s ice- and desert-free land.” This report estimates ice- and desert-free land at 11,250 million hectares (p. 36 of Supplement, based on Ellis et al. (2010) Anthropogenic transformation of the biomes, 1700 to 2000)]
FAOSTAT, Land, Inputs and Sustainability, Land, Land Use, Agriculture, 2022. [Estimate of Cropland at 1,573 million hectares and permanent meadows and pastures at 3,208M = 4,781 / 11,250 = 42.5%. (Estimate of 11,250 for ice-and desert-free land using Ellis estimate (as above) as well as IPCC report, Masson-Delmotte, et al., (2019). Climate change and land. See Table 1.1, p. 85, which calculates total ice-free land area at 13.0 million hectares less 12% “barren land” = 11,440 which would then = 41.8%.]
Agricultural land makes up ~56% of the land area of the contiguous 48 states. Crops take up 20% of the land and grazing accounts for about 35%.[1,2]
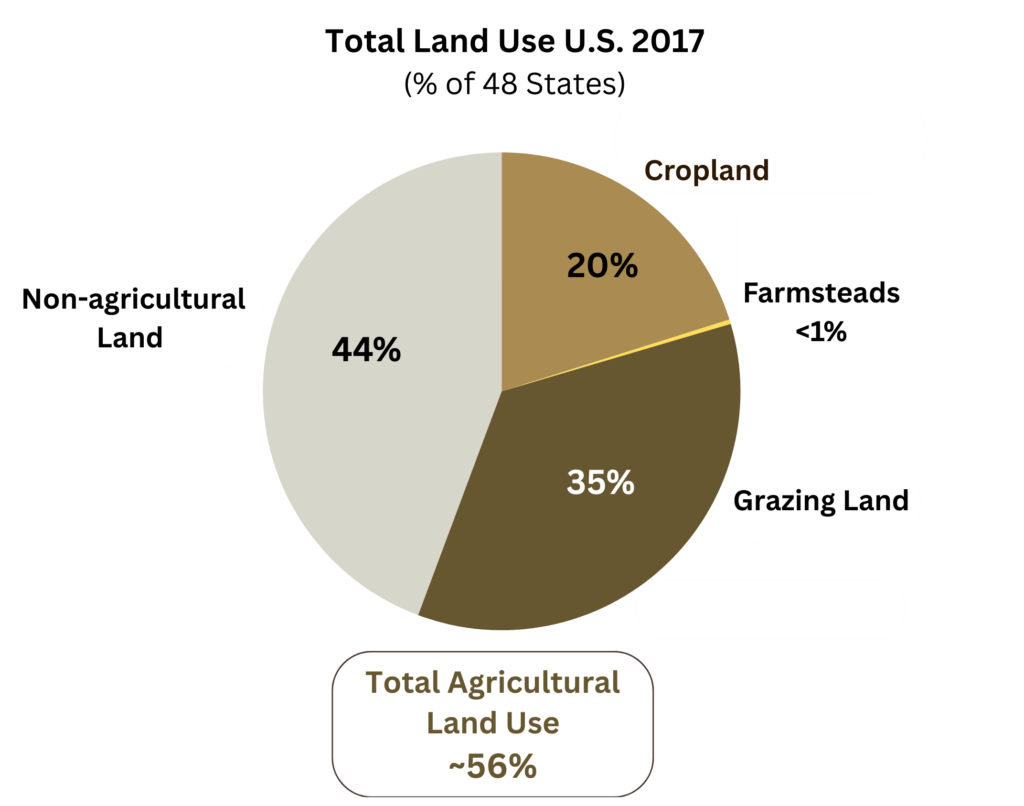
Winters-Michaud, C., et al., (2024) Major Uses of Land in the United States, 2017, USDA ERS Bulletin No. 275, Table 1, p. 5. [Total contiguous (48 states) U.S. land area = 1,891 million acres. Cropland = 377 / 1,891M acres = 19.9%; Grazing land = 671M / 1,891M == 35.5%; Farmsteads and farm roads = 6M / 1891 = .3%; total = 1,054 / 1,891 = ~56%]
For more details, see, Land Use for Agriculture
Of the total land area of the contiguous 48 states, ~45% is used for animal ag. This includes land for grazing livestock, crops going specifically to animal feed, and animal ag farmsteads.[1]
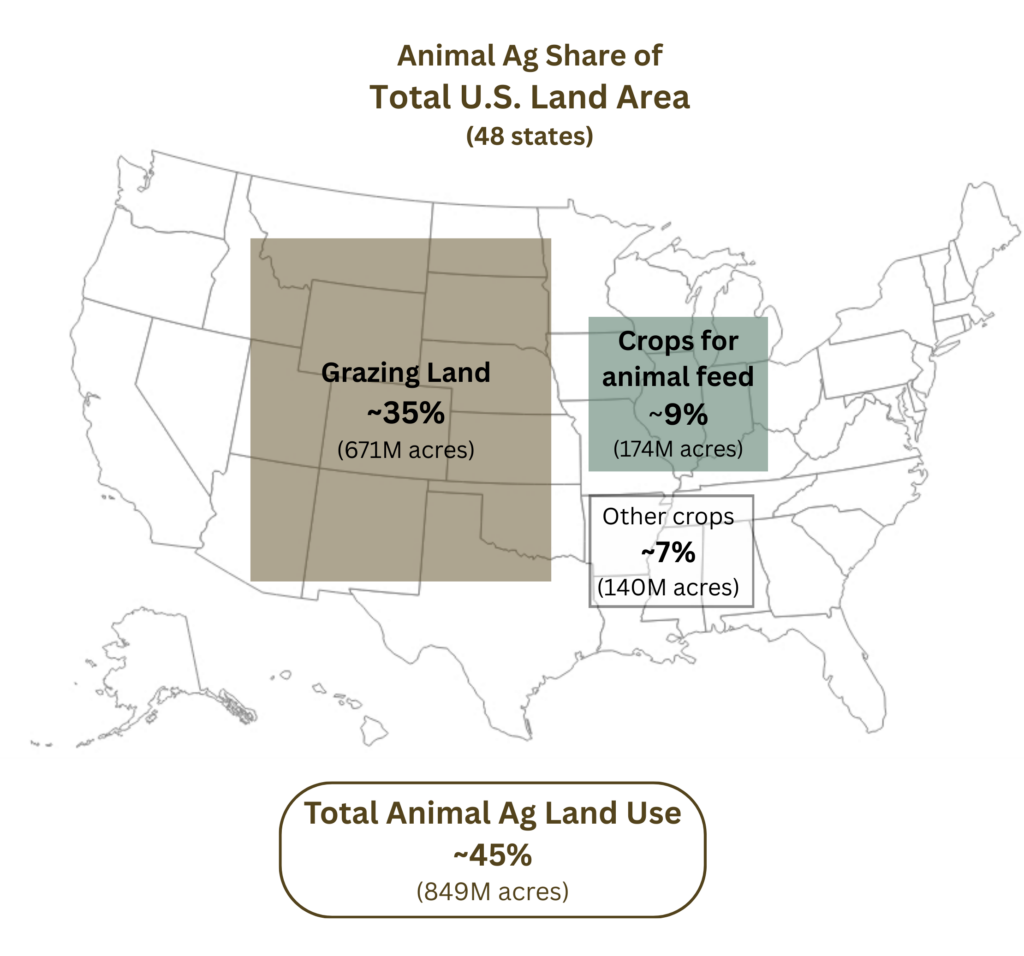
See, Land Use for Animal Ag for references and calculations.
Yes, undoubtedly. Agriculture is the major driver of habitat loss. Of U.S. agricultural land, about 81% is used for animal agriculture – either for crops going specifically to animal feed or for grazing livestock.[1]
Calculation based on Winters-Michaud, C., et al., (2024) Major Uses of Land in the United States, 2017, USDA ERS Bulletin No. 275, Table 1, p. 5. [Total contiguous (48 states) U.S. agricultural land area = 1,054 million acres. Cropland = 377M acres, grazing land = 671M, farmsteads and farm roads = 6M acres. Animal ag acreage = 671M acres for grazing, 174M acres specifically for animal feed, and 4.5M acres for animal ag farmsteads. 671 + 174 + 4.5 = 849 / 1054 == ~81%. See, Land Use for Animal Ag for calculations of feed crop acreage at 174M acres and farmstead acreage at 4.5M acres.
The conversion of land to cropland and pasture generally results in a significant reduction in the number of species.[1] Globally, it is estimated that about 80% of threatened bird and mammal species are imperiled by agriculturally driven losses due to habitat loss.[2]
Agricultural uses reduce available natural land area, cause losses of native vegetation and food supplies, and fragment remaining natural habitats into smaller and more isolated areas.[3,4]
Accompanying agricultural land uses are many inputs and practices that drive biodiversity loss both on agricultural land and outside of it, including pollution, water scarcity, and soil erosion.[5]
Ramankutty, N., et. al., (2018). Trends in global agricultural land use: implications for environmental health and food security. Annual review of plant biology, 69(1), 789-815. [“Across biomes and taxonomic groups, conversion to pasture and cropland results in losses of ~20–30% of local species richness.”]
Tilman, D., et al., (2017). Future threats to biodiversity and pathways to their prevention. Nature (London), 546(7656), 73–81, p. 73. [“About 80% of all threatened terrestrial bird and mammal species are imperiled by agriculturally driven habitat loss.”]
Tilman, D., et al., (2017), p. 73. [“Habitat loss and degradation pose the most frequent direct threats to terrestrial mammals and birds by decreasing the size of the area that a species can occupy, and therefore its abundance, and by fragmenting populations and species ranges into small, isolated patches.”]
Haddad, N. M., et al., (2015). Habitat fragmentation and its lasting impact on Earth’s ecosystems. Science Advances, 1(2), e1500052–e1500052, p. 7. [“A synthesis of fragmentation experiments spanning multiple biomes and scales, five continents, and 35 years demonstrates that habitat fragmentation reduces biodiversity by 13 to 75% and impairs key ecosystem functions by decreasing biomass and altering nutrient cycles.”]
See other pages in this section about biodiversity loss due to fertilizers, pesticides, and water use, along with Land Degradation & Animal Ag.
Monoculture feed crops are the antithesis of biodiverse ecosystems. Tens of millions of acres of monoculture corn and soybeans have replaced grasslands which are “among the most species rich habitats on Earth and may even dwarf tropical rainforests in terms of species diversity.”[1]
The USGS refers to the nation’s temperate grasslands as “the world’s most imperiled ecosystem.”[2] Even a generation ago, the biodiversity of North American grasslands was already viewed as “the most altered by human impact of any of the continent’s terrestrial ecosystems.”[3]
Corn and soybeans are the two largest U.S. crops, both mostly used for factory farm feed. They are planted on more than 170 million acres each year, most of it originally grasslands.[4] Almost two-thirds of corn and soybean production is on farms growing more than 500 acres of a single monoculture crop.[5]
Petermann, J. S. & Buzhdygan, O. Y., (2021). Grassland biodiversity. Current Biology, 31(19), R1195-R1201, p. R1196-R1197.
SGS (April 25, 2023) Uncertainties: global change – The loss of the North American grassland biome, Water Resources Mission Area. [“Once spanning more than 2 million square kilometers, we have lost over half of the world’s most imperiled ecosystem: the temperate grasslands.”]
Conner, R., et al., (2001). United States grasslands and related resources: an economic and biological trends assessment. Texas A&M University, Institute of Renewable Natural Resources.
USDA NASS (2025) Crop Production 2024 Summary, ISSN: 1057-7823, p. 9 and p. 50. [Planted acres for years 2022-2024]
USDA (2024) 2022 Census of Agriculture [Table 35, p.25 (corn) and p. 27 (soybeans)]
More than 60% of all U.S. grasslands has been lost.[1] The “tallgrass prairie” – the most fertile and temperate area – has been almost completely transformed into cropland or pasture, with the loss estimated at ~90%.[2-4]
Once grasslands are cleared for crops, they will not recover for centuries.[5]
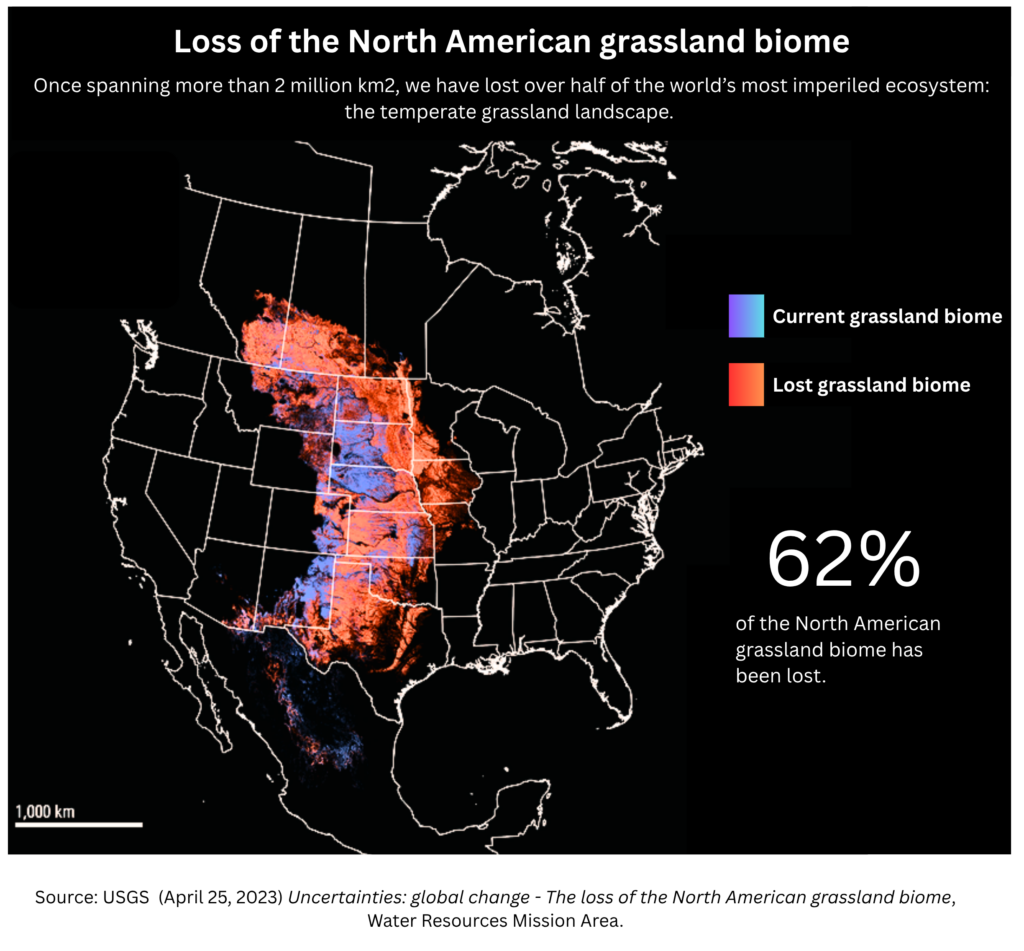
USGS (April 25, 2023) Uncertainties: global change – The loss of the North American grassland biome, Water Resources Mission Area. [USGS source is Comer et al., (2019) below]
Comer, P. J., et al., (2018). Continent-scale landscape conservation design for temperate grasslands of the Great Plains and Chihuahuan Desert. Natural areas journal, 38(2), 196-211, Table 1, p. 199.
Wilsey, C.B., et al., (2019) North American Grasslands. National Audubon Society, New York, NY, p. iv. [“Our analysis confirmed this peril: only 11% of the tallgrass prairie, 24% of the mixed grass prairie, and 54% of the shortgrass prairie that once covered much of the continent remains.”]
Wright, C. K. & Wimberly, M. C. (2013). Recent land use change in the Western Corn Belt threatens grasslands and wetlands. PNAS, 110(10), 4134–4139, p. 4138. [“In the Corn Belt, nearly all tallgrass prairie has been converted to agricultural land uses, whereas conversion of mixed-grass prairie exceeds 70%.”]
Isbell, F., et al., (2019). Deficits of biodiversity and productivity linger a century after agricultural abandonment. Nature Ecology & Evolution, 3(11), 1533-1538, p. 1533. [“We find that local grassland plant diversity increased significantly over time, but incompletely recovered during the century following agricultural abandonment… it would take more than two or seven centuries to recover 80% or 90% of the plant diversity.”]
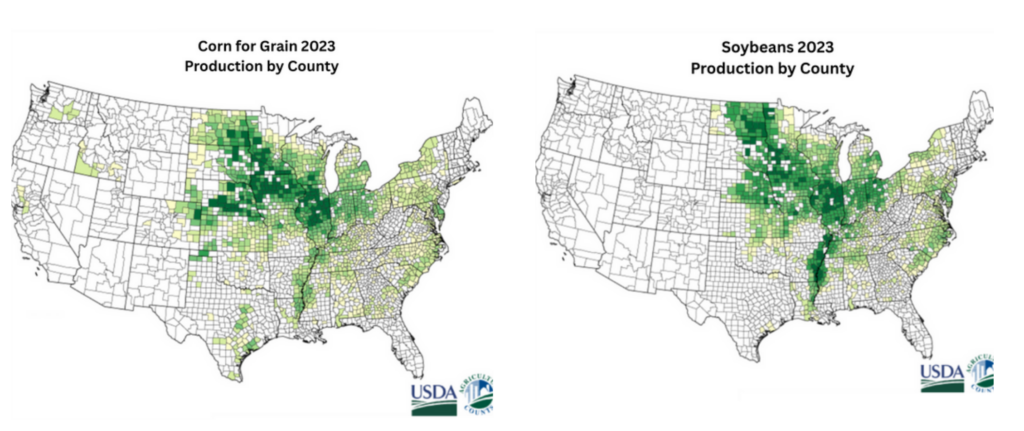
Production of monoculture corn and soybeans are the primary crops grown in areas that were once grasslands, with the highest production in the fertile and temperate tallgrass prairie.[1-3]

Josh Lefers (2022) Grasslands and You – Introducing the Prairies, Audubon Grass Prairies. https://greatplains.audubon.org/news/grasslands-and-you-introducing-prairies. [The tallgrass prairie area receives the most rainfall and the shortgrass area receives the least.]
USDA NASS Charts and Maps – Corn: Production by County for Selected States. [The highlighted green counties represent number of bushels produced, ranging from less than 250,000 to over 8 million (darkest green).]
USDA NASS Charts and Maps – Soybeans: Production by County for Selected States. [The highlighted green counties represent number of bushels produced, ranging from less than 1 million to over 30 million (darkest green).]
Despite the extraordinary biodiversity of grasslands, the status as highly endangered ecosystems, and the immense amounts of carbon held in the soil – the conversion of grassland to feed crops continues.[1,2] According to one study, grasslands are the primary source of land (constituting 88%) converted to new cropland.[3] Corn and soybeans are regularly listed as the top crops planted.[4,5]
Because most fertile land has already been taken, recently appropriated land tends to be marginal land with limited suitability for growing crops but of enormous value to wildlife.[6-8] Most conversions occur during intermittent periods of higher pricing for commodity crops.[9]
Lark, T. J., et al., (2020). Cropland expansion in the United States produces marginal yields at high costs to wildlife. Nature Communications, 11(1), 4295–4295, p. 3. [“We find that cropland expansion has continued at a rate of over 1 million acres per year while generating below average yields and supplanting high-quality habitat.”]
World Wildlife Fund (2024) Paradox in the Prairie: Rising appreciation for grasslands fails to halt Great Plains’ swift decline, p. 2. [“In 2022—the year that this report examines—approximately 1.9 million acres of grasslands were converted to croplands across the US and Canadian portions of the Great Plains region.”]
Lark, T. J., et al., (2020), p. 3.
Lark, T. J., et al., (2020), p. 3. [“Corn was the predominant crop planted on newly cultivated land; it was most common in all years except 2014–15, when soybeans were more prevalent.”]
Wright, C. K. & Wimberly, M. C. (2013). Recent land use change in the Western Corn Belt threatens grasslands and wetlands. PNAS, 110(10), 4134–4139, p. 4138. [“Our results show that rates of grassland conversion to corn/soy (1.0–5.4% annually) across a significant portion of the US Western Corn Belt are comparable to deforestation rates in Brazil, Malaysia, and Indonesia…”]
Lark, T. J., et al., (2015). Cropland expansion outpaces agricultural and biofuel policies in the United States. Environ. Res. Lett. 10:044003, p. 7. [“New expansion occurred most frequently on marginal land that had severe to very severe limitations to cultivation…”]
Wright, C. K. & Wimberly, M. C. (2013), p. 4138. [With respect to agronomic attributes of lands undergoing grassland conversion, corn/soy production is expanding onto marginal lands characterized by high erosion risk and vulnerability to drought.”]
Lark, T. J., et al., (2020). Cropland expansion in the United States produces marginal yields at high costs to wildlife. Nature Communications, 11(1), 4295–4295.
Lark, T. J. (2020). Protecting our prairies: Research and policy actions for conserving America’s grasslands. Land Use Policy, 97, 104727, p. 1. [“When crop prices are high, conversion rates are amplified as returns on cropland increasingly outweigh the costs and risks associated with plowing new land.”]
Grassland species are unusually diverse.[1] A wide range of species are negatively affected by the expansion of monoculture feed crops, including grasses and other plant life, soil organisms, insects, bees, birds, and mammals.[2,3] Birds and bees are probably the most well-studied groups.
Birds – Grassland birds are some of the most threatened species in the U.S. In addition to the loss of natural habitats, reduced food supplies and habitat fragmentation are responsible for significant population declines.[4-7]
Bees – Wild bee abundance is decreasing sharply in areas of corn and soybean monoculture in grassland states.[8] And while corn and soybean crops offer honeybees a short-term feast, they “cannot sustain the long-term nutritional health of colonies.”[9]
Petermann, J. S. & Buzhdygan, O. Y. (2021). Grassland biodiversity. Current Biology, 31(19), R1195-R1201, p. R1196. [“Grasslands are among the most species rich habitats on Earth and may even dwarf tropical rainforests in terms of species diversity.”]
Comer, P. J., et al., (2018). Continent-scale landscape conservation design for temperate grasslands of the Great Plains and Chihuahuan Desert. Natural areas journal, 38(2), 196-211. [“Wildlife has paid a steep price for this agricultural output. Grassland birds have seen sharp declines with increasingly fragmented and converted habitat, as have many other grassland-dependent plants and animals.”]
Petermann, J. S. & Buzhdygan, O. Y. (2021), p. R1196. [“Many of these species — plants as well as other organisms such as insects — are grassland specialists and many are endemic to certain regions or grassland types and are thus often rare or endangered.”]
Rosenberg, K.V., et al., (2019). Decline of the North American avifauna. Science, 10, 1126, p. 2. [“Across breeding biomes, grassland birds showed the largest magnitude of total population loss since 1970—more than 700 million breeding individuals across 31 species— and the largest proportional loss (53%); 74% of grassland species are declining.”]
Wilsey, C.B., et. al., (2019) North American Grasslands and Birds Report. National Audubon Society, New York, NY, p. 4. [“Given these habitat conversion rates, it is not surprising that grassland birds are among the most vulnerable in North America. Total populations have declined more than 40% since 1966, and some species, like the Lesser Prairie-Chicken, hover at the brink of extinction.”]
Stanton, R. L., et al., (2018). Analysis of trends and agricultural drivers of farmland bird declines in North America: A review. Agriculture, Ecosystems & Environment, 254, 244–254, Abstract. [“The most severe declines occurred in aerial insectivorous birds (average change of -39.5% from 1966 to 2013), followed by grassland (-20.8%) and shrubland (-16.5%) bird species.”]
North American Bird Conservation Initiative. (2025). The State of the Birds, United States of America, 2025, p. 6. [“Yet this crucial biome is in collapse—and grassland birds are rapidly disappearing—due to conversion for row-crop agriculture, woody-plant invasion, and drought.”]
Koh, I., et al., (2016). Modeling the status, trends, and impacts of wild bee abundance in the United States. PNAS, 113(1), 140-145, p. 142. [“…areas of intense agriculture (e.g., the Midwest Corn Belt and California’s Central Valley) are among the lowest in predicted wild bee abundance.”]
Dolezal, A. G., et al., (2019). Native habitat mitigates feast–famine conditions faced by honeybees in an agricultural landscape. PNAS, 116(50), 25147–25155, p. 25147.
Grazing on ~670 million acres (35% of the contiguous U.S.) is the single largest use of land in the nation, and undoubtedly one of the largest impacts on ecosystems.[1] Generalizations are challenging given the wide range of biomes (regional climate and vegetation), livestock practices, and animal densities.[2]
While theoretically, cattle can mimic to some degree the evolutionary role of bison, the overall evidence shows that cattle grazing as currently practiced in the U.S. degrades land and contributes to biodiversity loss (per the next question). Impacts are largely dependent on grazing intensity, i.e., number of cattle and length of time grazing in one area.[3-5] “In areas sensitive to disturbance, even minimal grazing can significantly alter the abundance or diversity of taxa within the community.”[6]
Grazing at moderate to heavy levels or on vulnerable lands can influence ecosystems in a variety of ways:[7-11]
Decreasing the abundance and diversity of plant and animal species.
Removing vegetation, thereby reducing food supplies for birds and pollinators and removing cover from predators for small mammals.
Trampling soils and biotic soil crusts (communities of organisms that form a crust-like layer in arid regions) that protect against wind erosion and dust emissions.
Trampling streambanks and aquatic vegetation, crucial for fish and aquatic organism survival.
Increasing pollution from excrement and from sedimentation from trampled banks.
Dispersing invasive species or creating favorable conditions for their establishment.
Thwarting animal movement and migration patterns with livestock fencing.
Winters-Michaud, C., et al., (2024) Major Uses of Land in the United States, 2017, USDA ERS Bulletin No. 275, Table 1, p. 5. [Total continental U.S. land area = 1,891 million acres. Grazing land = 671M / 1,891M == ~35%. We do not include 132M acres of “forest-use” grazing that is not the “primary use” of land.]
Hovick, T. J., et al., (2023) Rangeland Biodiversity, in Rangeland Wildlife Ecology and Conservation, McNew, L. B., et al. (Eds.), p. 217. [“The influence of livestock grazing on wildlife is largely dependent upon the spatial and temporal distribution of the grazer and may also be influenced by livestock type, timing and frequency of grazing, grazing duration, livestock distribution across the landscape, seasonality, stocking rate, and the evolutionary history of grazing at a given site.”]
Schieltz, J. M. & Rubenstein, D. I. (2016). Evidence based review: positive versus negative effects of livestock grazing on wildlife. What do we really know? Environmental Research Letters, 11(11), 113003, p. 2. [“Perhaps the most important factor governing all of these changes is stocking rate, or livestock grazing intensity.”]
Zhou, G., et al., (2017). Grazing intensity significantly affects belowground carbon and nitrogen cycling in grassland ecosystems: a meta-analysis. Glob. Chang. Biol., 23, 1167–1179, p. 1177. [“Using a meta-analysis method, we found that light intensity (grazing) significantly enhanced SCP (soil carbon pools) and SNP (soil nitrogen pools), while moderate and heavy intensity exhibited the opposite trends…”]
Herrero‐Jáuregui, C., & Oesterheld, M. (2018). Effects of grazing intensity on plant richness and diversity: A meta‐analysis. Oikos, 127(6), 757-766. [“However, overall, species richness significantly decreased as stocking rate increased… the most negative responses of richness to stocking rate were larger in arid, low productivity systems than in subhumid and humid systems.]
Filazzola, A., et al., (2020). The effects of livestock grazing on biodiversity are multi‐trophic: a meta‐analysis. Ecology Letters, 23(8), 1298–1309, p. 1299.
Filazzola, A., et al., (2020), p. 1304. [“Across all animals, we found excluding livestock increased animal abundance and diversity that was likely driven by strong effects on trophic levels directly dependent on plants (i.e. herbivores and pollinators).” “We found evidence that livestock exclusion increased the abundance of plants and over time, plant diversity.”]
Kauffman, J. B., et al., (2022). Livestock Use on Public Lands in the Western USA Exacerbates Climate Change: Implications for Climate Change Mitigation and Adaptation. Environmental Management, 69(6), 1137–1152, p. 1139. [“Regardless of season of use or grazing intensity, domestic livestock generally influence ecosystems in four direct ways: (1) by removing vegetation through grazing; (2) by trampling soils, biotic soil crusts, streambanks and vegetation; (3) by redistributing nutrients via defecation and urination; and (4) by dispersing or creating favorable conditions for the establishment and dominance of exotic organisms, including noxious plant species and pathogens.”]
Beschta, R. L., et al., (2013). Adapting to Climate Change on Western Public Lands: Addressing the Ecological Effects of Domestic, Wild, and Feral Ungulates. Environmental Management, 51(2), 474–491, p. 476-477. [“…extensive reviews of published research generally indicate that livestock have had numerous and widespread negative effects to western ecosystems. Simplified plant communities combine with loss of vegetation mosaics across landscapes to affect pollinators, birds, small mammals, amphibians, wild ungulates, and other native wildlife.”]
Hubbard, R. K., et al., (2004). Water quality and the grazing animal. Journal of Animal Science, 82 E-Suppl, E255–E263, p. E255. [“Grazing animals and pasture production can negatively affect water quality through erosion and sediment transport into surface waters, through nutrients from urine and feces dropped by the animals and fertility practices associated with production of high-quality pasture, and through pathogens from the wastes.”]
Jakes, A. F., et al., (2018). A fence runs through it: A call for greater attention to the influence of fences on wildlife and ecosystems. Biological Conservation, 227, 310-318.
The BLM and USDA provide national assessments that document high levels of compromised grazing lands:
Federal grazing lands (BLM) – The Bureau of Land Management is required to establish standards and assess grazing land health.[1] For the year 2024, the BLM reported that 42% of all BLM rangeland acreage was compromised and could not be rated as “healthy.”[2] About a quarter of all grazing land is federally owned and administered.[3]
Private grazing lands (USDA) – A study conducted by the USDA Natural Resources Conservation Service, found that during 2011 to 2015, ~26% of privately-owned rangeland was compromised and “showed a rating of either moderate, moderate-to-extreme, or extreme-to-total departure from reference conditions for at least one of the three rangeland health attributes. This was a 7.5% increase over the period 2004-2010.”[4] Biotic integrity markers (i.e., biodiversity) were “moderately compromised” or worse on ~23% of the assessed lands.[5]
Private grazing lands (USDA) – In 2022 the USDA issued a review of private grazing lands (2004-2018) outlining “rangeland resource concerns.”[6] According to a USDA recap of those results, the “dominant concerns” were: Noxious and invasive plant species. – 62% (of the total area).
Productivity health and vigor – 44% (i.e., plant volume, quality, and soil cover).
Forage quality and palatability – 37%.
Sheet and rill erosion (20%), gully erosion (17%) and wind erosion (11%).[7]
Private pastureland (USDA) – In a 2022 assessment, common “resource concerns” included an abundance of invasive plants affecting ~50% of acres, soil compaction on ~25% of acres, soil organic matter depletion on ~15% of acres, and soil erosion on ~10%.[8]
According to a long-term global study by the UN’s FAO, grazing is the most common driver of land degradation.[9,10]
Code of Federal Regulations 43 CFR § 4180.
Bureau of Land Management (2025) Public Land Statistics 2024, Vol. 209, Table 2-1, p. 37. [For at least one of the three rangeland health attributes (soil and site stability, hydrologic function, and biotic integrity), 42% of acreage had between a moderate and total “departure from reference conditions.”]
See, Grazing on Federal Lands [question: “How many federal acres are actively grazed?”]
Spaeth, K. E., et al., (2024) Insights from the USDA Grazing Land National Resources Inventory and field studies. Journal of Soil and Water Conservation, p. 38A. [This USDA report analyzes data from the 624 page USDA Natural Resources Conservation Service (NRCS) (2018) National Resources Inventory Rangeland Resource Assessment.]
Spaeth, K. E., et al., (2024), Table 2, p. 39A. [“Biotic integrity: the capacity of the biotic community to support ecological processes within the natural range of variability expected for the site, to resist a loss in the capacity to support these processes, and to recover this capacity when losses do occur. The biotic community includes plants (vascular and nonvascular), animals, insects, and microorganisms occurring both above and below ground.” See National Range and Pasture Handbook below, p.645-C.16.]
USDA NRCS. (2022) National Range and Pasture Handbook, National Resources Conservation Service.
Spaeth, K. E., et al., (2024), p. 39A. [“Productivity, Health and Vigor = Plants do not produce the yields, quality, and soil cover to protect the resource.” See National Range and Pasture Handbook, p. 645-C.2]
USDA Natural Resources Conservation Service (NRCS) (2022) NRI Pastureland Assessment, Resource Concerns on Pastureland, Table 9. [Note that “pastureland” is land where forage plants are introduced, typically using fertilization, weed control, and reseeding, while “rangeland” is generally made up of native grasses without the use of chemicals or fertilizers. (See, USDA National Range and Pasture Handbook (2022) Handbook Number 645 pp. 645-N.28-32)
R. Coppus (2023) The global distribution of human-induced land degradation and areas at risk. SOLAW21 Technical background report. Rome, FAO.[“Grazing is the most common occurring driver of human-induced degradation, followed by accessibility and agricultural expansion.”]
Guilia Conchedda (2025) Human-induced degraded land by country and land cover/land use type. https://zenodo.org/records/15283478 [This dataset is from the Coppus report above. Agricultural degradation (1,038,342,273 hectares) is ~63% of total land degradation (1,651,468,927 hectares). Grazing is responsible for ~34% and cropland degradation is responsible for ~29%.]
