Yes. As noted on this page, U.S. agriculture is the primary source of nutrient pollution. As noted on previous pages, nutrient pollution is the primary driver of the pollution of U.S. waterways.[1,2]
Federal agencies have occasionally stated that agriculture is the primary source of water pollution.[3] Much more often, their reports list agriculture as one of several factors. Because of the failure over several decades to reduce water pollution from agriculture, we believe that most federal agencies hesitate to bring attention to those failures by clearly identifying the key sources.[4]
See, Nutrient Pollution of Waterways
Note: Theoretically, these 2 statements do not directly establish U.S. agriculture as the main source of U.S. water pollution. However, if the statements are true, as we demonstrate here, there is no plausible scenario under which the final conclusion is not accurate. Since nutrient pollution is such a large part of the impacts in waterways, and since most of the EPA’s other indicators (i.e., pesticides, microcystins, enterococci) are also highly impacted by agriculture and, in many cases, by nutrient pollution from agriculture, there is no possible state in which some other source, such as industrial pollutants or human wastewater, is the primary driver of U.S. water pollution.
U.S. Geological Survey (2019) Agricultural Contaminants in Water Resources. https://www.usgs.gov/mission-areas/water-resources/science/agricultural-contaminants (Accessed 01/23/26) [“Agriculture is the leading source of impairments in the Nation’s rivers and lakes. About a half million tons of pesticides, 12 million tons of nitrogen, and 4 million tons of phosphorus fertilizer are applied annually to crops in the continental United States.”]
For further information on the reasons for the failures to limit nutrient pollution from agriculture and especially from factory farming, see, Water Pollution & Animal Ag Overview [question: Why is nutrient pollution from factory farms apparently intractable?]
Probably, but this is a difficult claim for researchers to make, given the regional variations and the complexity of various pollutants and their sources.[1]
Mateo-Sagasta, J., et al., (2018) More people, more food, worse water?: a global review of water pollution from agriculture. Published by the Food and Agriculture Organization of the United Nations Rome, p. 4. [“While human settlements, industries and agriculture are all key sources of water pollution, in many countries, agriculture is the biggest polluter.”]
Globally, it is widely understood that agriculture is the central driver of nutrient pollution, responsible for two-thirds or more.[1-3] Food production is estimated to create more than 75% of eutrophication worldwide.[4]
This is naturally the case given that the vast majority of nitrogen and phosphorus is created for agricultural usage (through mining phosphates or nitrogen fixation). Globally, it is estimated that ~85% of all anthropogenic nitrogen usage is for agriculture along with more than 90% of all phosphorus usage.[5,6]
Kanter, D. R. & Brownlie, W. J. (2019). Joint nitrogen and phosphorus management for sustainable development and climate goals. Environmental Science & Policy, 92, 1-8, p.,2. [“Agriculture is the dominant source of nutrient pollution, as the inefficient management of manure and synthetic fertilizer leads to significant losses of N and P.” See Figure 1. N = 155/232.5 = 66.7%. P = 18/23.8 = 72.6%.]
Li, Y., et al., (2022). Multi-pollutant assessment of river pollution from livestock production worldwide. Water research, 209, 117906, p. 7. [“Cattle, pigs, and chickens are responsible for 74–88% of nutrients and oocysts in rivers in 2010, globally.”]
Kanter D. R., et al., (2022). Science briefs on targets, goals and monitoring In support of the post-2020 global biodiversity framework negotiations. Secretariat of the Convention on Biological Diversity. [“Agriculture is the primary source of nutrient and pesticide pollution.”]
Poore, J. & Nemecek, T. (2018). Reducing food’s environmental impacts through producers and consumers. Science (American Association for the Advancement of Science), 360(6392), 987–992, p. 1. [“Food production creates ~32% of global terrestrial acidification and ~78% of eutrophication.” Food production includes agriculture and other food production industries from inputs to retail.]
Campbell, B. M., et al., (2017). Agriculture production as a major driver of the Earth system exceeding planetary boundaries. Ecology and Society, 22(4), 8, p. 3. [“Agricultures’ share of total global anthropogenic N use has been estimated at 86.1%, and so we use ~85% as the level…” “…as much as 96% of mined P is used for fertilizer production.”]
W. J. Brownlie, et al., (eds.), (2022) Our Phosphorus Future. UK Centre for Ecology & Hydrology, Edinburgh, p. 24. [“Globally, around 85% of phosphates produced for market are processed to make mineral P fertilisers, and 10% are used to make animal feed supplements.”]
Yes. Although most developed nations have reduced their nutrient pollution from point sources including from industry and human wastewater, they have struggled to reduce non-point agricultural sources, which are (by definition) widely dispersed and therefore challenging to reduce without strict regulations.[1-4]
Kleinman, P. J., et al., (2011). Managing agricultural phosphorus for water quality protection: principles for progress. Plant and soil, 349(1), 169-182, p. 170. [“Indeed, in developed countries where significant reductions have been made in point-source P pollution, agricultural nonpoint sources are often the greatest source of P to eutrophic water bodies.”]
Parris, K. (2014). Impact of agriculture on water pollution in OECD countries: recent trends and future prospects. Water Quality Management, 33-52, p. 34-36. [For OECD countries, “With point sources of water pollution (i.e. industrial and urban sources) falling more rapidly than for agriculture over the 1990s and effectively controlled in most situations, the share of agriculture (i.e. nonpoint source of pollution) in nutrient pollution of water has been rising, both in surface and coastal waters.”]
Mateo-Sagasta, J., et al., (2018) More people, more food, worse water?: a global review of water pollution from agriculture. Published by the Food and Agriculture Organization of the United Nations Rome, p. 4. [“Industrial agriculture is among the leading causes of water pollution, especially in most high-income countries and many emerging economies, where it has overtaken contamination from settlements and industries as the major factor in the degradation of inland and coastal waters (e.g. eutrophication).”]
Oates, C., et al., (2024). Effective nutrient management of surface waters in the United States requires expanded water quality monitoring in agriculturally intensive areas. ACS Environmental Au, 5(1), 1-11, Abstract. [“The U.S. Clean Water Act is believed to have driven widespread decreases in pollutants from point sources and developed areas, but has not substantially affected nutrient pollution from agriculture.”]
Yes, without question.[1-6] The sources are chemical fertilizers, manure, and crop fixation of nitrogen.
Brehob, M. M., et al., (2025). The US EPA’s National Nutrient Inventory: Critical Shifts in US Nutrient Pollution Sources from 1987 to 2017. Environmental Science & Technology, p. A. [“As an example, agriculture is generally the largest contributor to nutrient pollution in the United States.”]
Sabo, R. D., et al., (2021). Considerations when using nutrient inventories to prioritize water quality improvement efforts across the US. Environmental research communications, 3(4), 045005, p. 6. [“Most of the surplus N and P degrading water quality is from unutilized fertilizer and manure nutrients left on cropland and pasture.”]
Ribaudo, M., et al., (2011). Nitrogen in agricultural systems: Implications for conservation policy. USDA-ERS, Report 127, p. 2. [“Agriculture is the predominant source of reactive nitrogen emissions into the environment.”]
Alexander, R. B., et al., (2008). Differences in phosphorus and nitrogen delivery to the Gulf of Mexico from the Mississippi River Basin. Environmental science & technology, 42(3), 822-830, p. 822. [“Our model simulations indicate that agricultural sources in the watersheds contribute more than 70% of the delivered N and P.”]
Falcone, J.A., (2021). Estimates of county-level nitrogen and phosphorus from fertilizer and manure from 1950 through 2017 in the conterminous United States: U.S. Geological Survey Open-File Report 2020–1153, 20, p. 1. [“The input of nutrients to the environment comes in large part from the (a) use of commercial fertilizer, primarily for agricultural purposes, and the (b) use of manure from livestock.”]
Del Rossi, G., et al., (2023). The economics of nutrient pollution from agriculture. Annual Review of Resource Economics, 15(1), 105-130, p. 106. [“Agriculture is the largest source of N pollution in the United States.”]
Broadly estimated, about 75% of anthropogenic nitrogen inputs come from agricultural sources.[1-3]
More than 90% of phosphorus inputs come from agricultural sources.[4-6]
Brehob, M. M., et al., (2025). The US EPA’s National Nutrient Inventory: Critical Shifts in US Nutrient Pollution Sources from 1987 to 2017. Environmental Science & Technology, p. E, Figure 2. [“From 2007 to 2017, agricultural inputs made up 66% of total N inputs and 91% of total P inputs, on average.” To calculate total anthropogenic nitrogen inputs: Total nitrogen inputs = 38.75 Tg less 5.87 natural sources = 32.88. All ag sources = 25.73 Tg N. Therefore 25.73/ 32.88 = 78.3% anthropogenic N from agriculture.]
Davidson, E. A., et al., (2012). Excess nitrogen in the US environment: trends, risks, and solutions. Issues in ecology, (15), Table 1. [For 2008 — 19.7 MMT N/ 28.8 MMT N = 69% of anthropogenic N is agricultural, not including manure or atmospheric deposition.]
Sobota, D. J., et al., (2013). Reactive nitrogen inputs to US lands and waterways: how certain are we about sources and fluxes? Frontiers in Ecology and the Environment, 11(2), 82-90, Table 2. [18.6 MMT N/ 26.9 MMT= 69% agricultural, considering only “new human-mediated N inputs” and therefore not including manure. Also some share of atmospheric deposition is of agricultural source.]
Brehob, M. M., et al., (2025), p. E. [“From 2007 to 2017, agricultural inputs made up… 91% of total P inputs, on average.”]
Keiser, D. A. (2020). Policy Brief—The Effectiveness of Phosphate Bans in the United States. Review of Environmental Economics and Policy, p. 337. [“…agriculture continues to account for more than 95 percent of total phosphate use in the United States.”]
W. J. Brownlie, et al., (2022) Our Phosphorus Future. UK Centre for Ecology & Hydrology, Edinburgh, p. 24. [“Globally, around 85% of phosphates produced for market are processed to make mineral P fertilisers, and 10% are used to make animal feed supplements.” The remaining 5% is used in detergents, cleaning products, and other industrial uses.]
Broadly estimated, 70-75% of U.S. nutrient pollution comes from agriculture.[1-8]
We use 67% as agriculture’s contribution of N, and 80% as agriculture’s contribution of P.[9]
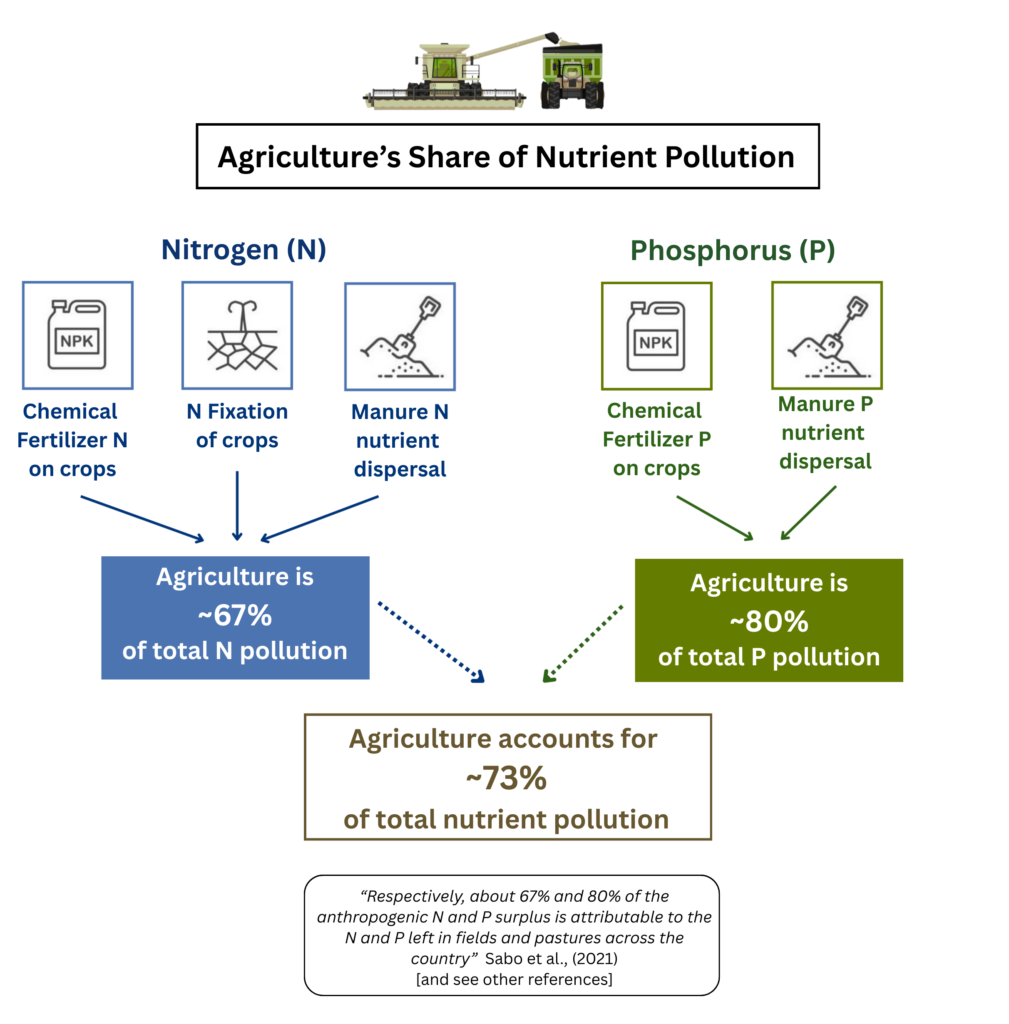
Sabo, R. D., et al., (2021). Considerations when using nutrient inventories to prioritize water quality improvement efforts across the US. Environmental research communications, 3(4), 045005, pp. 5-7. [“Recent regional application of spatially-referenced regression models across the CONUS have also inferred the disproportionate influence agricultural production has on downstream water quality with agricultural land use, fertilizer, cultivated biological N fixation, and/or manure excretion consistently being the top and some of most influential explanatory variables of anthropogenic nutrient loads for all regional models. Inference from the latter studies and this one is consistent with past studies… Respectively, about 67% and 80% of the anthropogenic N and P surplus is attributable to the N and P left in fields and pastures across the country with the remainder being attributed to NOx deposition on non-agricultural land, lawn fertilizer application, and human food and nonfood demand. Similar proportions have been observed in other national inventories or inferred from Sparrow models.” 67% + 80% / 2 = 73.5%]
Brehob, M. M., et al., (2025). The US EPA’s National Nutrient Inventory: Critical Shifts in US Nutrient Pollution Sources from 1987 to 2017. Environmental Science & Technology. [See Figure 2. For P, ag inputs of 3.61 Tg less crop removal of 1.99 = 1.62 surplus / total terrestrial surplus of 1.98 = 81.8%. For N, the calculation is less clear due to natural inputs, different types of emissions, atmospheric deposition (including agriculture’s contributions) and different types of nitrogen surplus (hydrologic and non-hydrologic.)]
Robertson, D. M., & Saad, D. A. (2021). Nitrogen and phosphorus sources and delivery from the Mississippi/Atchafalaya River basin: An update using 2012 SPARROW models. JAWRA Journal of the American Water Resources Association, 57(3), 406-429, figure 5, p. 418. [In a large USGS study of the Mississippi River basin (covering all or parts of 31 states), agricultural sources of nitrogen pollution contributed, “73.2% of the N (25.9% — fertilizers, 28.9% — manure, and 18.4% — fixation)…”]
Robertson, D. M., & Saad, D. A. (2021), figure 5. [For phosphorus: “For the entire MARB, agriculture was the dominant general source contributing 56.0% of the P (37.8% – fertilizers; 18.2% – manure)…” Since 22.7% of the total is from “natural sources” we adjust these figures to focus on anthropogenic sources. 37.8/77.3 = 48.9% from fertilizers. 18.2/77.3 = 23.5% from manure. Therefore, 48.9% + 23.5% = 72.4%]
Kanter, D. R. & Brownlie, W. J. (2019). Joint nitrogen and phosphorus management for sustainable development and climate goals. Environmental Science & Policy, 92, 1-8, p.2. [For further confirmation, we consider global estimates here (and in the following footnote): “Agriculture is the dominant source of nutrient pollution, as the inefficient management of manure and synthetic fertilizer leads to significant losses of N and P.” See Figure 1. Anthropogenic N losses = 155/232.5 = 66.7%. Anthropogenic P losses = 18.9 (agriculture + fertilizer production) / 24.8 total = 76.2%. Agricultural contributions tend to be higher shares in developed nations, as noted above.]
Li, Y., et al., (2022). Multi-pollutant assessment of river pollution from livestock production worldwide. Water research, 209, 117906, p. 7. [“Cattle, pigs, and chickens are responsible for 74–88% of nutrients and oocysts in rivers in 2010, globally.”]
Calculation: Considering all these reports as general confirmation, we finally use the figures from EPA scientists Sabo et al., (2021) at 67% N and 80% P, averaged at 73.5%. Each of the researchers from Sabo are included in the Brehob (2025) report, which confirms a slightly higher share for P (82%). For calculations based on this figure (derived animal ag contributions) we use a final figure of 73% of nutrient pollution (N and P averaged) attributable to agriculture.
Note: we weight N and P the same based on our understanding that both are critical components of nutrient pollution, with P probably more impactful in inland water pollution. See for example, Jarvie, H. P., et al., (2013). Phosphorus mitigation to control river eutrophication: murky waters, inconvenient truths, and “postnormal” science. Journal of environmental quality, 42(2), 295-304, p. 295. [“For watershed management, P is regarded as the primary limiting nutrient for nuisance algal growth in fresh waters, and over the last 40 years, mitigating P inputs from wastewater (point) and agricultural (nonpoint) sources has been adopted as the main watershed management tool to control freshwater eutrophication.”] And see, Schindler, D. W., et al., (2008). Eutrophication of lakes cannot be controlled by reducing nitrogen input: results of a 37-year whole-ecosystem experiment. PNAS, 105(32), 11254-11258. [“To reduce eutrophication, the focus of management must be on decreasing inputs of phosphorus.” Abstract] Note that nitrogen is considered more damaging to coastal zones. See for example, Howarth, R. W., et al., (2002). Sources of nutrient pollution to coastal waters in the United States: Implications for achieving coastal water quality goals. Estuaries, 25(4), 656-676. [“…although for most coastal systems N additions cause more damage.” Abstract]
Sabo, R. D., et al., (2021), p. 6. [“Respectively, about 67% and 80% of the anthropogenic N and P surplus is attributable to the N and P left in fields and pastures across the country.” We use these figures based on the experience of these EPA researchers, and the support of all the other references noted above.]