The EPA generates reports approximately every five years, separately assessing each of 4 categories of waterways. Known as the National Aquatic Resource Surveys (NARS), they cover:
![]() Lakes – published 2024 covering 2022.[1]
Lakes – published 2024 covering 2022.[1]![]() Wetlands – published 2024 covering 2021.[2]
Wetlands – published 2024 covering 2021.[2]![]() Rivers & Streams – published 2023 covering 2018-2019.[3]
Rivers & Streams – published 2023 covering 2018-2019.[3]![]() Coastal Zones including Estuaries and Great Lakes “near-shore” areas – published 2021 covering 2015.[4]
Coastal Zones including Estuaries and Great Lakes “near-shore” areas – published 2021 covering 2015.[4]
Additionally, every five years the EPA publishes the National Water Quality Inventory: Report to Congress which integrates the most recent reports. The latest report to Congress was published in October 2024.[5]
U.S. EPA (2024) National Lakes Assessment: The fourth collaborative survey of lakes in the United States, 841-R-24-006. https://nationallakesassessment.epa.gov/webreport (Accessed 2/18/25)
U.S. EPA (2024) National Wetland Condition Assessment: The third collaborative survey of wetlands in the United States, 843-R-24-001. https://wetlandassessment.epa.gov/webreport (Accessed 3/2/25)
U.S. EPA (2023) National Rivers and Streams Assessment: The Third Collaborative Survey, 841-R-22-004. https://riverstreamassessment.epa.gov/webreport (Accessed 3/2/25)
U.S. EPA (2021) National Coastal Condition Assessment: A Collaborative Survey of the Nation’s Estuaries and Great Lakes Nearshore Waters, 841-R-21-001
https://www.epa.gov/national-aquatic-resource-surveys/national-coastal-condition-assessment-2015-results (Accessed 3/2/25)EPA (2024). National Water Quality Inventory: Report to Congress, 841-R-23-001.
![]() Few generalizations pertain to all 4 studied waterway categories.
Few generalizations pertain to all 4 studied waterway categories.![]() Within water categories, the EPA uses many different “indicators” – evaluations of a specific metric regarding water quality. Rivers and streams, for example, are graded for 16 indicators.[1]
Within water categories, the EPA uses many different “indicators” – evaluations of a specific metric regarding water quality. Rivers and streams, for example, are graded for 16 indicators.[1]![]() There is no single assessment that aggregates all indicators.
There is no single assessment that aggregates all indicators.![]() The EPA tends to downplay long-term comparisons of data.
The EPA tends to downplay long-term comparisons of data.![]() The reports say very little about the causes of poor conditions.[2]
The reports say very little about the causes of poor conditions.[2]
For these reasons, journalists and researchers looking for “overview” statements from government reports or websites may not find much. We surmise that due to the long-term inability to address the failing health grades for U.S. waterways, government agencies are hesitant to provide quotes that highlight those shortcomings.[3]
U.S. EPA (2023) National Rivers and Streams Assessment: The Third Collaborative Survey, 841-R-22-004. [“EPA used 16 indicators to assess the biological, chemical, and physical condition of rivers and streams, as well as characteristics that pose risks to human health.”]
U.S. EPA (2024) National Lakes Assessment: The Fourth Collaborative Survey of Lakes in the United States, 841-R-24-006. [“While this report explores associations between stressors and biological indicators of condition, additional research is needed to explain the causes of degraded conditions or to identify sources of stressors.”]
Because states are required to assess waterways as “impaired” or not, some reports have aggregated state results in order to offer an overview of the total share of impaired waterways. However, states have widely varying assessment tools and characterizations that do not generally support a nationwide assessment. See, EPA (2024). National Water Quality Inventory: Report to Congress. [“While the state water quality reports were, and continue to be, valuable for the individual states, numerous independent and internal reviews found the differences in methods across states prevented valid national level reporting.”]
We propose the following:
![]() Less than half of U.S. freshwater bodies are in good biological condition, i.e., have healthy biological communities. This includes rivers, streams, lakes, wetlands, and Great Lakes near-shore waters.[1-4]
Less than half of U.S. freshwater bodies are in good biological condition, i.e., have healthy biological communities. This includes rivers, streams, lakes, wetlands, and Great Lakes near-shore waters.[1-4]![]() Less than one-third of river and stream miles have healthy biological communities.[5]
Less than one-third of river and stream miles have healthy biological communities.[5]

Biological condition is the “presence, number, and diversity” of life, including fish, invertebrates, and other organisms.[6,7]
The EPA states that “Biological condition is the most comprehensive indicator of water body health: when the biology of a stream is healthy, the chemical and physical components of the stream are also typically in good condition.”[8] Biological condition is used as the key indicator of waterways health throughout the EPA’s assessments of water quality.[9]
EPA (2024). National Water Quality Inventory: Report to Congress, 841-R-16-011, p. 4. [The above chart is based on the EPA chart from page 4, updated with the following 2 reports that came out subsequent to this report.]
U.S. EPA (2024) National Lakes Assessment: The fourth collaborative survey of lakes in the United States, 841-R-24-006. [Good biological condition decreased slightly from 43% to 42%.]
U.S. EPA (2024) National Wetland Condition Assessment: The third collaborative survey of wetlands in the United States, 843-R-24-001. [“The EPA found 45% of wetland area was in good condition.” This is a slight reduction from 47%. About 95% of U.S. wetlands are freshwater. See, Lang, M.W., et al., (2024) Status and Trends of Wetlands in the Conterminous United States 2009 to 2019. U.S. Department of the Interior; Fish and Wildlife Service, Washington.
U.S. EPA (2021) National Coastal Condition Assessment: A Collaborative Survey of the Nation’s Estuaries and Great Lakes Nearshore Waters, 841-R-21-001, p. 16. [For Great Lakes near-shore waters, 31% good condition / 67% assessed = ~46% of assessed areas are in good condition.]
U.S. EPA (2023) National Rivers and Streams Assessment 2018 – 2019 Key Findings. [“Less than one-third of our river and stream miles (28%) had healthy biological communities…” Note that rivers and streams are assessed by miles rather than rating entire rivers and streams.]
U.S. EPA (2023) National Rivers and Streams Assessment: The Third Collaborative Survey, 841-R-22-004. [“The biology of a water body (the biological condition) can be characterized by the presence, number, and diversity of macroinvertebrates, fish, and other organisms.”]
U.S. EPA (2021) National Coastal Condition Assessment, p. 16. [“Good sites (for biological condition) have a wide variety of species, more diversity, and fewer pollution-tolerant species than fair or poor sites.”]
U.S. EPA (2024) National Water Quality Inventory: Report to Congress, p. 10.
See, for example, a) U.S. EPA (2024) National Water Quality Inventory: Report to Congress, pp. 23-24, wherein “attributable risk” is based on biological condition, and b) the “Summary of National Water Quality” at p. 4 and Figure 1, and c) “Biological condition is the most comprehensive indicator of water body health: when the biology of a stream is healthy, the chemical and physical components of the stream are also typically in good condition.” (at p. 10) and d) the prior NWQA: EPA National Water Quality Inventory: Report to Congress, 841-R-16-011, focused on the biological condition of each category of waterway in the “Executive Summary” at p. 2]
Nutrient pollution is a cause of water problems, while biological condition is a result. Biological condition is strongly influenced by nutrient pollution. As noted in the following points, nutrient pollution is the primary driver of water pollution in U.S. waterways.
Nutrient pollution is acknowledged by the EPA as “the most widespread stressor” in the nation’s lakes, rivers and streams, and coastal areas.[1-3]
Even more critically, excess nutrients (nitrogen or phosphorus or both) have the highest “attributable risk” for lakes, rivers and streams.[4-6] Attributable risk is the metric assigned by the EPA to measure the improvements to waterways that could be gained from reducing specific pollutants.[7,8]
U.S. EPA (2024) National Lakes Assessment: The Fourth Collaborative Survey of Lakes in the United States, 841-R-24-006. [For lakes, “Nutrient pollution was the most widespread stressor measured.”]
U.S. EPA (2023) National Rivers and Streams Assessment: The Third Collaborative Survey, 841-R-22-004. [For rivers and streams, “Nutrients (phosphorus and nitrogen) were the most widespread stressors.”]
U.S. EPA (2021) National Coastal Condition Assessment: A Collaborative Survey of the Nation’s Estuaries and Great Lakes Nearshore Waters, 841-R-21-001, p. 53. [For coastal areas, including estuaries and Great Lakes near-shore areas, “Similar to findings from other assessments, the NCCA found that elevated nutrient levels are widespread stressors.”]
U.S. EPA (2024). National water quality inventory: report to Congress. [“Attributable risk analysis for rivers and streams shows that reducing nutrients could result in the greatest benefit to biological condition at the national scale.” at p. 24. For lakes: “Calculating attributable risk, EPA found that reducing phosphorus and nitrogen could result in the greatest benefit to benthic macroinvertebrate condition nationally.” at p. 24. “Biological condition for coastal waters, lakes, rivers, and streams is based on benthic macroinvertebrates.” at p. 21. “Biological condition is the most comprehensive indicator of water body health: when the biology of a stream is healthy, the chemical and physical components of the stream are also typically in good condition.” at p. 10]
U.S. EPA (2023) National Rivers and Streams Assessment: The Third Collaborative Survey. [For rivers and streams, “Attributable risk analysis shows that reducing nutrients could result in the greatest benefit to biological condition at the national scale…” And again, “Biological condition is the most comprehensive indicator of water body health: when the biology of a stream is healthy, the chemical and physical components of the stream are also typically in good condition.” From, EPA (2024). National water quality inventory: report to Congress p. 10]
U.S. EPA (2024) National Lakes Assessment: [For lakes, “EPA found that reducing phosphorus could result in the greatest benefit to benthic macroinvertebrate condition nationally…” And again, “Biological condition for coastal waters, lakes, rivers, and streams is based on benthic macroinvertebrates.” at p. 21.]
National water quality inventory: report to Congress, pp. 23-24. [Attributable risk is “a single value that provides an estimate of the potential improvement that could be achieved by reducing or eliminating the stressor.”]
For additional info see, Nutrient Pollution of Waterways
Nutrient Pollution in Lakes – About half of the nation’s lakes are rated poor for nitrogen and phosphorus levels.
In the 2024 EPA National Lakes Assessment, nutrient pollution is the most widespread stressor measured.
![]() For nitrogen, 47% of lakes are rated in poor condition.
For nitrogen, 47% of lakes are rated in poor condition. ![]() For phosphorus, 50% of lakes are rated in poor condition.[1]
For phosphorus, 50% of lakes are rated in poor condition.[1]
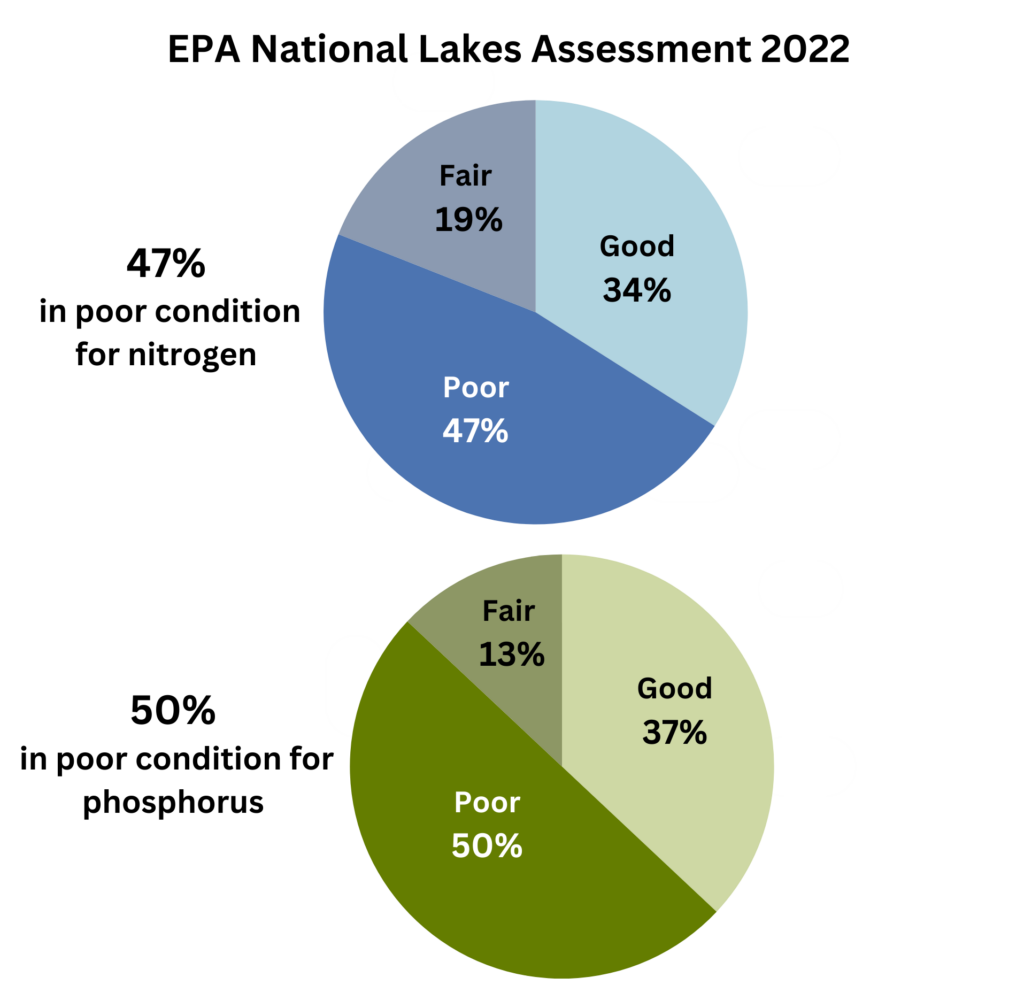
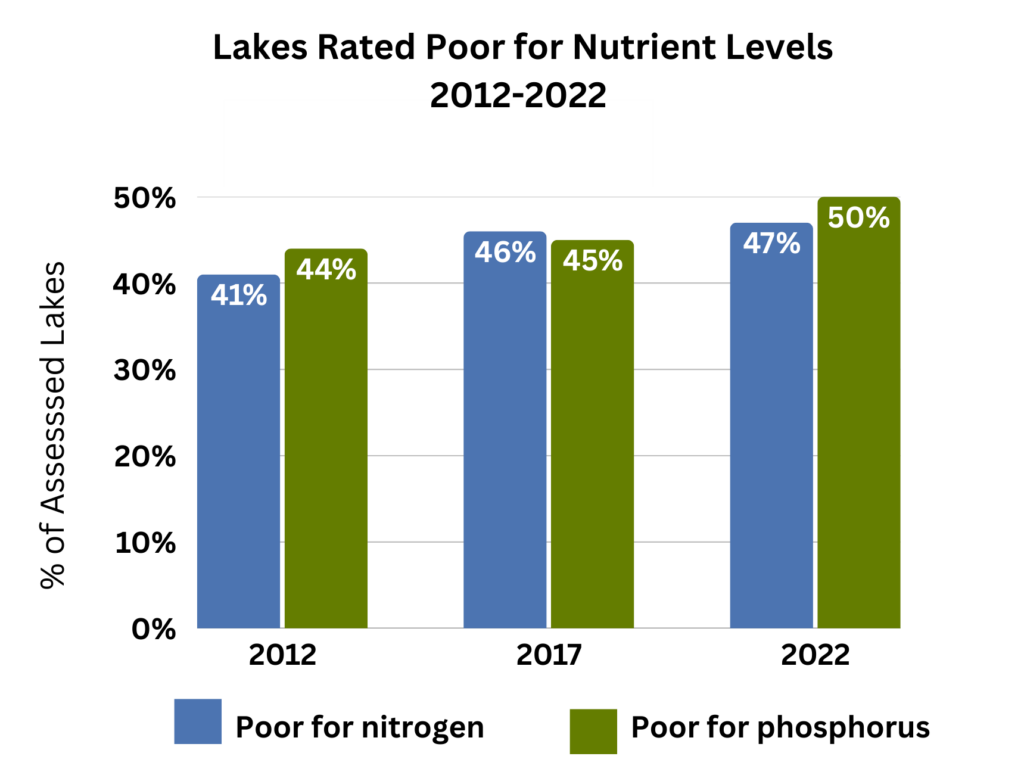
The share of lakes rated poor for nutrient levels has increased from 2012 through 2022.[2]
U.S. EPA (2024) National Lakes Assessment: The Fourth Collaborative Survey of Lakes in the United States, 841-R-24-006. Chemical Indicators/Nutrients, Exhibits 22 & 23.
U.S. EPA (2024) National Lakes Assessment, Chemical Indicators/Nutrients, Exhibits 24 and 25. [2012: Poor for N 41%, Poor for P 44%; 2017: Poor for N 46%, Poor for P 45%; 2022: Poor for N 47%, Poor for P 50%]
Eutrophication in Lakes – Almost three-quarters of the nation’s lakes are eutrophic, with almost a third hypereutrophic.
Reported in the 2024 EPA National Lakes Assessment:
![]() 43% of lakes are rated as eutrophic.
43% of lakes are rated as eutrophic.![]() 30% of lakes are rated as hypereutrophic.
30% of lakes are rated as hypereutrophic.![]() In total, 73% of lakes are eutrophied.[1]
In total, 73% of lakes are eutrophied.[1]
The report defines eutrophic as having “high nutrient levels and high biological productivity” and hypereutrophic as having “extreme primary production (high levels of photosynthesis), reduced biological diversity, and reduced metabolism, which results in an imbalanced lake ecosystem.”
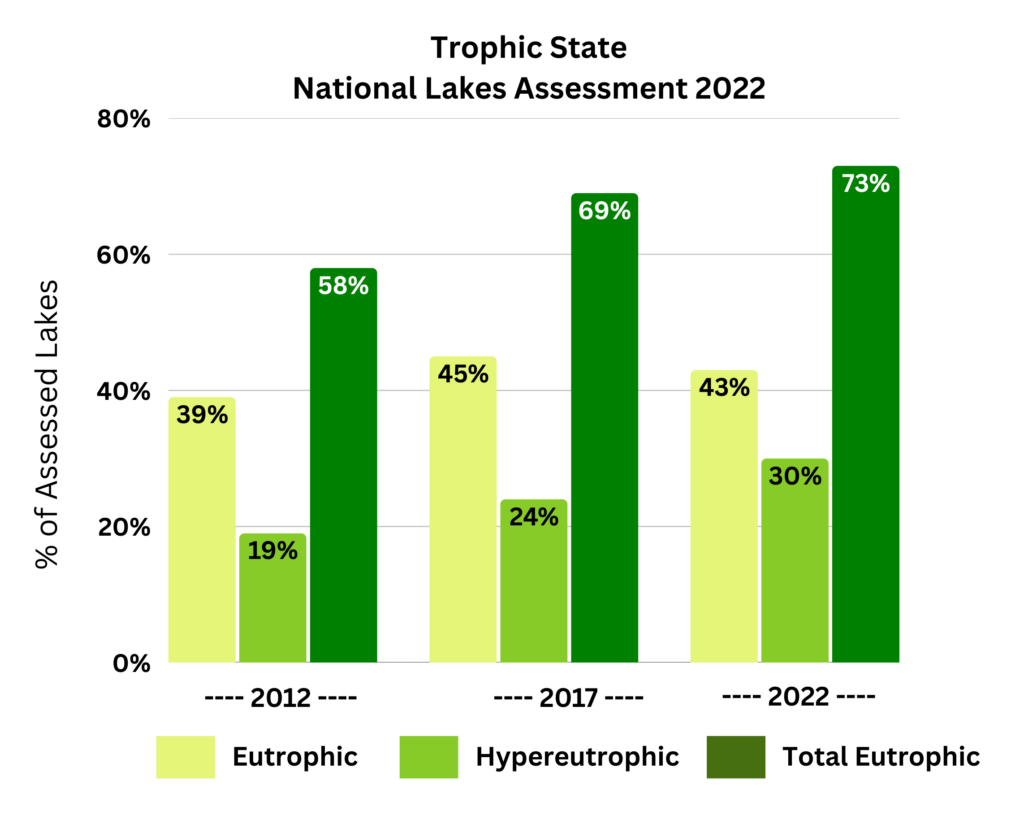
The EPA asserts that “no statistically significant changes occurred from 2017 to 2022.” However, the changes from 2012 to 2022 are clearly significant and point to steadily worsening levels of nutrient pollution in lakes.
U.S. EPA (2024) National Lakes Assessment: The Fourth Collaborative Survey of Lakes in the United States, 841-R-24-006. Trophic State Indicator, Exhibits 8 and 9.
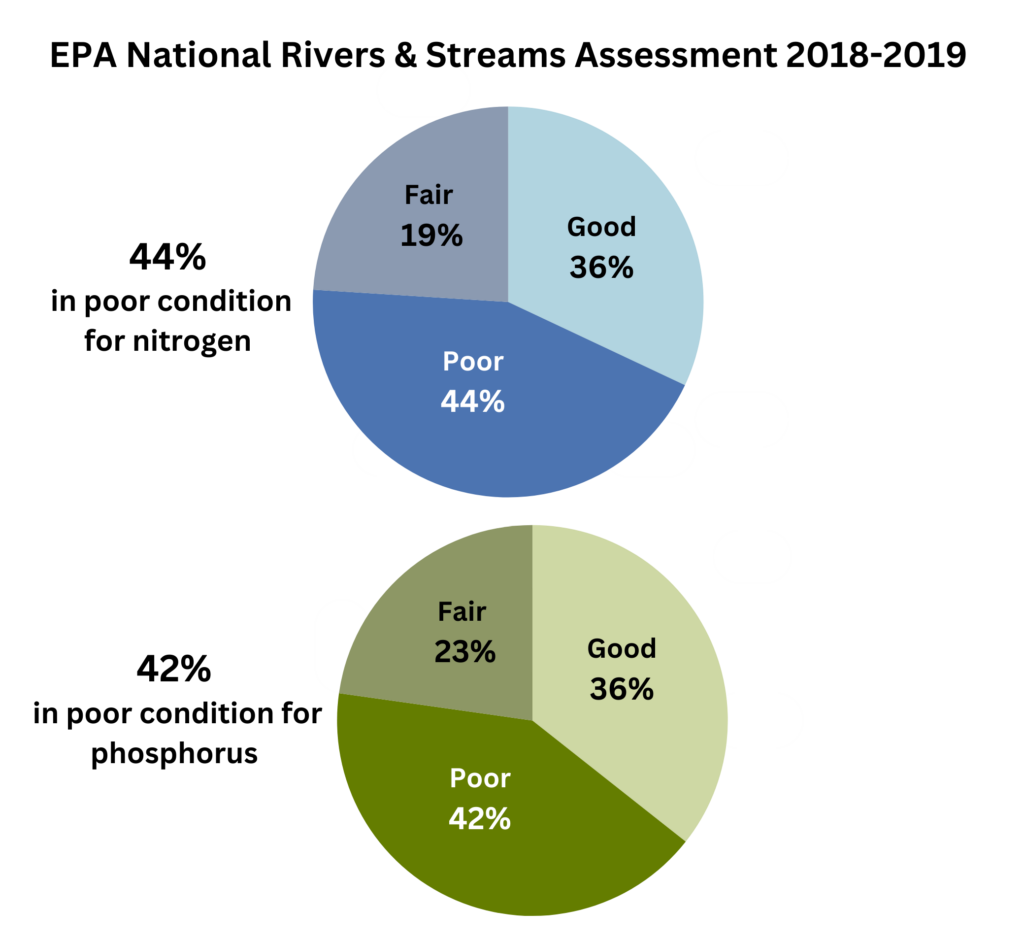
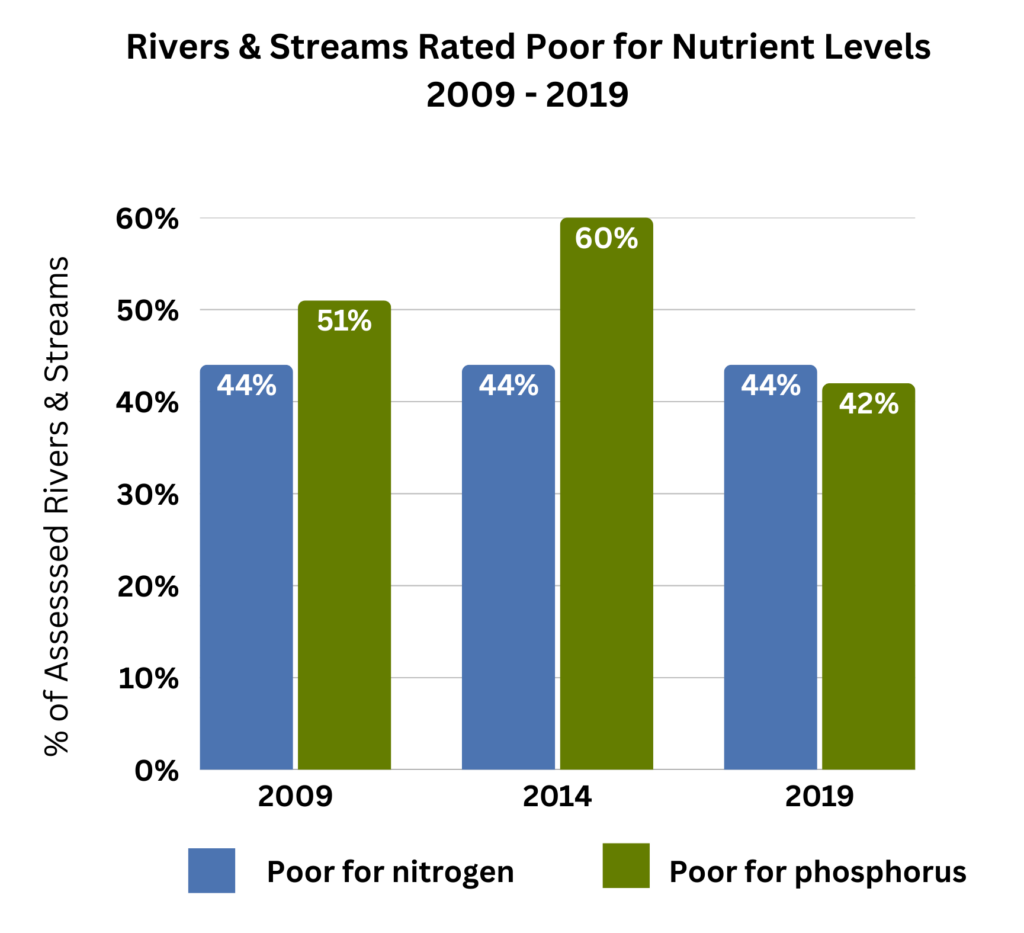
Rivers and Streams – More than 40% of the nation’s rivers and streams are rated poor for nitrogen and phosphorus levels.
The 2023 EPA National Rivers and Streams Assessment reports:![]() 44% of river and stream miles are rated poor for elevated nitrogen
44% of river and stream miles are rated poor for elevated nitrogen![]() 42% of miles are rated poor for elevated phosphorus.[1]
42% of miles are rated poor for elevated phosphorus.[1]
The share of river and stream miles rated poor for nutrient levels over time:[2]
U.S. EPA (2023) National Rivers and Streams Assessment: The Third Collaborative Survey, 841-R-22-004, Exhibits 10 and 11.
U.S. EPA (2023) National Rivers and Streams Assessment, Exhibits 12 and 13. [2009: Poor for N 44%, Poor for P 51%; 2014: Poor for N 44%, Poor for P 60%; 2019: Poor for N 44%, Poor for P 42%]
Wetlands – The EPA’s 2024 National Wetland Condition Assessment reports:
![]() For nitrogen, 28% of assessed wetlands are rated as poor.
For nitrogen, 28% of assessed wetlands are rated as poor.![]() For phosphorus, 40% of assessed wetlands are rated poor.[1]
For phosphorus, 40% of assessed wetlands are rated poor.[1]
Physical alterations are the largest cause of wetland degradation, even larger than nutrient pollution.[2] The largest cause of physical alterations is agricultural expansion, both historically and currently.[3-6]
U.S. EPA (2024) National Wetland Condition Assessment: The Third Collaborative Survey of Wetlands in the United States, 843-R-24-001, Exhibit 21. [Large shares of total wetlands are not assessed due to lack of surface water, making nutrient assessments and year-to-year comparisons somewhat less meaningful. The percentages noted here are calculated as a share of assessed acres.]
U.S. EPA (2024) National Wetland Condition Assessment. [43% of assessed acres are rated poor due to “physical alterations.”]
Dahl, T. E. & Allord, G. J. (1997). History of wetlands in the conterminous United States, US Geological Survey, pp. 19-26. [From the 1950’s through the 1970’s, “Agriculture was responsible for more than 80 percent of these (wetlands) losses.” In the 1600’s there were about 220 million acres of wetlands, while currently there is about half that amount: 116 million acres according to Lang et al., (2024), see, p. 8]
Lang, M.W., et al., (2024). Status and Trends of Wetlands in the Conterminous United States 2009 to 2019. U.S. Department of the Interior; Fish and Wildlife Service, Figure 4, p. 18. [The largest driver of wetland conversion is noted as “upland agriculture.” Probably due to an unwillingness to highlight agriculture as the primary driver, there is no clear explanation of what this term means. As we understand it, this refers to the draining and filling of wetlands to create higher and drier land suitable for agriculture.]
Craig Cox & Soren Rundquist (2013) Going, going, gone! Millions of Acres of Wetlands and Fragile Land Go Under the Plow, Environmental Working Group, p. 5. [“Corn and soybeans were planted on 60 percent (612,000 acres) of the wetland and wetland buffer acres appropriated for row crop production in hotspot counties.”]
Zedler, J. B. (2003). Wetlands at Your Service: Reducing Impacts of Agriculture at the Watershed Scale. Frontiers in Ecology and the Environment, 1(2), 65–72, p. 65. [“Farming has transformed the landscape of the US Midwest by converting upland and wetland habitats to crops and pastures, simultaneously changing hydrologic conditions and water quality, and threatening the region’s biodiversity.”]
As required by the Clean Water Act, each state must develop lists of “impaired waters” and file the information with the EPA.[1] The EPA reports that data but does not aggregate it to provide national figures.
The EPA leaves it to state agencies to monitor and assess their waters and set their own water quality standards. These methods vary from state to state, along with the frequency of data collection, making it difficult to use the information for “national level reporting.”[2] The purpose of these state assessments is to identify local problems and help prioritize local solutions.
Despite these inherent complexities, some organizations, most notably the non-profit Environmental Integrity Project (EIP), have analyzed and aggregated state data to provide percentages of waterways “classified as impaired for one or more designated uses.”[3] More information is provided below about EIP’s aggregated state data.
EPA (2024). National Water Quality Inventory: Report to Congress, pp.24-25. [In the Clean Water Act, “Section 305(b) calls for states to submit a ‘description of the water quality of all navigable waters; the extent to which all navigable waters of such State provide for the protection and propagation of a balanced population of shellfish, fish, and wildlife, and allow recreational activities in and on the water.’” p. 7]
EPA (2024). National Water Quality Inventory, p. 7. [“While the state water quality reports were, and continue to be, valuable for the individual states, numerous independent and internal reviews found the differences in methods across states prevented valid national level reporting.”]
The Clean Water Act at 50: Promises Half Kept at the Half-Century Mark. (2022) Environmental Integrity Project (EIP), pp. 16-17. https://environmentalintegrity.org/wp-content/uploads/2022/03/Revised-CWA-report-3.29.22.pdf
Lakes – Recent state assessments analyzed by the Environmental Integrity Project (EIP), based on Integrated Water Reports filed with the EPA, found that nationally an average of 55% of lakes, ponds, and reservoirs were “impaired.”[1]
Rivers and Streams – EIP found an average of 51% of total assessed miles of rivers and streams were impaired.[1]
Environmental Integrity Project (EIP) (2022) The Clean Water Act at 50: Promises Half Kept at the Half-Century Mark, Table 1. [Data from the EIP’s state assessments were taken from biennial reports published between 2016-2020. See, pp. 16-17]
The EPA defines an impaired waterway as one that is “unable to support one or more of the water quality standards” that the state itself has set. These standards are broadly understood to include:![]() Swimming.
Swimming.![]() Eating fish.
Eating fish.![]() Aquatic life.
Aquatic life.![]() Drinking water.[1]
Drinking water.[1]
Under the Clean Water Act, states must develop TMDLs (Total Maximum Daily Loads) for all the waters they have identified as impaired. A “TMDL is the calculation of the maximum amount of a pollutant allowed to enter a waterbody so that the waterbody will meet and continue to meet water quality standards for that particular pollutant.”[2]
U.S. EPA (2024) National Water Quality Inventory: Report to Congress, 841-R-16-011, pp. 25-26.
U.S. EPA (2022) Overview of Total Maximum Daily Loads (TMDLs). https://www.epa.gov/tmdl/overview-total-maximum-daily-loads-tmdls [“According to the Clean Water Act, each state must develop TMDLs for all the waters identified on their Section 303(d) list of impaired waters, according to their priority ranking on that list.”]