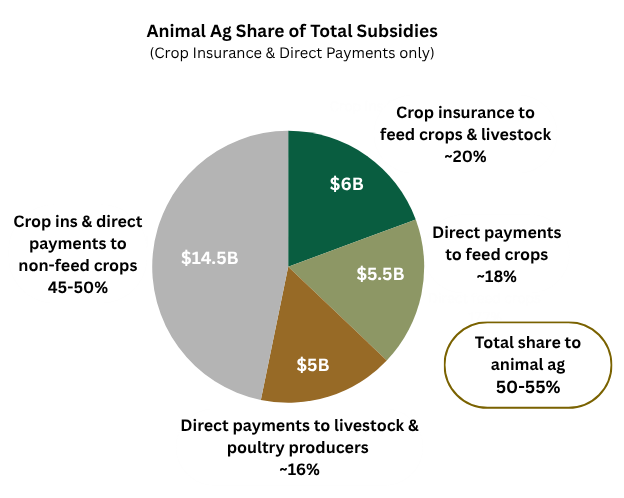
We broadly estimate that at least 50% of all federal agricultural subsidies supports the factory farming system.[1] This includes payments to livestock and poultry producers and to crop producers for that share of crops specifically used for animal feed.[2]

See, Estimated Cost of Major Agricultural Subsidies, https://docs.google.com/spreadsheets/d/1S8LMCG0XIX7Jt2JhdCn6aGhBH6EpTQNC–jpKsv0Y68/edit?gid=0#gid=0
For the shares of primary feed crops that go specifically to animal feed (corn 64%, soy 58%, hay 95%, etc.), see analysis on Total Feed Crops Share along with accompanying pages.
Of the average annual costs of ~$31 billion for all agricultural subsidy programs, we broadly estimate that ~$16.5 billion supports industrial animal ag.[1]

This is mostly through payments for that share of crops going specifically to animal feed (~$11 billion), along with direct payments to livestock and poultry producers (~$5 billion).[2]
See, Estimated Cost of Major Agricultural Subsidies, https://docs.google.com/spreadsheets/d/1S8LMCG0XIX7Jt2JhdCn6aGhBH6EpTQNC–jpKsv0Y68/edit?gid=0#gid=0 [These are all very broad calculations that do not purport to be a comprehensive accounting of federal agricultural subsidies. Figures include just 2 major categories of subsidies: crop insurance and so-called “direct payments.” They do not include, for example, loan programs, research, agricultural extensions, marketing aids, export assistance, purchasing programs, or tax credits, nor many operating and administrative costs. Additionally, many of the underlying figures are not inflation-adjusted.]
The calculations behind this estimate are detailed throughout this page. For the shares of primary feed crops that go specifically to animal feed (corn 64%, soy 58%, hay 95%, etc.), see analysis on Total Feed Crops Share
Corn is by far the most heavily subsidized crop in the U.S.[1-3] The primary feed crop, corn is usually the largest crop by acreage, averaging 29% of all crop acreage planted from 2022-2024.[4]
Farmers sold their corn last year at an average price of 7 to 8 cents per pound, making it one of the cheapest food products in human history.[5]
Corn is grown on some of the most fertile land on earth.[6]
The total value of the entire corn crop is about $63 billion.[7]
Assuming an average net income rate for crops of about 10%, total subsidies to corn farmers probably equal the total expected net income.[8,9]
See, Feed Crop Premium Subsidies 2022-2024 (3-year average for corn is ~34% of all premium subsidies.) https://docs.google.com/spreadsheets/d/1dq_PIwYusnZALF9BHQIhslulu-zIGqTXT1ByeT6zS14/edit?gid=0#gid=0
Environmental Working Group (2024) Farm Subsidy Database, Share of premium subsidies by crop, 1995- 2024. [Shows average crop insurance premium subsidies at 35%] https://farm.ewg.org/cropinsurance.php?fips=00000&summpage=PS_BY_CROP®ionname=theUnitedStates
Congressional Budget Office (June 2024) Baseline Projections, Program Payment Summary, p. 6. [See for example, corn forecast share of Price Loss Coverage and Agriculture Risk Coverage (two of the larger direct payment programs) as follows: For PLC, corn at 48% of total payments. For ARC corn at 54%]
See USDA NASS Acreage Summary Reports – released in June of 2023 & 2024. [2022 planted acreage: Corn 88.6M acres + Soybeans 87.5M acres + Hay 49.5M acres / 312.1M acres total (Corn = 28.4%). 2023 planted acreage: Corn 94.6M acres + Soybeans 82.4 + Hay 52.8 / 319.6M acres total (Corn = 29.6%). 2024 planted acreage: Corn 91.5M acres + Soybeans 85.3M acres + Hay 51.5M acres / 315.2M acres (Corn = 29.0%)
USDA Agricultural Prices Released December 31, 2024, by the National Agricultural Statistics Service (NASS) [Assuming $4.20 per bushel / 56 pounds per bushel.]
Thaler, E. A., et al., (2022). Rates of historical anthropogenic soil erosion in the midwestern United States. Earth’s Future, 10(3), e2021EF002396. p. 1. [“The Midwestern United States is one of the world’s most productive agricultural regions.”]
USDA NASS (January 2025) Crop Production 2024 Summary, ISSN: 1057-7823. [14.9 billion bushels * $4.20 = $62.6B]
Environmental Working Group (2024) Farm Subsidy Database, Share of premium subsidies by crop, 1995- 2024. [Crop insurance subsides for corn averages ~35% of all crop insurance subsidies. Assuming average crop insurance subsidies of ~$10B, that equals $3.5B]
Congressional Budget Office (June 2024) Baseline Projections, Program Payment Summary, p. 6. [See for example, corn’s share of Price Loss Coverage and Agriculture Risk Coverage (two of the larger direct payment programs) as follows: For PLC, corn forecast at $1.5B average per year for 2026-2034. For ARC corn forecast at $.9B average per year for 2026-2034. $1.5B + $.9B + $3.5B (from footnote #7) = ~$5.9B]
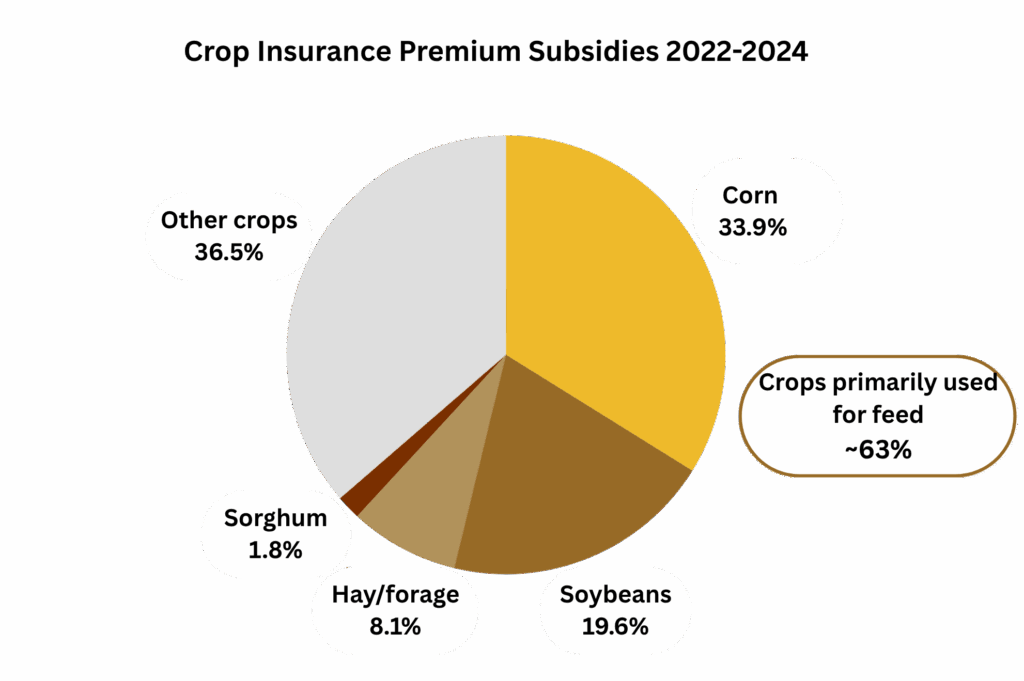
From 2022 through 2024, corn, soybeans, forage, and sorghum – crops used primarily for animal feed – accounted for ~63% of subsidized premiums.[1]

According to their detailed and long-running analysis of USDA data, EWG calculates that from 1995-2024 ~60% of crop insurance subsidies went to these 4 crops.[2] Crop insurance for forage has increased significantly, accounting for the larger total percentage in recent years.
See, Feed Crop Premium Subsidies 2022-2024 https://docs.google.com/spreadsheets/d/1dq_PIwYusnZALF9BHQIhslulu-zIGqTXT1ByeT6zS14/edit?gid=0#gid=0
Environmental Working Group (2024) Farm Subsidy Database, Share of premium subsidies by crop, 1995- 2024.
https://farm.ewg.org/cropinsurance.php?fips=00000&summpage=PS_BY_CROP®ionname=theUnitedStates [Corn = 34.94%, Soybeans = 20.68%, Pasture and Forage = 2.72%, Sorghum = 1.96%, Total = 60.3%]
We estimate that about 50% of crop insurance subsidies goes to animal agriculture. Of the ~$12 billion annual average cost, ~$6 billion supports the factory farming system.
About 45% goes to crops specifically used for animal feed.[1] And ~5% of crop insurance subsidies support livestock through the Livestock Risk Protection program.[2]
See, Feed Crop Premium Subsidies 2022-2024 https://docs.google.com/spreadsheets/d/1dq_PIwYusnZALF9BHQIhslulu-zIGqTXT1ByeT6zS14/edit?gid=0#gid=0 [Note: Our tally for the 4 major feed crops is ~42%. Increasing this share are the many other crops partially used for feed, as well as uncounted uses for the primary crops. For further info, along with the shares of primary feed crops that go specifically to animal feed (corn 64%, soy 58%, hay 95%, etc.), see analysis at Total Feed Crops Share]
In this calculation of ~50%, we include about 4% ($.5B) as the share of Crop Insurance Program subsidies that insure livestock through the Livestock Risk Protection program. Since 2022, total subsidies have been $320M, $450M, $550M, and $650M (forecast), or approximately $493M average and ~4% of the average $12B in subsidies. See: Federal Crop Insurance Corp – Summary of Business Report for 2022 thru 2025 – As of June 30, 2025. https://public-rma.fpac.usda.gov/ReportShare//Extranet/SOB/WeeklyReports/20250630/sobrpt2022-2025.pdf
We use a very conservative figure of 40% of direct payments going to the share of crops specifically used for animal feed.
There are a multitude of direct payment programs, including ad hoc assistance. It would be a challenge to assess all of these over several years and determine what share of each of those programs goes to feed crops and then make calculations about what share of benefits specifically accrue to animal ag. Instead, we note that:
Corn, soybeans, and alfalfa/hay are the 3 largest U.S. crops, accounting for ~72% of all crop acreage from 2022-2024.[1]
Considering only the share of these crops going specifically to animal feed, the land use for those crops is greater than 50% of all cropland.[2]
Direct payments to these crops are very high, with corn regularly showing up as the number one subsidized crop and soybeans usually second.[3-5]
See USDA NASS Acreage Summary Reports — released in June of 2023 & 2024. [2022 planted acreage: Corn 88.6M acres + Soybeans 87.5M acres + Hay 49.5M acres – 225.6 / 312.1M acres total = 72.3%. 2023 planted acreage: Corn 94.6M acres + Soybeans 82.4 + Hay 52.8 / 319.6M acres total = 71.9%. 2024 planted acreage: Corn 91.5M acres + Soybeans 85.3M acres + Hay 51.5M acres / 315.2M acres = 72.4%]
For calculation and for the shares of primary feed crops that go specifically to animal feed (corn 64%, soy 58%, hay 95%, etc.), see analysis at Total Feed Crops Share
Congressional Budget Office (June 2024) Baseline Projections: USDA Farm Programs, p. 6. [See for example, corn and soybean forecast share of Price Loss Coverage and Agriculture Risk Coverage (two of the larger direct payment programs) as follows: For PLC, corn and soybeans at 49.8% of total payments. For ARC corn and soybeans at 82.0%. Although we do not attempt to calculate the exact share of payments specifically going to feed crops from all direct payment programs, we think a 40% share ($6B/$15B) is a conservative estimate considering the many other feed crop uses uncounted. We are not aware of a long-term analysis of the percentage of direct payments that go to feed crops – corn, soybeans, forage, sorghum, and a multitude of secondary crops and secondary uses.]
USDA Farm Service Agency (n.d.) Emergency Commodity Assistance Program (ECAP) See: ECAP Dashboard.
https://www.fsa.usda.gov/resources/programs/emergency-commodity-assistance-program [“USDA’s Farm Service Agency is issuing up to $10 billion in direct payments to eligible agricultural producers of eligible commodities for the 2024 crop year through the Emergency Commodity Assistance Program (ECAP).” Of $7.882B disbursed, 67% was to corn and soybeans as of 07.22.25]Jonathan Coppess, et al., (November 5, 2024) Reviewing the Latest Ad Hoc Payment Proposal in Congress, Successful Farming. [Also, for example, this report estimates that of the 2024 proposed $21 billion in ad hoc disaster aid payments to farmers (since finalized though not fully paid out), about 63% would go to corn and soybean farmers.]
We estimate that the programs that directly benefit factory farm and livestock operations average ~$5 billion annually. (This is not counting subsidies for feed crops.)[1]
An analysis by EWG, counting a wide range of programs, tallies aid at over $5 billion per year for 2019-2023.[2] The Congressional Research Service, counting a limited number of programs, tallies at least $4 billion per year over that same period.[3]
See the following question for approximate values for some of the largest programs. Added up, they tally about $5 billion per year.
Bennett Rosenberg & Jared Hayes (October 28, 2024) USDA livestock subsidies top $72B, Environmental Working Group.
https://www.ewg.org/news-insights/news/2024/10/usda-livestock-subsidies-top-59-billionU.S. GAO (2024) Farm Programs: USDA Financial Assistance to Agricultural Producers for Fiscal Years 2019–2023. GAO-25-107174 [See Figure 6, p. 13. “Livestock and Poultry” ($17.2B) + “Dairy Margin” = $20.3B / 5 years = $4.1B. Does not include any funds from “Unspecified Commodities” ($25.1B) nor from the wide range of programs beyond their scope: “Our analysis did not include technical assistance, farm loan programs, or subsidies paid to crop insurance companies to offset the administrative and operating expenses incurred to provide insurance policies to producers. Additionally, our analysis did not include certain conservation programs that made payments to partners or third-party entities rather than directly to agricultural producers.” at p. 21]
Programs that typically reach between $.5 to $1 billion or more (not a complete listing):
Environmental Quality Incentives Program (EQIP) — ~$1 billion or more per year to animal ag.[1,2]
Livestock Forage & Disaster (LFD) — averaged almost $1 billion per year from 2018 thru 2024.[3,4]
Emergency Livestock Relief Program (ELRP) — $.5 billion in 2022, may pay $2 billion in 2025.[5-7]
Emergency Livestock Assistance Program (ELAP) — an average of ~$.8 billion per year from 2022-2024.[8]
Dairy Margin — has averaged over $.4 billion over the last 8 years.[9]
H5N1-related payments — Costing $.5 to $1 billion per year over recent years.[10,11]
John Newton (April 1, 2019) EQIP and CSP Conservation Programs in the 2018 Farm Bill, American Farm Bureau. https://www.fb.org/market-intel/eqip-and-csp-conservation-programs-in-the-2018-farm-bill [“From 2019 to 2023, EQIP is authorized at $9.175 billion, with $1.75 billion in fiscal years 2019 and 2020, $1.8 billion in fiscal year 2021, $1.85 billion in fiscal year 2022 and $2.025 billion in fiscal year 2023.” Note that EQIP funding must be distributed “at least 50 percent” to “livestock related practices.” (See, USDA (October 2024) Part 530 – Working Lands Conservation Programs Manual, Subpart R, Environmental Quality Incentives Program (EQIP), p. 1)]
U.S. Office of the Inspector General (March 2023) Inflation Reduction Act: Environmental Quality Incentives Program. [See Figure 2 for EQIP projected funding of $3B for 2025 and $3.45B for 2026]
Christine Whitt (June 4, 2024) Livestock Forage Disaster Program (LFP): Drought and Wildfire Assistance. Congressional Research Service, R48082. [See p. 9 for payments in 2018-2022]
Environmental Working Group (2024) Farm Subsidy Database, Livestock Forage Disaster Program payments in the United States totaled $1.8 billion in 2023.[$1.8B in 2023 and $1.1B in 2024]
USDA Farm Service Agency (2023) Factsheet: Emergency Livestock Relief Program (ELRP) 2022. [“…including $500 million specifically targeted for livestock producers impacted by the severe drought or eligible wildfire in calendar year 2022.]
Daniel Munch (June 12, 2025) Emergency Livestock Relief Program: How it Works, American Farm Bureau. [“…the program allocates up to $2 billion for livestock-related losses, with approximately $1 billion committed to ELRP specifically for drought and wildfire damage.”]
USDA Farm Service Agency, Emergency Livestock Relief Program (ELRP) 2023 and 2024, 90 Fed Reg. 22614. [“… directs the Secretary of Agriculture to use up to $2 billion to provide assistance to livestock producers, as determined by the Secretary, for losses incurred during calendar years 2023 and 2024 due to drought, wildfires, or floods. This rule specifies how FSA will implement ELRP 2023 and 2024, which will use approximately $1 billion of the $2 billion provided by the Act to provide financial assistance to eligible livestock producers for losses incurred during 2023 and 2024.”]
Environmental Working Group (2024) Farm Subsidy Database, Emergency Livestock Assistance Program (ELAP). [$.9B in 2022 and 2023 and .6B in 2024]
USDA ERS (February 6, 2025) Farm Income and Wealth Statistics – Government payments by program.
https://data.ers.usda.gov/reports.aspx?ID=4050 [=$250,013 + 294,551 + 185,393 + 1,148,359 + 127,121 + 1,184,317 + 76,962 + 68,042 / 8 = $416M]Congressional Research Service (February 28, 2025) Farm Bill Primer: Animal Disease Management and Prevention DL under CRS Farm Bill, p. 1. [From 2022 to November 2024 “USDA has spent over $1.4 billion on the current outbreak in poultry, including $1.25 billion in indemnity and compensation payments.”]
USDA (February 26, 2025) USDA Invests Up To $1 Billion to Combat Avian Flu and Reduce Egg Prices. [“…the five-pronged strategy includes an additional $500 million for biosecurity measures, $400 million in financial relief for affected farmers, and $100 million for vaccine research, action to reduce regulatory burdens, and exploring temporary import options.”]
Because this analysis focuses on a big-picture view of the largest programs, it fails to illuminate the full array of tax-payer supported programs that deserve attention. Some may not technically be considered subsidies, though they are clearly government financial support for the animal ag industry.
Wildlife Services – This is a government agency that kills wildlife (including wolves, bears, coyote, and many non-target animals) that might prey on livestock.[1,2] Some of their techniques, including cyanide bombs, are brutal.
BLM and Forest Service – These federal agencies rent out federal lands for grazing at rates one-tenth the fees for private lands, encouraging livestock production on arid land.[3]
Factory farm gas (aka biogas) – These programs (through EQIP, REAP, state-funded, and more) stabilize the factory farm business model, encourage the concentration of larger numbers of animals, and put a halo on an environmentally disastrous system that concentrates animals and enormous amounts of untreated manure.[4,5]
Livestock Indemnity Program – Pays operators for animal deaths “in excess of normal mortality.” Because eligible weather events include floods, extreme heat, and extreme cold, these payments discourage better animal husbandry.[6]
“Depopulation” services – These programs, especially in the wake of H5N1 flu virus, have paid for the killing of hundreds of millions of animals with techniques that cause suffering for hours and sometimes days.[7-10]
Colin Tiernan (March 12, 2023) ‘The hired gun of the livestock industry’: Wildlife Services, a federal agency, kills more than 100,000 animals in Washington every year, The Spokesman-Review.
Center for Biological Diversity (April 3, 2024) 375,000 Native Animals Killed by Federal Program in 2023.
See, Grazing on Federal Lands
Ruthie Lazenby (2022) Rethinking Manure Biogas – Policy Considerations to Promote Equity and Protect the Climate and Environment, Center for Agriculture & Food Systems, VT Law and Graduate School.
Waterman, C. & Armus, M. (2024). Biogas or Bull****? The Deceptive Promise of Manure Biogas as a Methane Solution. Friends of the Earth.
USDA Farm Service Agency (2023) Disaster Assistance – Livestock Indemnity Program Factsheet.
John McCracken (May 4, 2025) Inside the business of killing millions of chickens in response to bird flu Rapid ‘depopulation’ raises concerns about worker safety and humane practices, Investigate Midwest. https://investigatemidwest.org/2025/04/30/underage-workers-millions-of-dollars-and-trucks-full-of-dead-chickens-inside-the-business-of-killing-in-response-to-bird-flu/
Reyes-Illg, G., et al., (2023). The Rise of heatstroke as a method of depopulating pigs and poultry: implications for the US veterinary profession. Animals, 13(1), 140.
Congressional Research Service (February 28, 2025) Farm Bill Primer: Animal Disease Management and Preventionl. [From 2022 to November 2024 “USDA has spent over $1.4 billion on the current outbreak in poultry, including $1.25 billion in indemnity and compensation payments.”]
USDA (February 26, 2025) USDA Invests Up To $1 Billion to Combat Avian Flu and Reduce Egg Prices. [“…the five-pronged strategy includes an additional $500 million for biosecurity measures, $400 million in financial relief for affected farmers, and $100 million for vaccine research, action to reduce regulatory burdens, and exploring temporary import options.”]
Specialty crops (including fruits, vegetables, and tree nuts) typically receive less than 10% of the subsidies received by commodity crops (aka field crops or row crops) such as corn, soybeans, and wheat.[1]
Many non-profit groups have noted that government support to crop producers does not align with the USDA’s dietary guidelines. According to those recommendations, almost 90% of Americans do not consume enough vegetables, about 80% consume fruits below recommended levels, and nearly 70% of Americans eat meat, poultry, and eggs at or above recommended levels.[2]
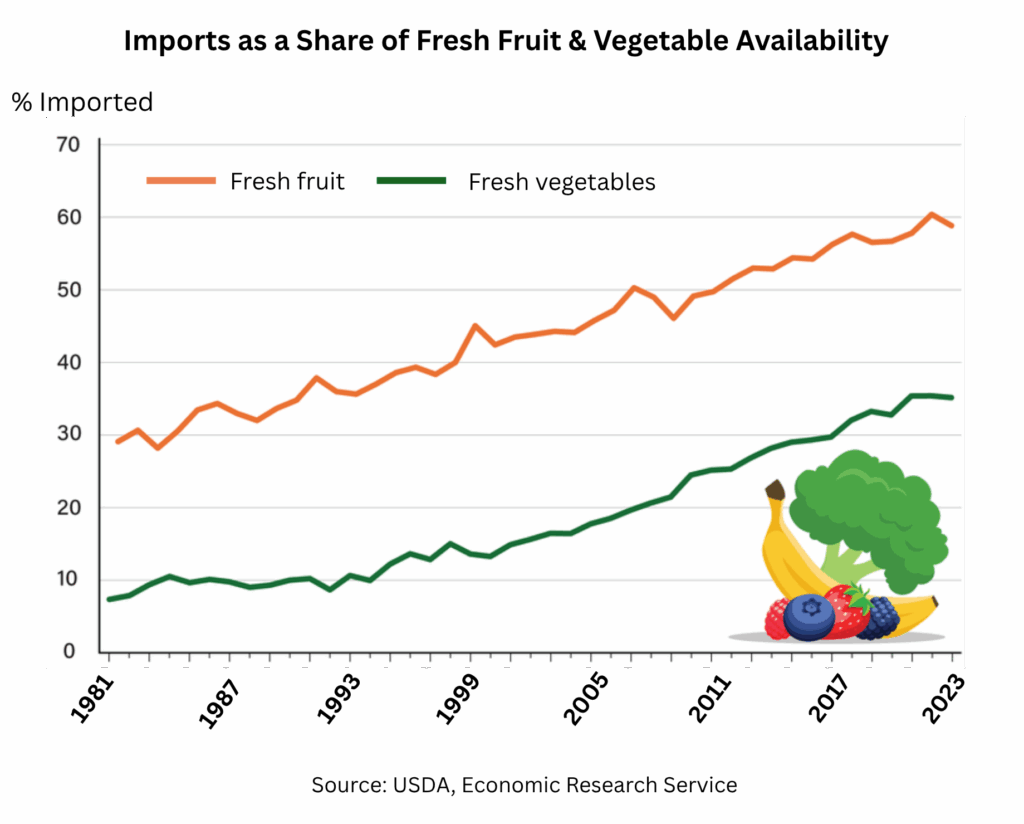
As of 2023, imports made up ~60% of fresh fruit availability and ~35% of fresh vegetable availability.[3]

U.S. GAO (December 2024) Farm Programs: USDA Financial Assistance to Agricultural Producers for Fiscal Years 2019–2023, GAO-25-107174, Figure 6, p. 13. [Shows total specialty crop subsidies at $8.1B compared to Field Crops at $102.6B for 2019-2023. Field crops “ Includes crops such as corn, cotton, rice, sorghum, soybeans, and wheat.”]
USDA (2020) Dietary Guidelines for Americans 2020-2025, 9th ed., Figure 1-6, p. 30, and pp. 31-32.
USDA Economic Research Service (January 2025) U.S. fresh fruit and vegetable supplies continue to rely on imports (Availability calculated as production minus exports plus imports and is measured in volume. Excludes potatoes, sweet potatoes, and mushrooms)
