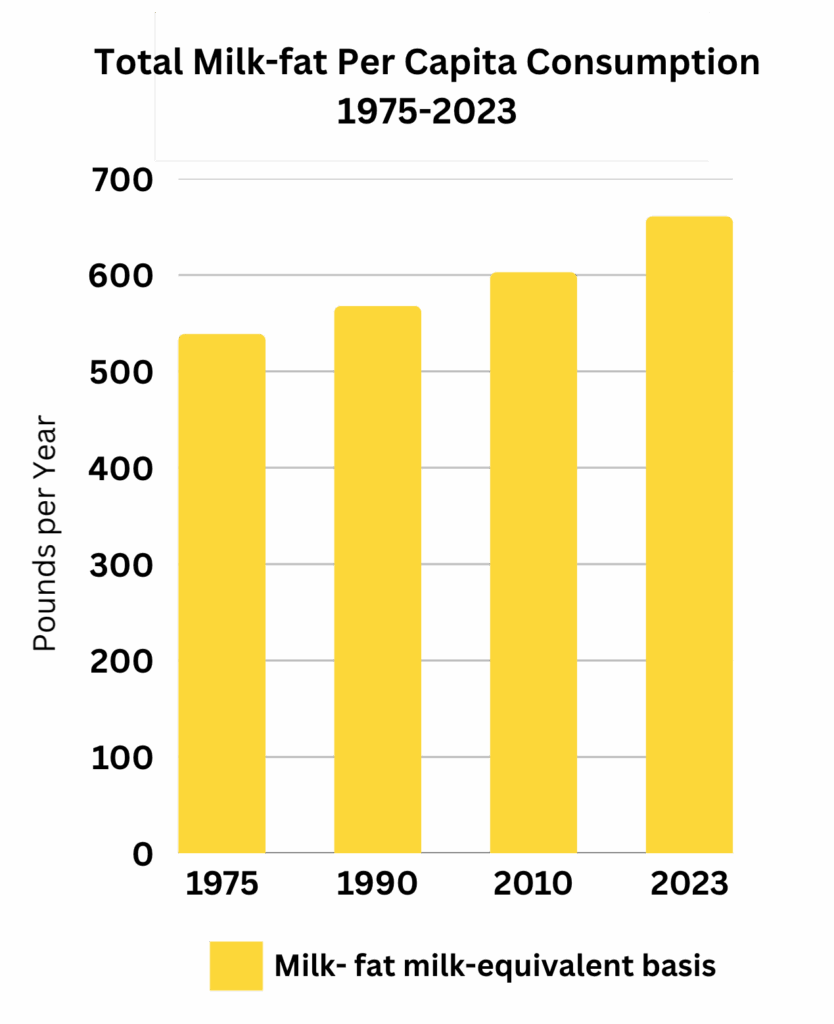
In 2023, the U.S. per capita consumption of milk from cows on a “milk-equivalent milk-fat basis” was 661 lbs.[1]
Because a variety of products are made from milk (e.g., butter, cheese, and yogurt), the USDA calculates the total amount of consumed fluid milk on a “milk-equivalent milk-fat basis.” This is the total milk volume required to provide the milkfat in all consumed products.[2]
USDA ERS (updated 9/30/25) Dairy Data. Dairy products: Per capita consumption, U.S. annual pounds of milkfat. [2023 per capita milk-equivalent milk-fat basis = 661 lbs. or about 77 gallons – at 8.6 pounds per gallon.]
USDA National Agricultural Library Thesaurus (NALT) [Defines milk equivalent as “The quantity of fluid milk used in a processed dairy product, usually expressed on a milk fat basis, e.g. one pound of cheese is the equivalent of 9.88 pounds of milk.”]
Yes. Although fluid cow’s milk consumption is decreasing, the reduction is more than offset by the increasing consumption of milk used for other dairy products.
In 2023, the per capita consumption of dairy products on a milk-fat basis was 661 lbs. It has risen steadily since 1975 when it was 539 lbs. This is a 23% increase over that period.[1]
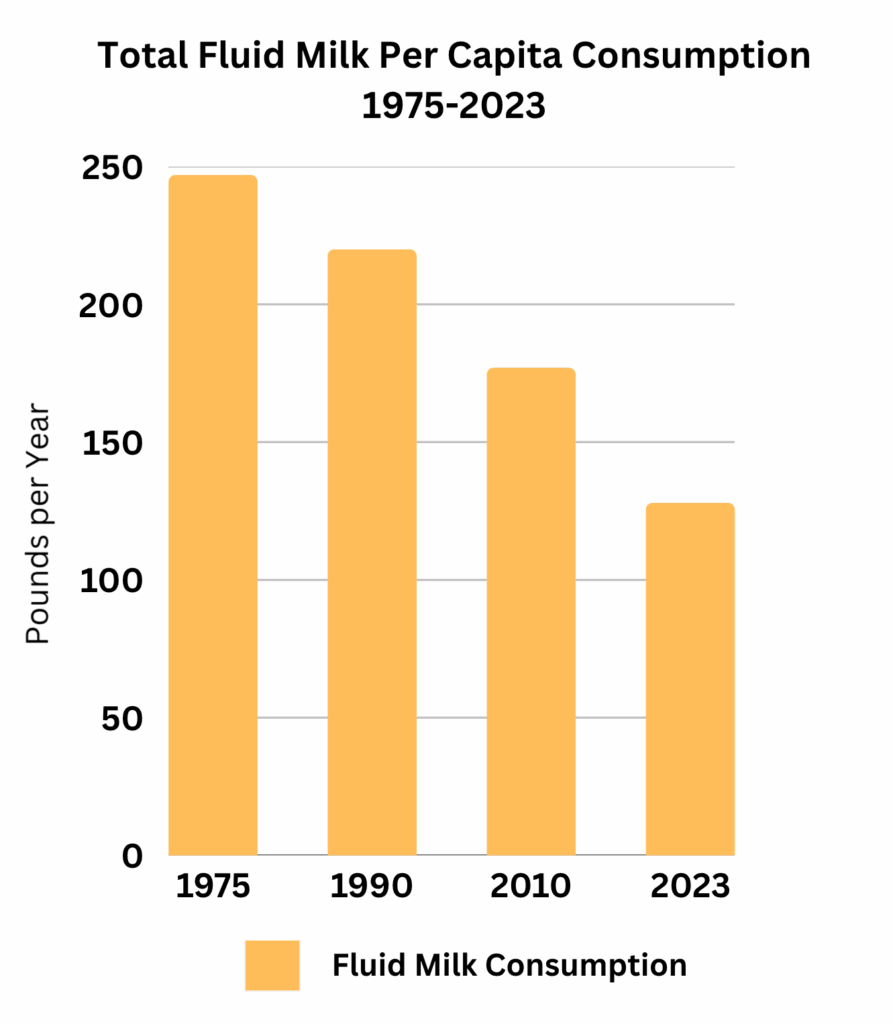
While the consumption of fluid milk has shrunk almost in half over the last 50 years, the consumption of cheese in that time has more than doubled from ~19 lbs. to ~42 lbs.[2] Increases in dairy products other than milk have an outsized impact on total milk production. For example, it requires the milkfat from 22 lbs. of milk to make 1 pound of butter and almost 10 lbs. of milk to make 1 pound of American cheese.[3,4]
Even at current per capita consumption levels of almost 2 pounds per day (on a milk-fat milk-equivalent basis) the USDA dietary guidelines suggest that “About 90 percent of the U.S. population does not meet dairy recommendations.”[5] The guidelines recommend a substantial 3 cup-equivalents of dairy consumption per day.[6]
USDA ERS (updated 9/30/25) Dairy Data. Dairy products: Per capita consumption, U.S. annual pounds of milkfat. [2023 total milk-equivalent per capita 661 lbs. 1975 per capita = 539.1 lbs.]
Dairy Data. Dairy products: Per capita consumption, U.S., Fluid beverage milk: 1975 = 247 lbs.; 2023 = 128 lbs.; Cheese: 1975 = 18.8 lbs.; 2023 = 42.3 lbs.
Robert Jacobson (1992) Calculating Milk Equivalents: Milkfat or Total Solids Basis, Dairy Markets and Policy Issues and Options, p. 3. [“…it takes the milkfat from 21.80 pounds of milk… to make one pound of butter.” Although this report is dated, this approximate figure is commonly used.]
USDA National Agricultural Library Thesaurus (NALT) [In defining milk equivalent, notes that “one pound of cheese is the equivalent of 9.88 pounds of milk.”]
USDA and Dept. of Health and Human Services. (2020) Dietary Guidelines for Americans, 2020-2025. 9th Edition, p. 33 and Figure 1-6 on p. 30.
USDA and Dept. of Health and Human Services. (2020) Dietary Guidelines for Americans, 2020-2025, p. 20, Table 1-1. [This is for a relatively low average daily calorie intake of 2,000 calories per day. 1 cup-equivalent = “1 cup milk, yogurt, or fortified soymilk; 1½ ounces natural cheese such as cheddar cheese or 2 ounces of processed cheese.” (p. 146) The caloric intake of 1 cup milk, 1 cup of yogurt, and 1½ ounces cheddar cheese = ~450 calories, or nearly a quarter of a 2,000 calorie per day diet.]
In 2023:![]() Retail weight = 128 lbs. This is about 60 quarts of fluid milk available at retail per capita.[1]
Retail weight = 128 lbs. This is about 60 quarts of fluid milk available at retail per capita.[1]
The trend in milk consumption:[2]
![]() The estimated “actual consumption” (adjusted for losses) equals ~87 lbs. or about 41 quarts of fluid milk.[3]
The estimated “actual consumption” (adjusted for losses) equals ~87 lbs. or about 41 quarts of fluid milk.[3]
USDA ERS (updated 9/30/25) Dairy Data. Dairy products: Per capita consumption. Fluid beverage milk. [Note: 128 lbs. is the retail weight, which is defined in the USDA Food Availability (Per Capita) Data System as “The basic availability estimate made at a primary distribution level … Includes commercial sales and milk consumed on farms.” See, fn 2 on chart for All beverage milks.]
Dairy Data. Dairy products: Per capita consumption. Fluid beverage milk.
USDA ERS (2024) Food Availability (Per Capita) Data System. Loss-Adjusted Food Availability, Dairy (fluid milk, cream, and other products). Total beverage milks worksheet. [Note: These tables only go through 2021. However, we calculate the loss adjusted figure by using the USDA’s 2021 estimate of total loss of 31.8%. 128 lbs. * 31.8% = 40.7 lbs. 128 – 40.7 == 87.3 lbs.]
In 2023:[1]![]() Cheese: 42.3 lbs. This is more than twice the amount consumed in 1975 (18.8 lbs.)
Cheese: 42.3 lbs. This is more than twice the amount consumed in 1975 (18.8 lbs.)
![]() Frozen dairy products including ice cream & frozen yogurt: ~21 lbs. total. This is less than was consumed in 1975 (27.9 lbs.)
Frozen dairy products including ice cream & frozen yogurt: ~21 lbs. total. This is less than was consumed in 1975 (27.9 lbs.)
![]() Butter: 6.5 lbs. This is an almost 40% increase from 1975 (4.7 lbs.)
Butter: 6.5 lbs. This is an almost 40% increase from 1975 (4.7 lbs.)
![]() Yogurt (other than frozen): 13.8 lbs. This is about 7 times more than was consumed in 1975 (2 lbs.)
Yogurt (other than frozen): 13.8 lbs. This is about 7 times more than was consumed in 1975 (2 lbs.)
On a “milk-equivalent milk-fat basis,” cheese has become the primary dairy food, overtaking fluid milk and responsible for the usage of about half of all milk production.[2]
USDA ERS (updated 9/30/25) Dairy Data. Dairy products: Per capita consumption. [Note: the amounts per capita are based on retail weight, which is defined in the USDA Food Availability (Per Capita) Data System in the footnotes for each of the Dairy categories as “The basic availability estimate made at a primary distribution level which is dictated for each commodity by the structure of the marketing system and data availability.”]
USDA Dairy Data (updated 5/1/2025) Supply and allocation of milk fat and skim solids by product (annual). See, Table: “Milk-fat percent of total supply by product (percent).” [42.2% / 82.8% = 51%.]
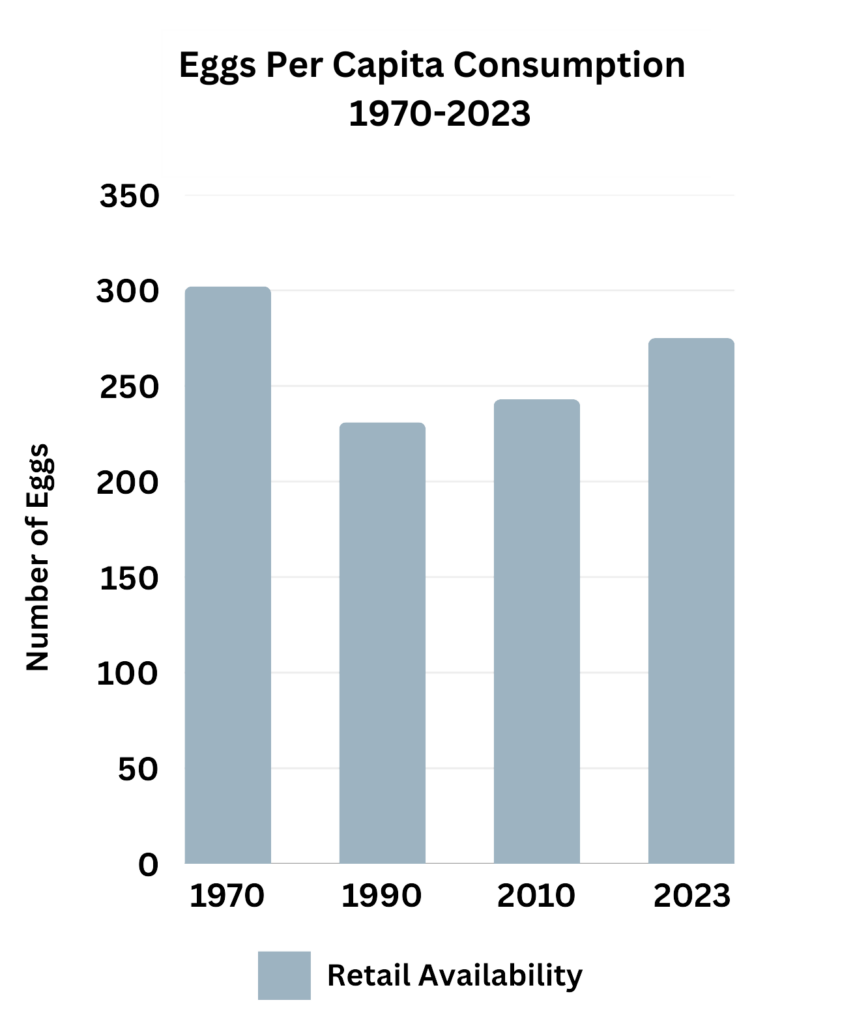
The USDA estimates that 275 eggs per capita were “available for consumption” at the retail level in 2023.[1]
This figure is down slightly from a recent high in 2019 of ~289 eggs per capita.[2] The decline is likely due to the impacts of avian flu as millions of laying hens are dying from disease or in mass on-farm slaughters.
The trend in egg consumption:[3]
USDA (March 11, 2025) World Agricultural Supply and Demand Estimates, U.S. Egg Supply and Use, p. 33. [2023 = 275.0 available for consumption. “Egg availability includes fresh and processed uses by manufacturers and institutional outlets, such as hospitals, hotels, and restaurants.” Note: WASDE reports the per capita figure based on “farm weight” which the USDA converts to retail weight using a factor of ~99%]
USDA (2025) Food Availability (Per Capita) Data System: Eggs, Per Capita availability. [2019 = 288.6 eggs]
Figures for 1970-2010 from USDA (2025) Food Availability (Per Capita) Data System: Eggs, Per Capita availability. [1970 = 302 eggs; 1990 = 231 eggs; 2010 = 243 eggs; 2023 = 275 eggs]