
Animal-Sourced Food Waste
What is the difference between food loss and food waste? As defined by a recent “national strategy” from the EPA, USDA, and FDA:[1-4] Food loss is the volume of losses from the point of production (crop harvests, slaughterhouses, dairy and egg farms) through distribution and delivery to retailer or food service operations. Food waste refers […]
Neonics: Poison, Profit, and Policy

Take a highly toxic pesticide with limited efficacy and bundle it to increase sales. Now it’s the default option for feed crop farmers. Neither monitored nor regulated by the government. Myriad species are harmed and the potential for human health risk grows.
Comparisons of Animal-Sourced Food Consumption
How does U.S. per capita total meat consumption compare to the world average? U.S. per capita meat consumption (red meat and poultry) is about 2.8 times the size of average world consumption. Using FAO figures for 2022:[1] World = 98 lbs. U.S. = 271 lbs. The FAO figures do not align with the U.S. consumption […]
Per Capita Dairy & Egg Consumption
How much dairy milk is used per capita to produce all dairy products? In 2023, the U.S. per capita consumption of milk from cows on a “milk-equivalent milk-fat basis” was 661 lbs.[1] Because a variety of products are made from milk (e.g., butter, cheese, and yogurt), the USDA calculates the total amount of consumed fluid […]
Per Capita Meat Consumption
What is U.S. per capita total meat consumption? In 2024, U.S. per capita total meat consumption: Retail weight = 227 lbs.[1] Total per capita meat consumption has increased by ~17% from 1970. It has increased by ~9% from 2010. It has increased by ~1% from 2023 to its highest historical rate.[2] The USDA’s “red meat” […]
Meat Consumption Data Overview
Why is it important to track the consumption of meat and other animal-sourced foods? Consumption data for meat and other animal-sourced foods can help in evaluating: Overall trends in the size and impacts of the factory farming system. Health concerns, e.g., how does consumption match up to nutrition research or USDA guidelines. Comparisons to other […]
Animal-Sourced Food Consumption Takeaways
Animal-Sourced Food Consumption Takeaways Takeaways are key points detailed and referenced in the Consumption Figures section Choosing Per Capita Meat Consumption Figures Quoted meat consumption figures can vary widely depending on the choice of data source; the USDA’s per capita estimates of “retail weight” are the most credible. USDA “retail weight” figures do not account […]
Infographic – Meat & Dairy Per Capita Consumption
This infographic shows some of the main consumption figures for recent meat and dairy products, along with a snapshot of how U.S. consumption of animal-sourced foods compares to the world average. Also shown are some key figures on ASF food waste. to download click here
Factory farm manure is a pollutant – the valuable fertilizer pretense is wearing thin
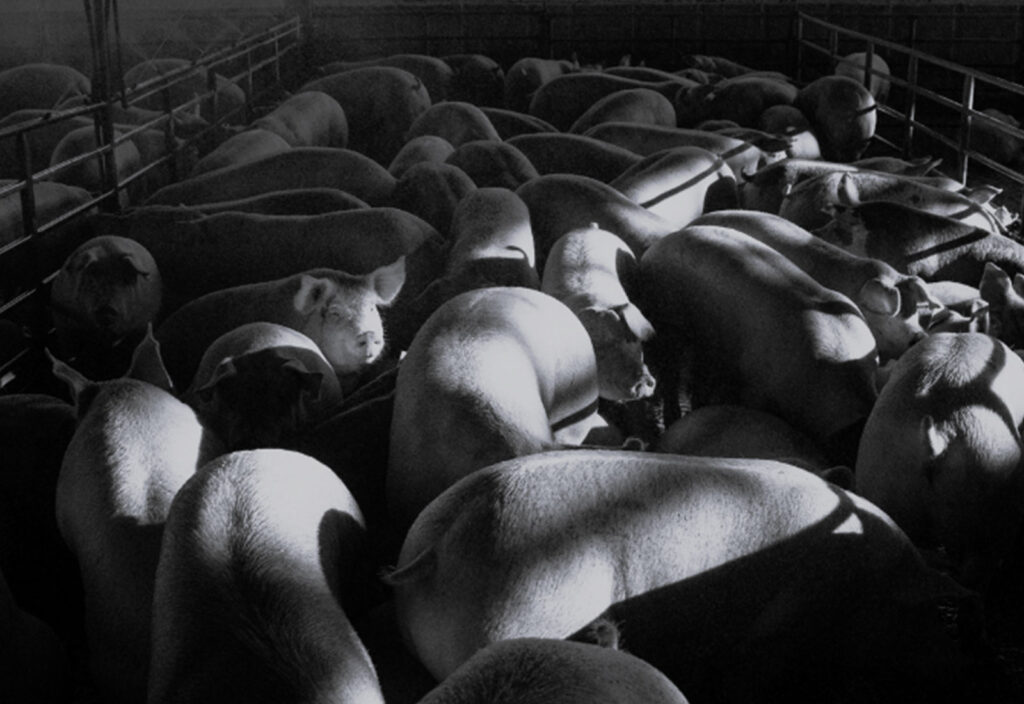
Factory farm manure creates nutrient pollution that poisons waterways, kills wildlife, and degrades drinking water. That reality has been obscured by federal agencies and the animal ag industry for decades.
The Animal Ag Industry: Hiding in Plain Sight
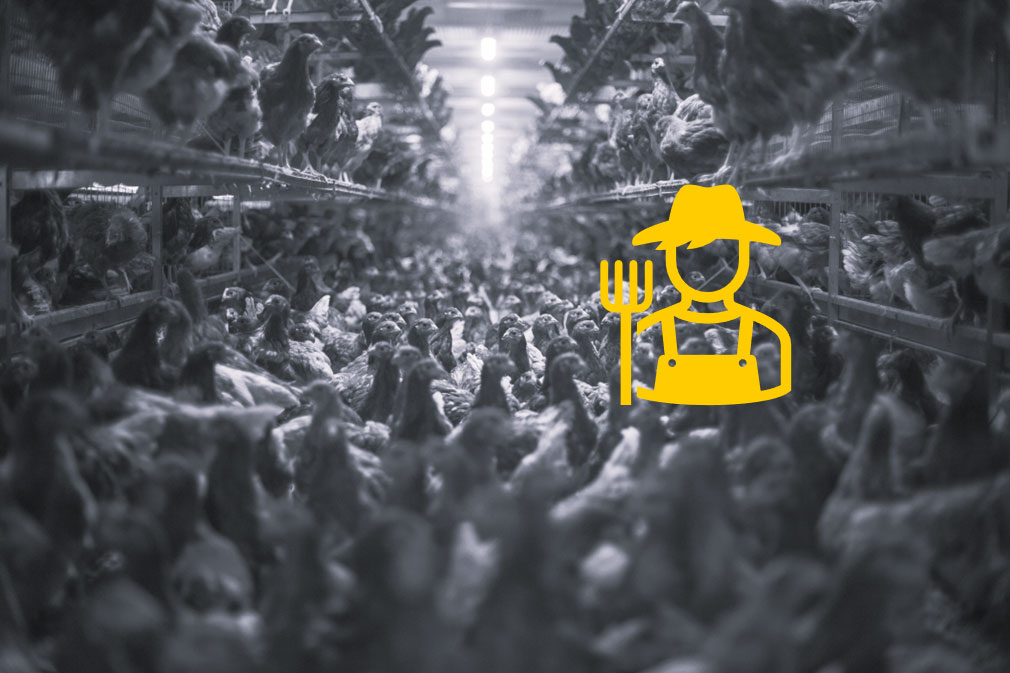
Factory farming wears a thin but effective disguise. Because of our appetite for cheap meat, we’re easily taken in by labels with red barns or photos of family farmers with cows on pasture.