U.S. per capita meat consumption (red meat and poultry) is about 2.8 times the size of average world consumption. Using FAO figures for 2022:[1]
![]() World = 98 lbs.
World = 98 lbs.![]() U.S. = 271 lbs.
U.S. = 271 lbs.
The FAO figures do not align with the U.S. consumption figures used throughout these pages. FAO estimates are much higher than USDA figures because they are closer to carcass weight, especially the red meat figures. We present FAO figures here because they are the best source for comparisons of U.S. consumption with other countries.[2]

FAOSTAT, Food and Agriculture data, [Query: Food balances/U.S. & World/Food Supply quantity (kg/capita/yr)/2022/Bovine Meat, Mutton & Goat, Pigmeat, Poultry Meat, Other Meat] (Accessed 3/28/25)
See, Meat Consumption Data Overview [ question: “Why are FAO figures used to estimate U.S. per capita meat consumption?”]
U.S. per capita fish/shellfish consumption is slightly more than world consumption. Using FAO figures for 2022:[1]
![]() World = 44 lbs.
World = 44 lbs.![]() U.S. = 49 lbs.
U.S. = 49 lbs.

FAOSTAT, Food and Agriculture data. [Query: Food balances/U.S. & World/Food Supply quantity (kg/capita/yr)/2022/Freshwater Fish, Demersal Fish, Pelagic Fish, Marine Fish (Other), Crustaceans, Cephalopods, Mollusks] (Accessed 3/28/25)
U.S. per capita dairy consumption (excluding butter) is about 2.8 times the size of world consumption. Using FAO figures for 2022:[1]
![]() World = 183 lbs.
World = 183 lbs.![]() U.S. = 508 lbs.
U.S. = 508 lbs.
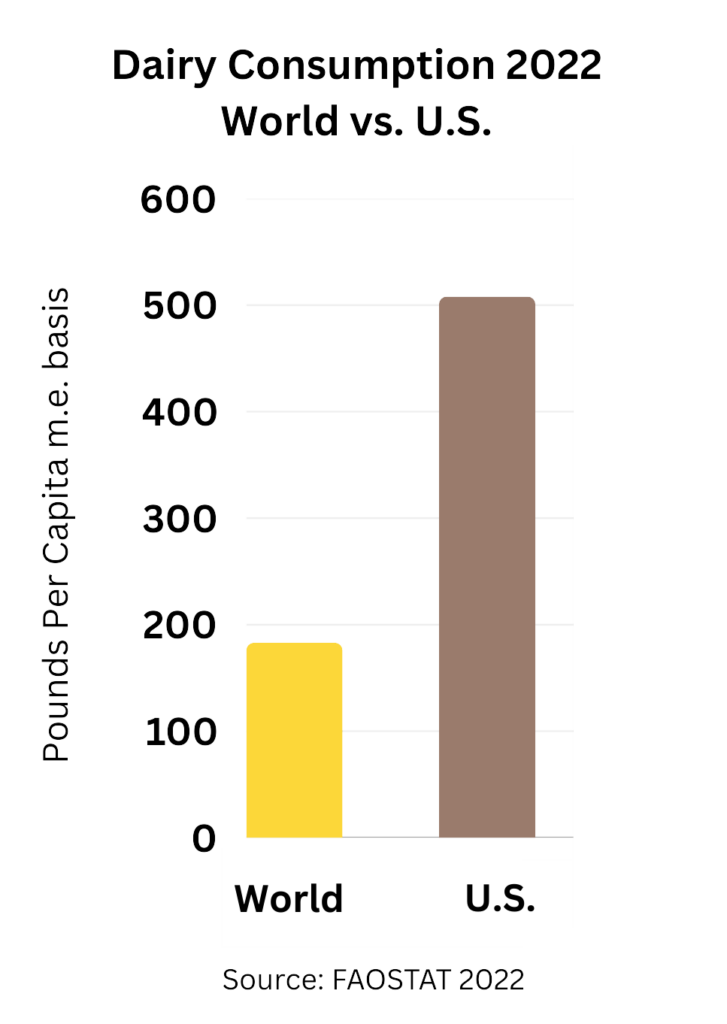
FAOSTAT, Food and Agriculture data. [Query: Food balances/U.S. & World/Food Supply quantity (kg/capita/yr)/2022/Dairy (excluding butter). Note: The FAO estimates dairy product consumption (with the exception of butter and ghee) on a milk-fat milk-equivalent basis.] (Accessed 3/28/25)
U.S. per capita egg consumption is about 50% more than world consumption. Using FAO figures for 2022:[1]
![]() World = 23 lbs. (or 176 eggs)
World = 23 lbs. (or 176 eggs)![]() U.S. = 35 lbs. (or 267 eggs)
U.S. = 35 lbs. (or 267 eggs)

FAOSTAT, Food and Agriculture data, [Query: Food balances/U.S. & World/Food Supply quantity (kg/capita/yr)/2022/Eggs. Note: The FAO estimates egg consumption by weight. Using USDA’s calculation that one egg weighs ~.131 lbs., the World figure for eggs is ~176 per capita; the U.S. figure is ~267 per capita.] (Accessed 3/28/25)
The USDA’s Dietary Guidelines for 2020-2025 reports that:[1]
![]() About three-quarters of the population “meet or exceed the recommendation” for meat, poultry & eggs.
About three-quarters of the population “meet or exceed the recommendation” for meat, poultry & eggs.![]() Almost 90% do not meet the recommendations for vegetables.
Almost 90% do not meet the recommendations for vegetables.![]() About 80% do not meet the recommendations for fruit.
About 80% do not meet the recommendations for fruit.![]() About 90% do not meet the recommendations for dairy.
About 90% do not meet the recommendations for dairy.
The dairy recommendation to consume “3 cup-equivalents” per day as part of a diet of 2,000 calories reflects the USDA’s historic and ongoing support for surprisingly high levels of dairy consumption.[2,3] The caloric intake of this amount of dairy food translates into anywhere from 420-520 calories, depending on fat content. Therefore, USDA guidelines are recommending that dairy consumption make up almost a quarter of total consumed calories.[4]
USDA & U.S. Health & Humans Services (2020) Dietary Guidelines for Americans, 2020-2025. 9th Edition, see chart, p. 30 and pp. 31-34.
Dietary Guidelines for Americans, 2020-2025, p. 20, Table 1-1.
USDA Agricultural Marketing Service Dairy Program [See, for example, the number of programs assisting dairy producers (not including the wide range of milk industry subsidies). “The AMS Dairy Program helps the U.S. dairy industry efficiently market high-quality milk and dairy products. It also ensures that U.S. consumers have access to a sufficient supply of these products at all times.”]
Dietary Guidelines for Americans, 2020-2025, p. 146. [This is for a relatively low average daily calorie intake of 2,000 calories per day. 1 cup-equivalent = “1 cup milk, yogurt, or fortified soymilk; 1½ ounces natural cheese such as cheddar cheese or 2 ounces of processed cheese.” The caloric intake of 1 cup milk (100-150 calories), 1 cup of yogurt (150-200 calories), and 1½ ounces cheddar cheese (170 calories) = ~420-520 calories.]
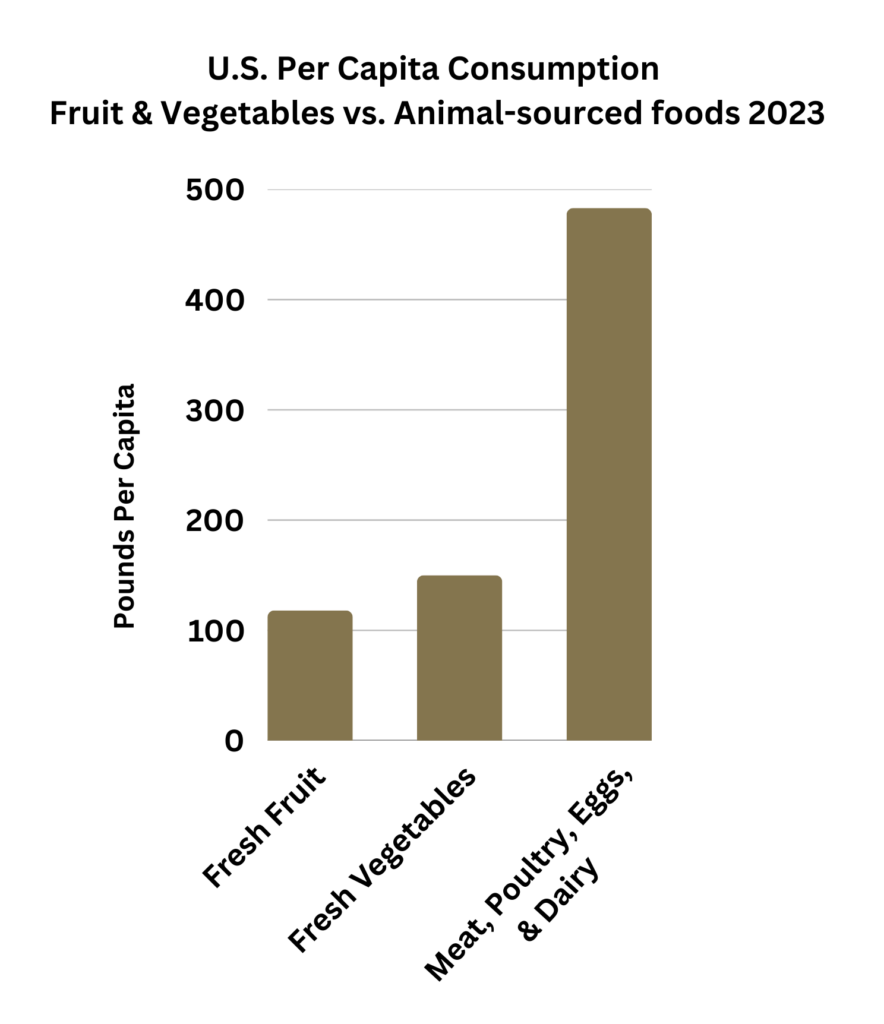
Americans’ underconsumption of fruits and vegetables along with the overconsumption of meat, poultry, eggs, and dairy products is reflected in the respective weights consumed per capita.[1-6]
Per capita consumption of animal-sourced foods (~483 lbs.) is more than 4 times that of fresh fruit (~119 lbs.) and more than 3 times that of fresh vegetables (~150 lbs.).
For fruits, see, USDA (updated 2/25/2025) Fruit and Tree Nuts Data – Yearbook Tables, Supply & Utilization, Table G-36, All fruit, fresh, 2023 Per capita = 119.2 lbs.
For vegetables, see, USDA (2025) Vegetable and Pulses Data – Yearbook Tables, Table 2a, 2023 Per capita availability Fresh Vegetables (excluding potatoes) = 150.4 lbs.
For meat & poultry, see, USDA ERS (updated 3/21/25) Livestock and Meat Domestic Data. Table: Meat supply and disappearance tables, recent. Worksheet: Total red meat & poultry 2023 consumption = 224.1 lbs. [While data is out for 2024, we use 2023 to compare with the last published tables for fruits and vegetables.]
For eggs by weight, see, USDA (March 11, 2025) World Agricultural Supply and Demand Estimates, U.S. Egg Supply and Use, p. 33. [2023 = 275.0 available for consumption. And using USDA’s estimate of an egg weighing .131 lbs. = 36 lbs. of eggs.
For Dairy, see, USDA ERS (2025) Dairy Data. Dairy Products: Per capita consumption, United States (Annual) [Total weights of dairy products 2023 = 223 lbs. [Note: This estimate is not based on a milk-equivalent milk-fat basis (661 lbs.). It is the actual weight of fluid milk and other dairy products. See Per capita Dairy & Egg Consumption.]
The 2023 total for meat, poultry, eggs, and dairy = ~483 lbs.]