As defined by a recent “national strategy” from the EPA, USDA, and FDA:[1-4]
Food loss – is the volume of losses from the point of production (crop harvests, slaughterhouses, dairy and egg farms) through distribution and delivery to retailer or food service operations.
Food waste – refers to discarded or wasted food at the retail and consumer level. It is the volume of losses from the point of receipt by retailer or food service through consumer losses at home and in restaurants.
Most assessments focus on food waste since it is the bulk of losses and has the most potential for reduction. In all these pages, we focus on food waste – the tallies from retail or food service (including restaurants) through to the household level.
EPA, USDA, FDA (2024) National Strategy for Reducing Food Loss and Waste and Recycling Organics, p. 33. [“Food loss: Food produced for human consumption that leaves the human food supply chain for any reason (and is not ultimately consumed by humans) between production up to, but not including, the retail sector.”]
National Strategy for Reducing Food Loss and Waste and Recycling Organics, p. 34. [“Food waste: Food produced for human consumption that leaves the human food supply chain for any reason (and is not ultimately consumed by humans) at the retail, food service or household sectors.”]
National Strategy for Reducing Food Loss and Waste and Recycling Organics, p. 9. [“Food loss occurs on farms or during food manufacturing/processing, storage and distribution, whereas food waste occurs in retail, food service or households.”]
EPA Terminology Services – Terms & Acronyms. [Food Waste = “Uneaten food and food preparation wastes from residences and commercial establishments such as grocery stores, restaurants, and produce stands, institutional cafeterias and kitchens, and industrial sources like employee lunchrooms.”]
Both the USDA and the EPA broadly estimate that food waste accounts for one-third of the U.S. food supply.[1]
![]() USDA – “In the United States, food waste is estimated at between 30-40 percent of the food supply.”[2]
USDA – “In the United States, food waste is estimated at between 30-40 percent of the food supply.”[2]![]() EPA – “Over one-third of the food produced in the United States is never eaten…”[3]
EPA – “Over one-third of the food produced in the United States is never eaten…”[3]![]() USDA, EPA, FDA, USAID – “…over one-third of food available is not eaten.”[4]
USDA, EPA, FDA, USAID – “…over one-third of food available is not eaten.”[4]![]() USDA estimate for year 2010 – “31 percent…of the available food supply at the retail and consumer levels in 2010 went uneaten.”[5]
USDA estimate for year 2010 – “31 percent…of the available food supply at the retail and consumer levels in 2010 went uneaten.”[5]
The non-profit ReFED estimates that in 2023 food waste totaled about 27% of all food in the U.S.[6]
Globally, the UN estimates that food waste is ~19% of the available food supply, wasted at the retail, food service, and household levels.[7]
As noted below, agencies use different terms and descriptions and avoid definitive statements due to a lack of firm data.
USDA (n.d.) Food Waste FAQs.
https://www.usda.gov/about-food/food-safety/food-loss-and-waste/food-waste-faqsJaglo, K., et al., (2021) From Farm to Kitchen: The environmental Impacts of U.S. Food Waste, U.S. EPA, 600-R21 171, p. 1.
FDA (2024) Formal Agreement among the USDA, EPA, FDA, and USAID relative to cooperation and coordination on food loss and waste.
Buzby, J. C., et al., (2014) The Estimated Amount, Value, and Calories of Postharvest Food Losses at the Retail and Consumer Levels in the United States, USDA ERS, Bulletin No. 121, p. iii [Note: Although this is a dated report, it is often referenced as a “baseline” estimation – against which more recent progress can be measured.]
ReFED (n.d.) Food Waste Data—Causes & Impacts. [Food waste estimated at 63 million tons / 237 million tons of food in the U.S.] https://refed.org/food-waste/the-problem/#what_is_food_waste
United Nations Environment Programme (2024). Food Waste Index Report 2024. Nairobi. p. xii. [“This is in addition to the estimated 13 per cent of the world’s food that is lost in the supply chain from post-harvest up to and excluding retail.”]
Despite years of efforts and stated goals, government agencies have not been able to effectively monitor levels of food waste.[1,2] There is an acknowledged lack of federal programs, infrastructure, or consistent methodology to calculate losses or even identify a baseline assessment from which to measure progress in reductions.[3-5]
Figures for food waste require detailed estimates from different market sectors (retailers, food service, restaurants). The largest losses based on consumer surveys of at-home activities are often unreliable. In 2018, the USDA convened a body of experts in an effort to refine their food loss methodologies.[6] However, the USDA has not generated loss-adjusted figures for most food categories (including meat consumption) since 2019.[7]
A 2025 USDA-funded report that explored methodologies for estimating retail waste bluntly concluded that “there is insufficient information to recommend that ERS move forward with a nationally representative study on retail food loss at this time.”[8]
EPA, USDA, FDA (2024) National Strategy for Reducing Food Loss and Waste and Recycling Organics, p. 9. [“…there are many obstacles, such as limited, nationally representative data on food loss and waste in some areas (e.g., on the farm and during production stages). Data gaps and limitations make it difficult to understand the extent and consequences of food loss and waste, track progress toward the national and international goals, and measure success.”]
Li, R., et al., (2023) Household food waste trending upwards in the United States: Insights from a National Tracking Survey. Jnl of Agr & App Econ Assoc. 2:306–317, p. 307. [“Despite bipartisan support for food waste reduction, the US lacks federally implemented, regularly occurring quantitative measurements of food wasted at the household level, which is the single largest source of wasted food…”]
U.S. EPA (April 2023) 2019 Wasted Food Report Estimates of generation and management of wasted food in the United States in 2019, EPA 530-R-23-005, Table 3, p. 7; Table 7, p. 27. [“Finally, there are some data limitations associated with EPA’s estimates. EPA relies on existing studies and data to develop generation factors, and for some sectors, there are few existing studies.” p. vi]
USDA ERS (Updated 1/10/25) Food Availability (Per Capita) Data System – Food Availability Documentation. [“This second series is considered preliminary because the underlying food loss assumptions and estimates require further improvement.”]
USDA (n.d.) Food Waste FAQs. [“The United States currently does not have a single baseline estimate of food loss and waste.”]
Muth, M. K., et al., (2018). Expert panel on technical questions and data gaps for the ERS loss-adjusted food availability (LAFA) data series, RTI International. https://ers.usda.gov/sites/default/files/_laserfiche/publications/92409/CCR-70.pdf?v=74302
USDA ERS (2024) Food Availability (Per Capita) Data System. Loss-Adjusted Food Availability. Meat, poultry, fish, eggs, and nuts. [Meat and eggs loss-adjusted figures were reported through 2019. Dairy loss-adjusted figures were continued through 2021.]
Caballero, S. V., et al., (2025). Results of Informal Discussions and Semistructured Interviews on Estimating Retail-Level Loss Factors for the Loss-Adjusted Food Availability (LAFA) Data Series (No. 349206). USDA ERS. p. 2.
While acknowledging “data limitations,” the EPA estimated food waste at ~66 million tons in 2019. They also calculated the weight at 349 pounds per capita.[1]
The non-profit ReFED estimates that in 2023, food waste equaled 63 million tons.[2,3]
U.S. EPA (April 2023) 2019 Wasted Food Report Estimates of generation and management of wasted food in the United States in 2019, EPA 530-R-23-005, p. vi and Table 3, p. 7; Table 7, p. 27.
ReFED (n.d.) Food Waste Data—Causes & Impacts. https://refed.org/food-waste/the-problem/#what_is_food_waste
Note: U.S. federal agencies have a “formal agreement” to collaborate with ReFED. See, EPA, USDA, FDA (2020) Relative to a Federal—Nongovernmental Organization Formal Agreement with ReFED, Inc. [“…a joint formal agreement committing to increase collaboration and coordination in areas of mutual interest relating to the reduction of food loss and waste.”]
The non-profit ReFED offers a yearly estimate of “surplus food” showing the total in 2023 equaling the total in 2016.[1] (Food waste is a subset of their surplus food category, estimated at about 85% in 2023.)
Food waste fell during the Covid-19 pandemic at both the household and food service levels.[2]
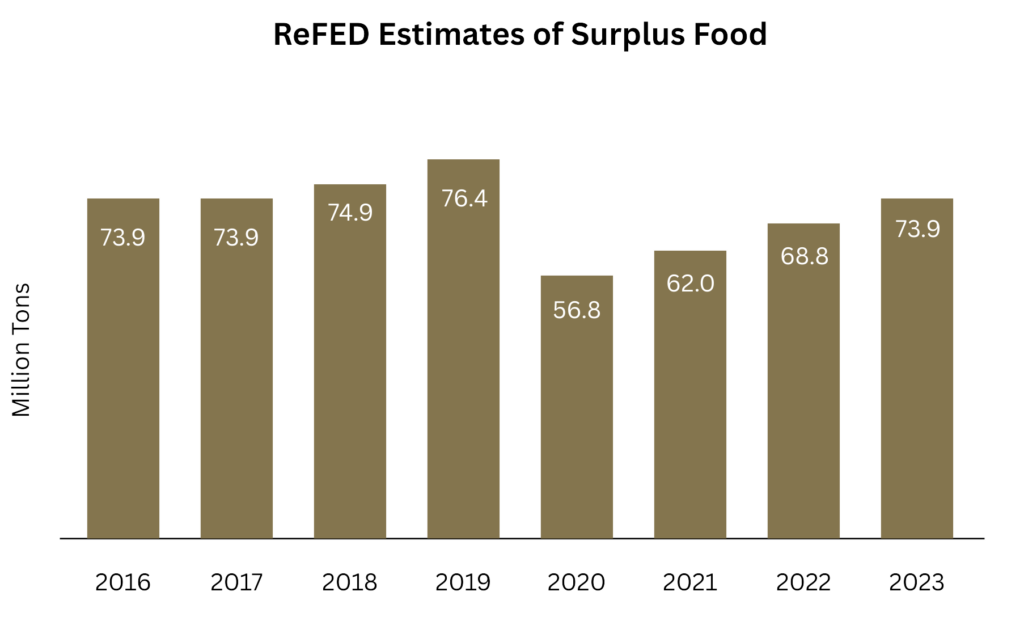
ReFED (2025) From Surplus to Solutions: 2025 ReFED U.S. Food Waste Report, Graph at p. 4. [“Numbers are now about level with where they were in 2016, the baseline year for the national goal to cut food waste in half by 2030.” Calculation of Food Waste: 63M tons / 73.9 = 85.3%]
ReFED Blog (March 20, 2025) Five Years Since COVID-19 Upended Our Food System. [“Some of the most drastic changes were in residential surplus food, which decreased from 24.2 million tons in 2019 to 10.4 million tons in 2020—a 57% reduction. Surplus food in foodservice decreased from 14.5 million tons in 2019 to 9.15 million tons in 2020, a reduction of more than 36%, likely driven by stay-at-home orders and restaurant closures.”]
A dated, though still regularly quoted USDA report (covering the year 2010), estimated that red meat, poultry, dairy, and eggs accounted for ~31% of total food waste.[1]
A recent report by non-profit ReFED estimated that in 2023 fresh meat and seafood, dairy, and eggs accounted for ~17% of “surplus food,” with additional shares within the categories of “prepared foods” and “frozen foods” (together totaling ~22%.)[2,3]
Buzby, J. C., et al., (2014) The Estimated Amount, Value, and Calories of Postharvest Food Losses at the Retail and Consumer Levels in the United States, USDA ERS, Bulletin No. 121, Table 1, p. 12. [This percentage is for total retail and consumer level loss, i.e., food waste as it is now defined. Estimates for meat and poultry are provided as boneless, edible weight, see, p. 25. Calculation: Dairy (25.4 billion lbs) + Meat (8.6) + Poultry (4.8) + Eggs (2.8) = 41.6 / 132.9 billion lbs. total food waste = 31.3%.]
ReFED Food Waste Monitor – All Sectors By Food Type in 2023. https://insights-engine.refed.org/food-waste-monitor?break_by=food_type&indicator=tons-surplus&view=detail&year=2023
ReFED (2025) From Surplus to Solutions: 2025 ReFED U.S. Food Waste Report, p. 2. [“Surplus Food: All food that goes unsold or unused by a business or that goes uneaten at home or restaurants—including food and inedible parts that are donated, fed to livestock animals, repurposed to produce other products, or go to any of the destinations represented in food waste.” Surplus food” incorporates a wider range of the food supply beyond that available at the retail and consumer level, with food waste equaling about 85% of surplus food in 2023.]
Using the USDA’s most recent estimate in 2019, about 28% of red meat loss occurred from retail to actual consumption (i.e., became food waste).[1] This is a broad estimate based on figures that, even in 2019, the USDA provided as “preliminary.”[2]
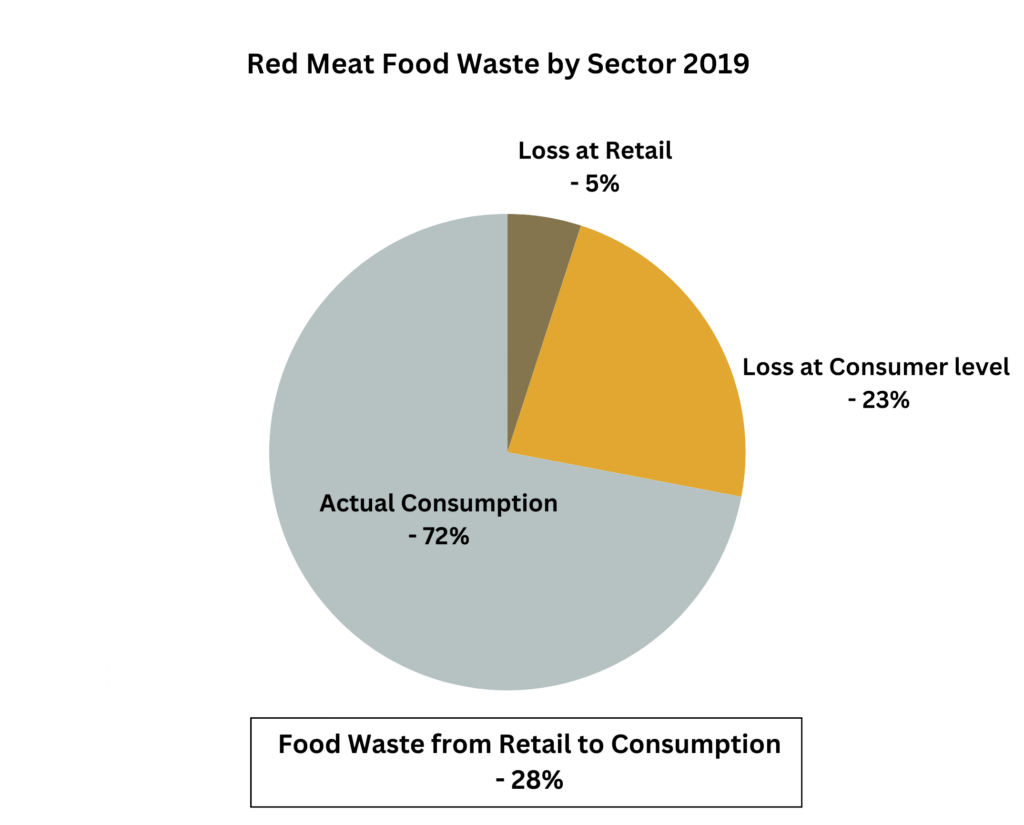
USDA Food Availability (Per Capita) Data System, Loss-Adjusted Food Availability Tables, see, Meat, poultry, fish, egg, and nuts, Table for Total red meat (includes beef, veal, port, and lamb) (data updated June 1, 2020) [Loss is measured from Retail weight (boneless or edible weight = 104.9 lbs.) through Per capita availability adjusted for all loss (includes loss in cooking and uneaten food = 76 lbs.)]
USDA Food Availability (Per Capita) Data System, Loss-Adjusted Food Availability Tables, see, Meat, poultry, fish, egg, and nuts [Footnote on each of the tables: “The loss factors presented here are preliminary estimates and are intended to serve as a starting point for additional research and discussion. We welcome suggestions to expand on and improve our loss estimates.” There have been no updated estimates since 2019.]
Using the USDA’s most recent estimate in 2019, about 21% of all poultry loss occurred from retail to actual consumption (i.e., became food waste).[1] This is a broad estimate based on figures that, even in 2019, the USDA provided as “preliminary.”[2]

USDA Food Availability (Per Capita) Data System, Loss-Adjusted Food Availability Tables, see, Meat, poultry, fish, egg, and nuts, Table for Total poultry (includes broilers, laying hens, and turkeys) (data updated June 1, 2020) [Loss is measured from Retail weight (boneless or edible weight = 79.4 lbs.) through Per capita availability adjusted for all loss (includes loss in cooking and uneaten food = 62.4 lbs.)]
USDA Food Availability (Per Capita) Data System, Loss-Adjusted Food Availability Tables, see, Meat, poultry, fish, egg, and nuts [Footnote on each of the tables: “The loss factors presented here are preliminary estimates and are intended to serve as a starting point for additional research and discussion. We welcome suggestions to expand on and improve our loss estimates.” There have been no updated estimates since 2019.]
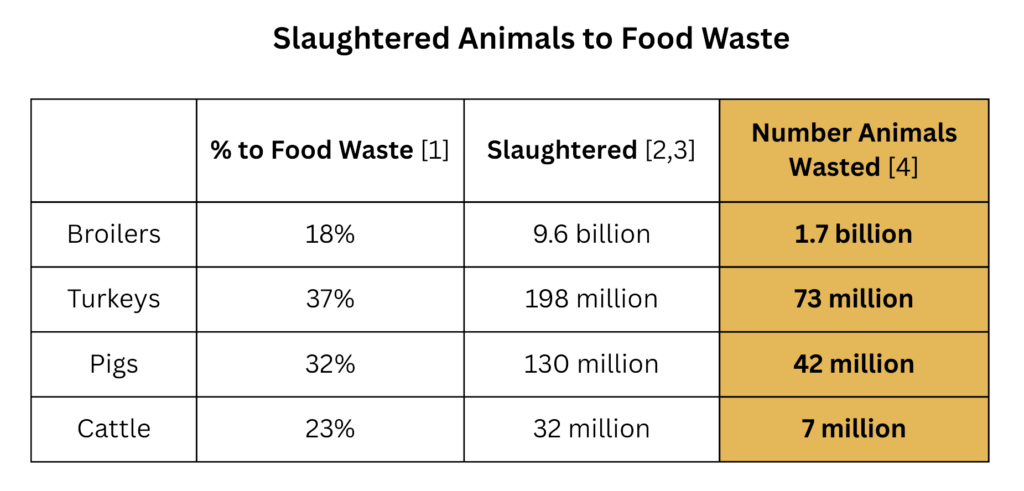
Of the 9.6 billion broiler chickens that were slaughtered for food in 2024, the meat from about 1.7 chickens ends up as food waste, or about 5 chickens per capita.[1-4]
For shares of animal-sourced food waste by animal type, see, Google sheet (based on USDA 2019 Loss-adjusted estimates) https://docs.google.com/spreadsheets/d/1ppnDkCw7lAoWB_rnRlcn2CPpR4Qf0N1s/edit?gid=2910956#gid=2910956
Poultry: USDA NASS (2025) Poultry Slaughter 2024 Summary, ISSN: 2159-7480, p. 5. [Broilers – 9,574,243,000. Turkeys – 197,994,000]
Livestock: USDA NASS (2025) Livestock Slaughter 2024 Summary, ISSN: 0499-0544, p. 8. [Pigs – 129,744,400. Cattle – 31,920,600]
Note: these are broad calculations given that some of this animal-sourced food is exported to countries that have different rates of food waste. Also, the figures do not include the many animals dying before slaughter who are a critical component of the industrialized system.
The EPA estimates that in 2019:![]() 40% was from households.
40% was from households.![]() 40% was from food service providers (e.g. restaurants, office buildings, hotels, and educational facilities).
40% was from food service providers (e.g. restaurants, office buildings, hotels, and educational facilities).![]() 20% was from food retailers.[1]
20% was from food retailers.[1]
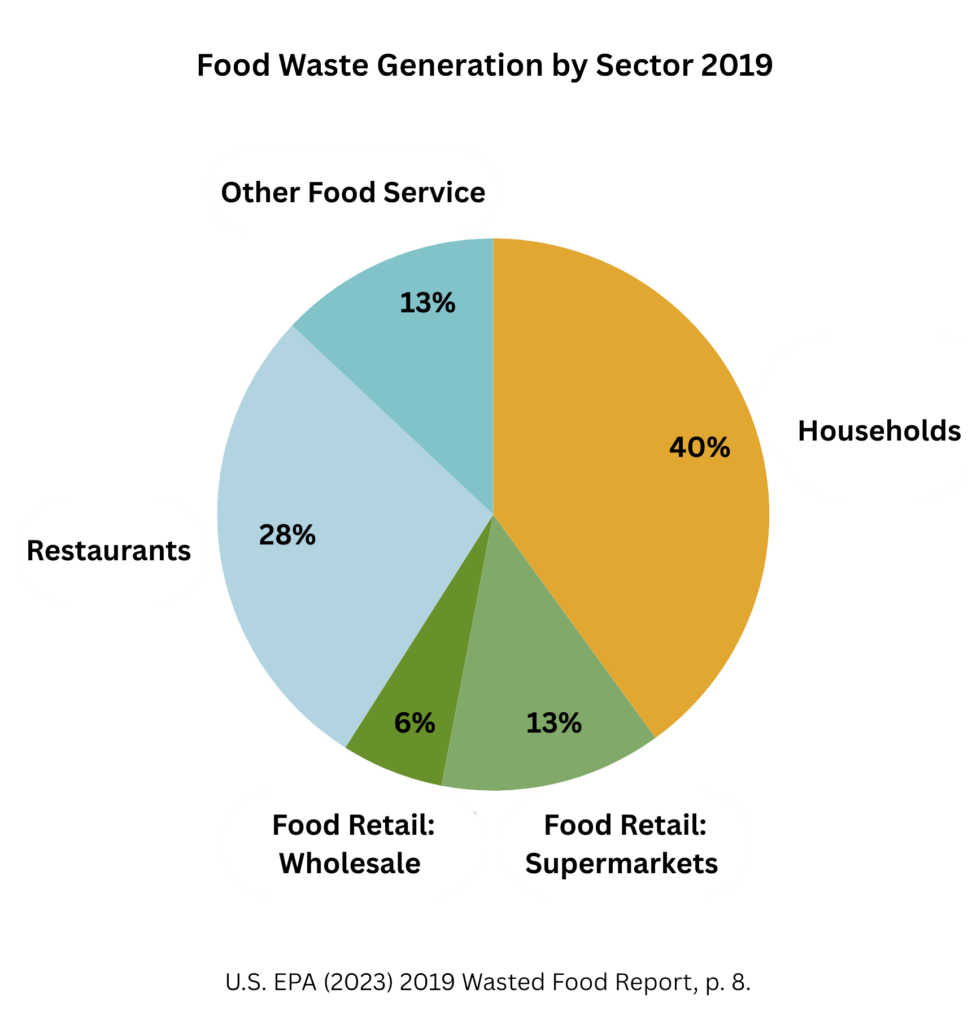
U.S. EPA (April 2023) 2019 Wasted Food Report Estimates of generation and management of wasted food in the United States in 2019, EPA 530-R-23-005, Table 3, p. 7.
Beyond stated goals and agreements to collaborate, there has been little progress.
In 2015, the USDA and EPA announced a joint goal to reduce food loss and waste by 50% by the year 2030.[1] In 2024, 3 agencies generated a national strategy report.[2] A “formal agreement” of collaboration was made that same year.[3]
However, the agencies are still struggling with insufficient funding, a lack of recycling infrastructure, and the need to improve data and estimation methodologies.[4-6] Uneaten food volumes appear to be stubbornly high.[7]
The agencies, along with ReFED, are collaborating on these issues, but “there are many obstacles, such as limited, nationally representative data on food loss and waste in some areas (e.g., on the farm and during production stages). Data gaps and limitations make it difficult to understand the extent and consequences of food loss and waste, track progress toward the national and international goals, and measure success.”[8]
U.S. EPA (updated January 3, 2025) United States 2030 Food Loss and Waste Reduction Goal. https://www.epa.gov/sustainable-management-food/united-states-2030-food-loss-and-waste-reduction-goal
EPA, USDA, FDA (2024) National Strategy for Reducing Food Loss and Waste and Recycling Organics.
FDA (2024) Formal Agreement among the USDA, EPA, FDA, and USAID relative to cooperation and coordination on food loss and waste.
EPA, USDA, FDA (2024) National Strategy for Reducing Food Loss and Waste and Recycling Organics , see, Challenges, pp. 7-8.
Caballero, S. V., et al., (2025). Results of Informal Discussions and Semistructured Interviews on Estimating Retail-Level Loss Factors for the Loss-Adjusted Food Availability, (LAFA) Data Series (No. 349206). USDA ERS, p. 2. [“Consequently, the overarching conclusion of the exploratory research is that there is insufficient information to recommend that ERS move forward with a nationally representative study on retail food loss at this time.”]
Li, R., et al., (2023) Household food waste trending upwards in the United States: Insights from a National Tracking Survey. Jnl of Agr & App Econ Assoc. 2:306–317, p. 307. [“Despite bipartisan support for food waste reduction, the US lacks federally implemented, regularly occurring quantitative measurements of food wasted at the household level, which is the single largest source of wasted food…”]
ReFED (2025) From Surplus to Solutions: 2025 ReFED U.S. Food Waste Report, p. 4. [“Numbers are now about level with where they were in 2016, the baseline year for the national goal to cut food waste in half by 2030.”]
EPA, USDA, FDA (2024) National Strategy for Reducing Food Loss and Waste and Recycling Organics, p. 8.