1. The primary cause of global and U.S. biodiversity loss is habitat loss, driven by agriculture.
2. Animal agriculture accounts for the largest share of agricultural impacts due to feed crop production and grazing.
3. Livestock grazing is the most widespread influence on native ecosystems of western North America. About 35% of land in the contiguous U.S. is used for grazing.
4. Land use for monoculture crops, along with the accompanying chemical pollution and outsized water use, is a major driver of habitat loss.
5. Other drivers include pollution, invasive species, and disease – each of which is influenced and amplified by land-use change.
Both philosophically and in practice, the factory farming of animals operates in direct opposition to the basic tenets of a biodiverse world.
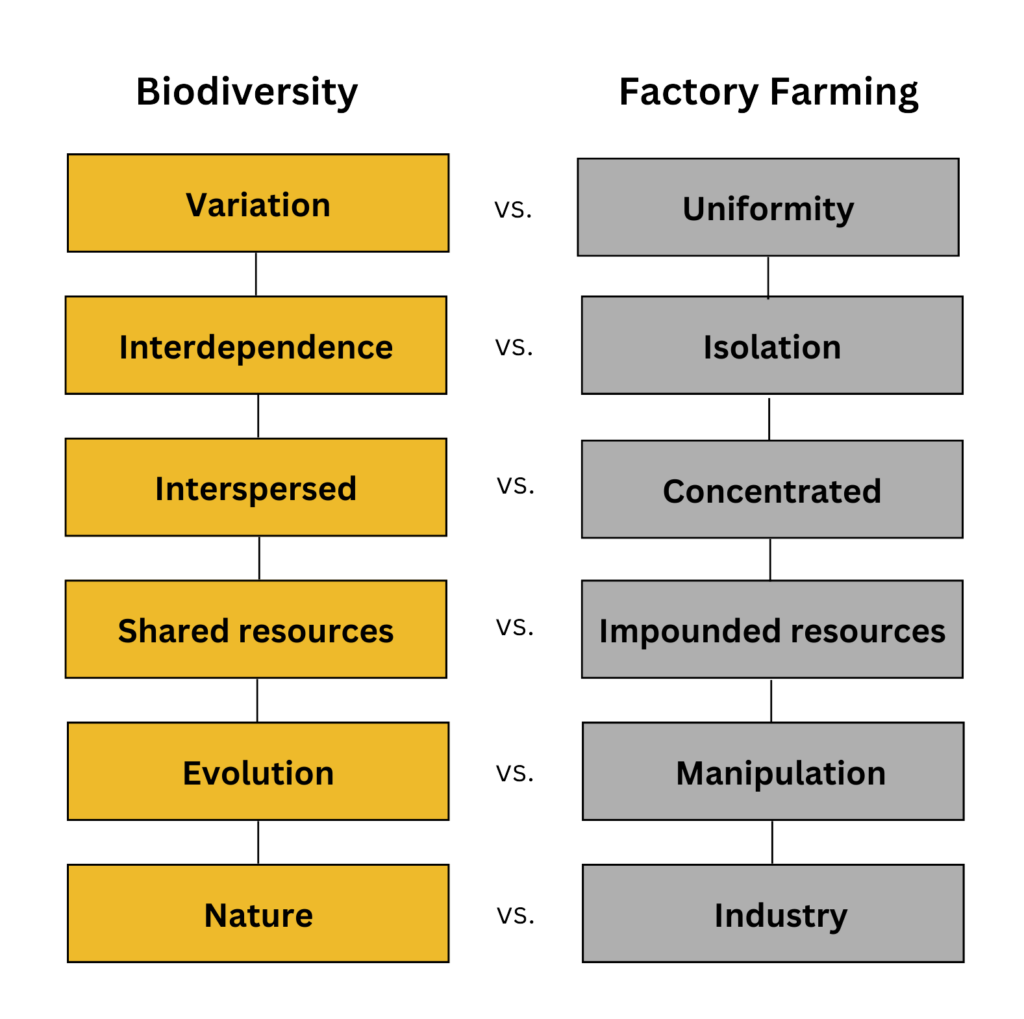
![]() Biodiversity thrives on a multitude of species. Factory farming is based on the standardization and uniformity of just a few types of animals and crops.[1,2]
Biodiversity thrives on a multitude of species. Factory farming is based on the standardization and uniformity of just a few types of animals and crops.[1,2]
![]() Biodiversity thrives on the interdependence of species. Factory farming concentrates and isolates farmed animals.[3,4]
Biodiversity thrives on the interdependence of species. Factory farming concentrates and isolates farmed animals.[3,4]
![]() Biodiversity relies on diverse food supplies. Factory farming depends on enormous quantities of 3 monoculture feed crops.[5]
Biodiversity relies on diverse food supplies. Factory farming depends on enormous quantities of 3 monoculture feed crops.[5]
![]() Biodiversity slowly evolves over millions of years. Factory farming aggressively manipulates genetics over decades.[6]
Biodiversity slowly evolves over millions of years. Factory farming aggressively manipulates genetics over decades.[6]
![]() Biodiversity requires shared access to resources. Factory farming impounds an ever greater share.[7-9]
Biodiversity requires shared access to resources. Factory farming impounds an ever greater share.[7-9]
Long, J. A., et al., (2019). Protecting food animal gene pools for future generations, Council for Agricultural Science and Technology, Issue Paper 65, p. 2. [“The highly specialized livestock industries in North America are dominated by a small number of productive breeds for which there is a concomitant downward trend in the effective number of breeding animals and a general contraction of genetic diversity, particularly in the commercial dairy and poultry breeds.”]
FAO (2019) The State of the World’s Biodiversity for Food and Agriculture, J. Bélanger & D. Pilling (eds.). FAO Commission on Genetic Resources for Food and Agriculture Assessments. Rome, p. 114. [“The world’s livestock production is based on about 40 animal species, with only a handful providing the vast majority of global output of meat, milk and eggs.”]
Leibler, J. H., et al., (2009) Industrial food animal production and global health risks: exploring the ecosystems and economics of avian influenza. EcoHealth, 6, 58-70. [“This article provides evidence suggesting that these industrial systems (confined food animal production) may increase animal and public health risks unless there is recognition of the specific biosecurity and biocontainment challenges of the industrial model.” at Abstract]
USDA APHIS (2024) Recommendations for Highly Pathogenic Avian Influenza (HPAI) H5N1 Virus in Livestock, p. 1. [“Producers should practice enhanced biosecurity, minimize animal movements, test animals before movement, and isolate animals moved on or off premises.”]
The 3 largest U.S. crops by acreage are primarily used for feed: corn, soybeans, and hay. See, Feed Crop Usage Overview
Torrey, S., et al., (2021). In pursuit of a better broiler: growth, efficiency, and mortality of 16 strains of broiler chickens. Poultry Science, 100(3), 100955, p. 1. [“Genetic selection has resulted in a larger, leaner, more efficient chicken that reaches a market weight of 2.1 kg weeks earlier than even 35 yr ago.”]
Cassidy, E. S., et al., (2013). Redefining agricultural yields: from tonnes to people nourished per hectare. Environmental research letters, 8(3), 034015. [Report estimates that U.S. crops allocated to animal feed incorporate 67% of total calories from all crops.]
Poore, J., & Nemecek, T. (2018). Reducing food’s environmental impacts through producers and consumers. Science, 360(6392), 987-992. [Report estimates that 38.5% of global harvested land is for animal feed (43.5% if not including non-food crops like biofuels).]
See, Farmed Animal Biomass and Biodiversity [Globally, the biomass of land mammals raised for food is about 25 times the size of wild land mammals. Farmed bird biomass is about 2.5 times the size of all wild bird biomass. Animal biomass (i.e., aggregated weight) is a reasonable marker for the underlying drain on resources.]
Habitat loss – In the U.S. as well as globally, it is commonly understood that habitat loss, mostly due to agriculture, is the major driver of biodiversity loss. Less commonly understood is that animal ag is clearly the largest share of those agricultural impacts.[1]
Pollution – Agricultural pollutants are also understood to be a major driver of biodiversity loss. Again, less commonly understood, is that animal ag is by far the largest contributor to pollution via manure dispersal, nutrient pollution of air and water, herbicides and pesticides on feed crops, and a wide variety of other contaminants from factory farming, including antibiotics and other pharmaceuticals.
IAs detailed on this page and others in this section, the major animal ag drivers of U.S. biodiversity loss are:
![]() Land used for feed crops – most U.S. cropland is used to feed farmed animals, reducing habitat for native plants and animals.
Land used for feed crops – most U.S. cropland is used to feed farmed animals, reducing habitat for native plants and animals.![]() Land used for grazing – enormous areas are devoted to grazing, causing increased land degradation.
Land used for grazing – enormous areas are devoted to grazing, causing increased land degradation. ![]() Nutrient pollution from concentrated manure – causing air and water pollution and the eutrophication of waterways.
Nutrient pollution from concentrated manure – causing air and water pollution and the eutrophication of waterways.![]() Nutrient pollution from chemical fertilizers on feed crops – also causing air and water pollution.
Nutrient pollution from chemical fertilizers on feed crops – also causing air and water pollution.![]() Herbicides on feed crops – damaging a wide array of target and non-target plants and the animals that rely on them.
Herbicides on feed crops – damaging a wide array of target and non-target plants and the animals that rely on them.![]() Insecticides on feed crops – damaging a wide array of target and non-target insects and pollinators, and the plants and animals that rely on them.
Insecticides on feed crops – damaging a wide array of target and non-target insects and pollinators, and the plants and animals that rely on them.![]() Water usage – is diverted from waterways and groundwater to support feed crops, shrinking aquatic habitats.
Water usage – is diverted from waterways and groundwater to support feed crops, shrinking aquatic habitats. ![]() Livestock and feed crop protection – wild animals are hunted, trapped, and poisoned.
Livestock and feed crop protection – wild animals are hunted, trapped, and poisoned.
Note: For the points in this summary, see details and references in the following questions and pages.
The most highly cited ranking of global drivers is from the IPBES which suggests the following prioritized list:[1]
1. Land use change resulting in habitat loss, with agricultural expansion the most widespread form.
2. Direct exploitation of organisms via harvesting, logging, hunting, and fishing.
3. Climate change.
4. Pollution of air, water, and soil.
5. Invasion of alien species.
Many other reports broadly support this ranking.[2-5]
IPBES (2019) Global assessment report of the Intergovernmental Science-Policy Platform on Biodiversity and Ecosystem Services, Summary for Policymakers, Brondízio, E. S., et al., (eds). IPBES secretariat, Bonn, Germany, p. 12. [Note that the land use change category also includes sea use change. “The direct drivers of change in nature with the largest global impact have been (starting with those with most impact): changes in land and sea use; direct exploitation of organisms; climate change; pollution; and invasion of alien species.”]
Jaureguiberry, P., et al., (2022). The direct drivers of recent global anthropogenic biodiversity loss. Science advances, 8(45), eabm9982, p. 3. [“We have shown clearly that land/sea use change—mainly in the form of rapid expansion and intensifying management of land used for cropping or animal husbandry—and direct exploitation—mostly through fishing, logging, hunting, and wildlife trade —have been the two dominant drivers of global biodiversity loss overall over recent decades.”]
Maxwell, S. L., et al., (2016). Biodiversity: The ravages of guns, nets and bulldozers. Nature, 536(7615), 143-145, p. 143. [“We found that by far the biggest drivers of biodiversity decline are overexploitation (the harvesting of species from the wild at rates that cannot be compensated for by reproduction or regrowth) and agriculture (the production of food, fodder, fibre and fuel crops; livestock farming; aquaculture; and the cultivation of trees).”]
Tilman, D., et al., (2017). Future threats to biodiversity and pathways to their prevention. Nature, 546(7656), 73-81. pp. 73-74 and Figure 1. [Prioritizes habitat loss, hunting (overexploitation), invasive species, water pollution, exotic diseases, and climate change.]
Rosa L., et al., (2023) Biodiversity in Crisis: Exploring Threats to America’s Most Imperiled Species. Defenders of Wildlife, p. 5. [This report evaluates those 5 drivers according to the impacts on U.S. species listed as endangered under the Endangered Species Act.]
Yes. Globally, agriculture is widely reported as the primary driver of biodiversity loss.[1-7]
Campbell, B. M., et al., (2017). Agriculture production as a major driver of the Earth system exceeding planetary boundaries. Ecology and society, 22(4). [“In the absence of better information, we suggest 80% as the role of agriculture in the status of the biosphere integrity.” “Thus agriculture has shifted biosphere integrity beyond the PB (planetary boundary).” Biosphere integrity refers to rates of extinction and reductions in populations.]
Tilman, D., et al., (2017). Future threats to biodiversity and pathways to their prevention. Nature, 546(7656), 73-81. [“About 80% of all threatened terrestrial bird and mammal species are imperilled by agriculturally driven habitat loss (Fig. 1a).”]
Díaz, S., et al., (2019). Pervasive human-driven decline of life on Earth points to the need for transformative change. Science, 366(6471), eaax3100. [“Within terrestrial and freshwater ecosystems, the driver (of biodiversity loss) with the highest relative impact is land use change, mainly land conversion for cultivation, livestock raising, and plantations.” at p. 4. This report distills the major findings of the IPBES (2019) Global assessment report.]
Bajželj, B., et al., (2014). Importance of food-demand management for climate mitigation. Nature Climate Change, 4(10), 924-929. [“However, agriculture is the main driver of losses of biodiversity…” Abstract]
Rockström, J., et al., (2025). The EAT–Lancet Commission on healthy, sustainable, and just food systems. The Lancet, 406(10512), 1625-1700, p. 1643. [“Agricultural systems, particularly extensive monocultures, are the single largest drivers of both biosphere and ecosystem functional integrity loss…”]
Cox, N., et al., (2022). A global reptile assessment highlights shared conservation needs of tetrapods. Nature, 605(7909), 285-290. p. 288. [“For all tetrapod groups, agriculture threatens the most species…”]
Sánchez-Bayo, F., & Wyckhuys, K. A. G. (2019). Worldwide decline of the entomofauna: A review of its drivers. Biological Conservation, 232, 8–27, p. 8. [“Habitat change and pollution are the main drivers of such (insect) declines. In particular, the intensification of agriculture over the past six decades stands as the root cause of the problem…”]
Yes, almost certainly, although we are not aware of definitive statements. Given the following facts, it should be clear that agriculture is the primary driver of biodiversity loss in the U.S.
![]() Globally, agriculture is widely acknowledged as the primary driver (as noted above).
Globally, agriculture is widely acknowledged as the primary driver (as noted above).![]() Agricultural lands take up ~55% of the contiguous U.S.[1]
Agricultural lands take up ~55% of the contiguous U.S.[1]![]() According to Nature Serve, the most credible evaluator of U.S. biodiversity loss, agriculture and water pollution trail only “invasive species and disease” as the primary drivers. And invasive species and disease are considered indirect drivers that are influenced and often amplified by direct drivers from agriculture.[2]
According to Nature Serve, the most credible evaluator of U.S. biodiversity loss, agriculture and water pollution trail only “invasive species and disease” as the primary drivers. And invasive species and disease are considered indirect drivers that are influenced and often amplified by direct drivers from agriculture.[2]![]() According to World Wildlife Fund’s Living Planet Index habitat loss is the key driver of biodiversity loss in North America with food production considered the leading cause.[3]
According to World Wildlife Fund’s Living Planet Index habitat loss is the key driver of biodiversity loss in North America with food production considered the leading cause.[3]
Winters-Michaud, C., et al., (2024) Major Uses of Land in the United States, 2017, USDA ERS Bulletin No. 275, Table 1, p. 5. [Grazing on 671M acres / 1891 = ~35%. 377M acres / 1891 = 19.9%.]
NatureServe (2023) Biodiversity in Focus: United States Edition. NatureServe: Arlington, VA, p. 16. [See the following question]
World Wildlife Fund (2024) Living Planet Report 2024 – A System in Peril. WWF, Gland, Switzerland, p. 63.
Yes, almost certainly, though we are not aware of definitive statements.[1] Consider the following:
![]() Globally, agriculture is considered the primary driver of biodiversity loss, responsible for as much as 80% of all losses.[2,3]
Globally, agriculture is considered the primary driver of biodiversity loss, responsible for as much as 80% of all losses.[2,3]![]() Animal ag accounts for ~80% of U.S. agricultural lands and ~45% of total U.S. contiguous land.[4]
Animal ag accounts for ~80% of U.S. agricultural lands and ~45% of total U.S. contiguous land.[4]![]() About 35% of total land is used for grazing, and more than half of harvested crops are used specifically for animal feed.[5]
About 35% of total land is used for grazing, and more than half of harvested crops are used specifically for animal feed.[5]![]() Animal ag accounts for ~40% of total U.S. water consumption, creating scarcity, intensifying pollution, and driving the loss of species in fresh and coastal waterways and groundwater ecosystems.[6]
Animal ag accounts for ~40% of total U.S. water consumption, creating scarcity, intensifying pollution, and driving the loss of species in fresh and coastal waterways and groundwater ecosystems.[6]![]() Manure and chemical fertilizers on feed crops together make up the main driver of nutrient pollution, the key source of water pollution and likely the central threat to aquatic species.[7]
Manure and chemical fertilizers on feed crops together make up the main driver of nutrient pollution, the key source of water pollution and likely the central threat to aquatic species.[7]![]() The two most common herbicides, glyphosate and atrazine, are mostly used on corn and soybeans.[8]
The two most common herbicides, glyphosate and atrazine, are mostly used on corn and soybeans.[8]![]() Animal ag accounts for about half of all neonic applications, which are unusually damaging to biodiversity.[9]
Animal ag accounts for about half of all neonic applications, which are unusually damaging to biodiversity.[9]
Assessing biodiversity loss is an unusually complex subject, given the millions of species and myriad influences. Despite that complexity, we think that a fair reading of the following pages will show that any discussion of biodiversity loss in the U.S. must start with the factory farm system of feed crops, manure management, and grazing.
Note: Globally, at least one highly cited report makes this claim: Machovina, B., et al., (2015). Biodiversity conservation: The key is reducing meat consumption. The Science of the Total Environment, 536, 419–431, p. 420. [“Though difficult to quantify, animal product consumption by humans (human carnivory) is likely the leading cause of modern species extinctions…”]
Campbell, B. M., et al., (2017). Agriculture production as a major driver of the Earth system exceeding planetary boundaries. Ecology and society, 22(4). [“In the absence of better information, we suggest 80% as the role of agriculture in the status of the biosphere integrity.” Biosphere integrity refers to rates of extinction and reductions in populations.]
Tilman, D., et al., (2017). Future threats to biodiversity and pathways to their prevention. Nature, 546(7656), 73-81 [“About 80% of all threatened terrestrial bird and mammal species are imperilled by agriculturally driven habitat loss.”]
See, Animal Ag Land Use Pressure on Biodiversity
See, Animal Ag Land Use Pressure on Biodiversity
See, Animal Ag Water Use Pressure on Biodiversity
See, Fertilizer & Manure Harm to Biodiversity
See, Herbicide Harm to Biodiversity
See, Insecticide (Neonics) Harm to Biodiversity
Nature Serve offers the following evaluation highlighting invasive species, agriculture, and pollution.[1]

Although invasive species and disease are often assessed as direct drivers, there is evidence that they are to a large degree influenced and amplified by land-use change and other direct drivers, and therefore more of an indirect rather than a direct driver.[2,3]
NatureServe (2023) Biodiversity in Focus: United States Edition. NatureServe: Arlington, VA, p. 16.
IPBES (2023). Summary for Policymakers of the Thematic Assessment Report on Invasive Alien Species and their Control of the Intergovernmental Science-Policy Platform on Biodiversity and Ecosystem Services. Roy, H. E., et. al., (eds.) IPBES secretariat, Bonn, Germany, p. 28. [“Accelerated establishment and spread of invasive alien species within countries are primarily driven by direct drivers, notably changes in land- and sea-use.”]
Kumar Rai, P., & Singh, J. S. (2020). Invasive alien plant species: Their impact on environment, ecosystem services and human health. Ecological Indicators, 111, 106020. [“Modern intensive agriculture managed for food security, however, has remarkably increased the spread of IAPS (invasive alien plant species).”]
World Wildlife Fund’s Living Planet Index presents the top 3 drivers for North American animal species as habitat loss, overexploitation, and pollution. They note that, “Food production is the leading cause of habitat destruction on land, driving biodiversity loss and greenhouse gas emissions.”[1]

WWF (2024) Living Planet Report 2024 – A System in Peril. WWF, Gland, Switzerland, p. 29.
According to the National Wildlife Federation, “the leading threats to wildlife are loss and degradation of habitat, invasive species, disease, and chemical pollution.”[1]
According to a highly cited, though dated, report by experienced researchers, “Not surprisingly, habitat destruction and degradation emerged as the most pervasive threat to biodiversity, contributing to the endangerment of 85% of the species we analyzed.”[2]
A report from Defenders of Wildlife estimates that for species listed as endangered under the Endangered Species Act, climate change and habitat loss are the primary threats, impacting 92% and 88% of listed species respectively, followed by invasive species and pollution.[3]
Stein, B. A., et al., (2018). Reversing America’s Wildlife Crisis: Securing the Future of Our Fish and Wildlife. Washington, DC: National Wildlife Federation, p. 4.
Wilcove, D. S., et al., (1998). Quantifying threats to imperiled species in the United States. BioScience, 48(8), 607-615, p. 610. [The forms of habitat destruction “include agriculture (affecting 38% of endangered species), commercial development (35%), water development (30% when agricultural diversion is included; 17% for just dams, impoundments, and other barriers), and infrastructure development 17%).”]
Rosa L., et al., (2023) Biodiversity in Crisis: Exploring Threats to America’s Most Imperiled Species. Defenders of Wildlife, p. 19 and Figure 3. [On average, species are impacted by 2.7 individual threats.]
The factory farming system plays a key role in each of the primary drivers of biodiversity loss. Even a well-endowed nation has finite usable space and resources. Currently an immense share of that space and resources (land, water, fertile soil) are supporting farmed animals, forcing all other species to fight for survival on steadily smaller shares.[1] Making that battle harder, much of the land and resources that is not used to raise farmed animals is polluted by the practices of the factory farming system.
![]() Habitat loss – Animal ag is the single largest user of land, allocated to both feed crops and grazing. As of 2017, about 35% of land in the contiguous U.S. was used for grazing and ~20% for crops.[2] Of all crop acres harvested, more than 50% is used to grow animal feed.[3] New land conversions, especially on biologically diverse and marginal lands, is usually for corn and soybeans (crops primarily used for feed).[4-6]
Habitat loss – Animal ag is the single largest user of land, allocated to both feed crops and grazing. As of 2017, about 35% of land in the contiguous U.S. was used for grazing and ~20% for crops.[2] Of all crop acres harvested, more than 50% is used to grow animal feed.[3] New land conversions, especially on biologically diverse and marginal lands, is usually for corn and soybeans (crops primarily used for feed).[4-6]
![]() Pollution – The wide array of chemical fertilizers, insecticides, and herbicides that are central to feed crop production are damaging land, soil, air, and water, and degrading the environment for all species. Factory farm manure is also a substantial contribution to habitat degradation. Nutrient pollution and its accompanying eutrophication, along with the onslaught of pesticides has polluted almost half of the waterways in the U.S., putting stress on every type of organism, and particularly on aquatic species.[7]
Pollution – The wide array of chemical fertilizers, insecticides, and herbicides that are central to feed crop production are damaging land, soil, air, and water, and degrading the environment for all species. Factory farm manure is also a substantial contribution to habitat degradation. Nutrient pollution and its accompanying eutrophication, along with the onslaught of pesticides has polluted almost half of the waterways in the U.S., putting stress on every type of organism, and particularly on aquatic species.[7]
![]() Overexploitation – Although usually defined as unsustainable hunting or harvesting, the term can also be applied to the exploitation of natural resources, or “resource extraction.”[8] Crops primarily going to animal feed (corn, soybeans, and hay) use huge amounts of fresh water from at-risk ecosystems in the U.S., often depleting lakes, rivers, and streams.[9]
Overexploitation – Although usually defined as unsustainable hunting or harvesting, the term can also be applied to the exploitation of natural resources, or “resource extraction.”[8] Crops primarily going to animal feed (corn, soybeans, and hay) use huge amounts of fresh water from at-risk ecosystems in the U.S., often depleting lakes, rivers, and streams.[9]
![]() Climate Change – Animal ag’s contribution to GHG emissions accounts for ~7% of total U.S. GHG emissions.[10]
Climate Change – Animal ag’s contribution to GHG emissions accounts for ~7% of total U.S. GHG emissions.[10]
![]() Invasive species and disease – Invasive species are generally introduced by human activities. However, they generally take hold and are spread by other direct drivers, especially land use change including agriculture.[11,12]
Invasive species and disease – Invasive species are generally introduced by human activities. However, they generally take hold and are spread by other direct drivers, especially land use change including agriculture.[11,12]
Biomass is an important marker of resource use. Although we are not aware of a biomass comparison of wild and farmed animals in the U.S., a quick calculation of farmed animal biomass versus human biomass in the U.S. shows that the supported population of farmed animals weighs ~1.5 times the biomass of humans. See, Farmed Animal Biomass and Biodiversity
Winters-Michaud, C., et al., (2024) Major Uses of Land in the United States, 2017, USDA ERS Bulletin No. 275, Table 1, p. 5. [803M acres / 1891 = 42.5%. 377M acres / 1891 = 19.9%.]
See, Total Feed Crops Share
Lark, T. J., et al., (2020). Cropland expansion in the United States produces marginal yields at high costs to wildlife. Nature communications, 11(1), 4295. [“Corn was the predominant crop planted on newly cultivated land; it was most common in all years except 2014–15, when soybeans were more prevalent. Together with wheat, these three crops were the first plantings on over 78% of all new croplands nationwide.” at p. 3. “Our findings demonstrate a pervasive pattern of encroachment into areas that are increasingly marginal for production, but highly significant for wildlife, and suggest that such tradeoffs may be further amplified by future cropland expansion.” Abstract]
Faber, S., et al., (2012) Plowed Under: How Crop Subsidies Contribute to Massive Habitat Losses, Environmental Working Group & Defenders of Wildlife, p. 3. [“Of the 23.7 million acres, more than 8.4 million were converted to plant corn, more than 5.6 million to raise soybeans and nearly 5.2 million to grow winter wheat.” About 59% are corn and soybeans.]
Craig Cox & Soren Rundquist (2013) Going, going, gone! Millions of Acres of Wetlands and Fragile Land Go Under the Plow, Environmental Working Group , p. 5. [“Corn and soybeans were planted on 60 percent (612,000 acres) of the wetland and wetland buffer acres appropriated for row crop production in hotspot counties.”]
See the following pages in this section on Biodiversity Loss due to Fertilizers, Herbicides and Insecticides, and Pollution of Lakes, Rivers, & Streams. See also, NatureServe (2023) Biodiversity in Focus: United States Edition. NatureServe: Arlington, VA, p. 11. [“As a group, species associated with fresh water, including amphibians, snails, mussels, crayfish, and many aquatic insects, have the highest percentage of at-risk species, highlighting the importance of conservation strategies to protect freshwater ecosystems.”]
IPBES (2019). Global Assessment Report on Biodiversity and Ecosystem Services. Brondizio, et. al., (eds.). IPBES secretariat, Bonn, Germany, p. 121. [See: Rates of extraction of living and non-living materials from nature. “Depletion of water resources interacts with many biophysical and societal drivers to contribute to negative impacts on nature and societies.”]
As one example, see, Richter, B. D., et al., (2024). New water accounting reveals why the Colorado River no longer reaches the sea. Communications Earth & Environment, 5(1), 134, p. 6. [“…we find that irrigated agriculture consumes half (52%) of all Colorado River Basin water, and the portion of direct consumption going to cattle-feed crops (is) 46% in this revised analysis.”]
See, Animal Ag GHG Emissions
IPBES (2023). Summary for Policymakers of the Thematic Assessment Report on Invasive Alien Species and their Control of the Intergovernmental Science-Policy Platform on Biodiversity and Ecosystem Services. Roy, H. E., et. al., (eds.) IPBES secretariat, Bonn, Germany, p. 28. [“Accelerated establishment and spread of invasive alien species within countries are primarily driven by direct drivers, notably changes in land- and sea-use.”]
Rai, P. K., & Singh, J. S. (2020). Invasive alien plant species: Their impact on environment, ecosystem services and human health. Ecological indicators, 111, 106020, p. 2. [“Modern intensive agriculture managed for food security, however, has remarkably increased the spread of IAPS (invasive alien plant species).”]
Livestock grazing is the most widespread influence on native ecosystems of western North America.[1] About 35% of land in the contiguous U.S. is used for grazing.[2]
The BLM and USDA provide national assessments that document high levels of compromised grazing lands, with many assessments noting the loss of “biotic integrity” and the spread of invasive species.[3] These trends are expected to accelerate with the increasing effects of climate change, drought, and wildfires.[4]
The fencing of grazing areas, designed primarily to restrict movement of livestock, threatens many species by fragmenting their habitat, hindering migration, and blocking them from essential resources like water. It is estimated that ~75% of migration routes for ungulates (hooved animals) have been lost in or adjacent to the Greater Yellowstone region.[5] “When fences severely fragment an ecosystem, wildlife populations become isolated, reducing genetic exchange, diversity, and individual and population fitness.”[6]
Thomas L. Fleischner (1994) Ecological Costs of Livestock Grazing in Western North America, Conservation Biology, Vol 8, No.3, 629-644, p. 630.
Winters-Michaud, C., et al., (2024) Major Uses of Land in the United States, 2017, USDA ERS Bulletin No. 275, Table 1, p. 5. [803M acres / 1891 = 42.5%. 377M acres / 1891 = 19.9%.]
See, Land Degradation & Grazing
Reeves, M., et. al., (2023) Rangeland Resources. In: USDA Forest Service (2023). Future of America’s Forest and Rangelands: Forest Service 2020 Resources Planning Act Assessment. Gen. Tech. Rep. WO-102, 8-1–8-33, Chapter 8. [“Prolonged droughts in the Southwestern United States and California are creating novel conditions that have not been experienced since well before Euro-American settlement. These conditions are expected to occur with greater frequency in the future, creating ecological, social, and economic challenges.”]
Segar, J. & Keane, A. (2020). Species and demographic responses to wildlife‐friendly fencing on ungulate crossing success and behavior. Conservation Science and Practice, 2(10), p. 1. [“An important driver of fragmentation is the increasing use of fencing, the effects of which on wild, migratory animals or those with large ranges has been highlighted as a major, emerging issue for global biological diversity.”]
Jakes, A. F., et al., (2018). A fence runs through it: A call for greater attention to the influence of fences on wildlife and ecosystems. Biological Conservation, 227, 310–318, p. 313.