Approximately 2.56 billion farmed land animals raised for food were in inventory in the U.S. in 2022.
The most comprehensive figures on farmed animals alive at a given point in time are in the inventory tables of the Census of Agriculture, last released for 2022.[1-3] This is a snapshot of end-of-year inventory as of December 2022.[4]
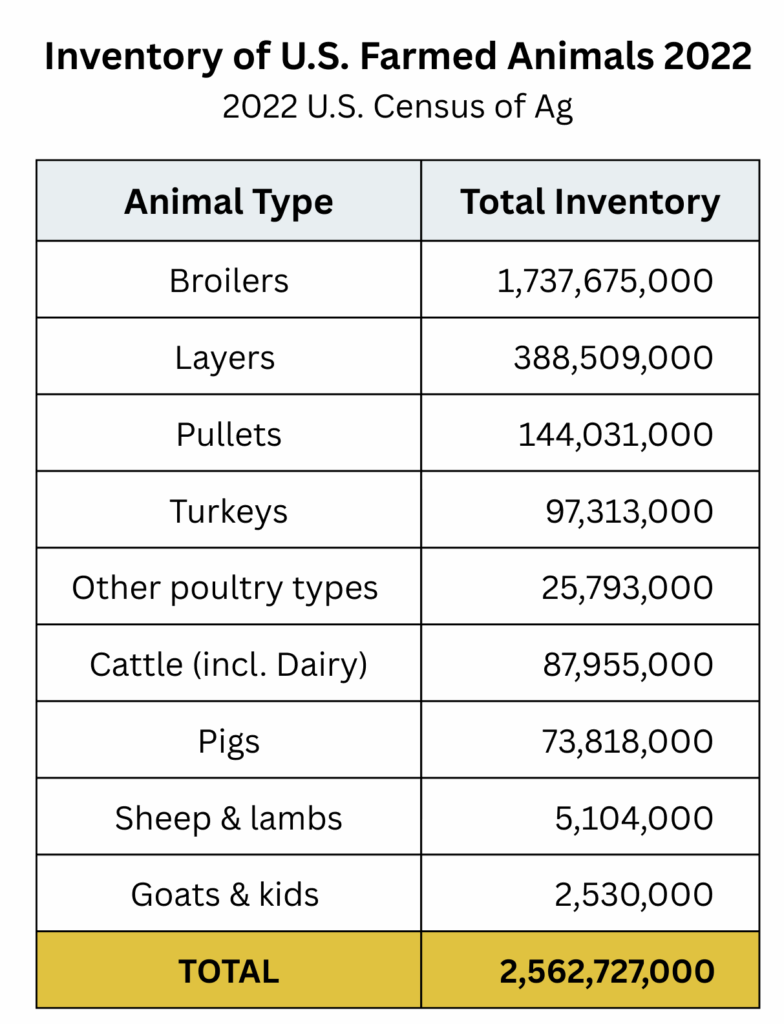
USDA (2024) 2022 Census of Agriculture, United States Summary and State Data, AC-17-A-51, Cattle Table 12; Hogs & Pigs Table 19; Sheep & Lambs Table 27; Poultry Table 30. Figures are rounded to the nearest thousand.
Notes on animal types: Layers include all egg-laying hens for table eggs and for broiler production. Pullets are young female chickens who have not yet started to lay eggs. Other poultry types include ducks, pheasant, roosters, quail, and chukars. This is not a comprehensive listing of all farmed animals; it does not include, for example, rabbits, bison, and various types of poultry with inventory totals of less than 1 million.
Note that an analysis of November and December monthly average broiler hatching figures from 2021-2024 were almost identical (99.6%) to the average hatching figures throughout the year. So, inventory from 12/31/22 (from the Census of Ag) should generally be reflective of broiler inventory throughout the year. For other types of animals, we did not investigate possible seasonal fluctuations in numbers.
USDA (2024) 2022 Census of Agriculture, United States Summary and State Data, AC-17-A-51, p. viii. [“Livestock, poultry, machinery and equipment inventories, and market value of land and buildings are measured as of December 31 of the census year.”]
Approximately 2.53 billion farmed land animals raised for food were in inventory in the U.S. as of January 1, 2025.[1-3]
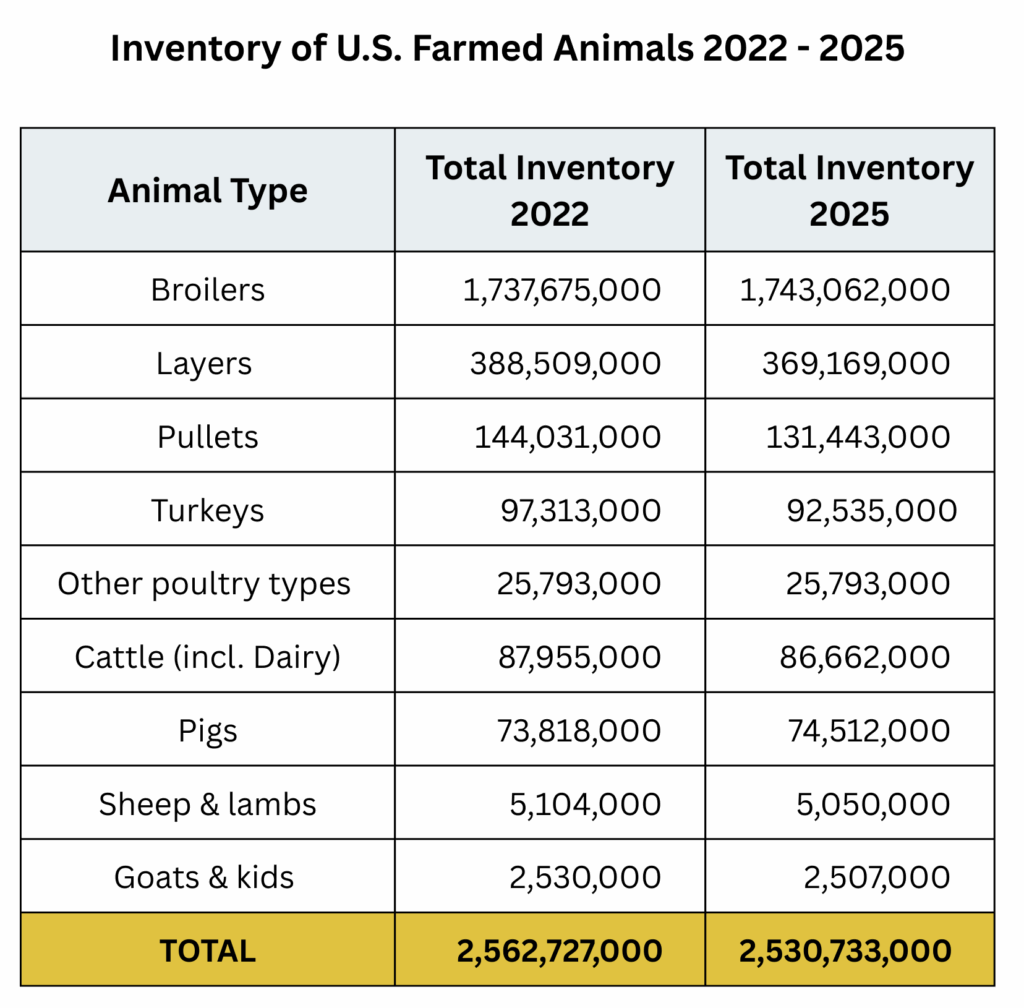
For 2022 figures from the Census of Ag, see previous question. Figures are rounded to the nearest thousand.
For 2025 figures, including some inventory estimates based on changes in yearly slaughter figures, see Google Sheet – U.S. Farmed Animal Inventory 2025 https://docs.google.com/spreadsheets/d/1ydXZBf8RMs3wZftdSshv6PD7w9LBdYkJKoIoKvJ4WVs/edit?usp=sharing
Note: The overall ~1.25% decrease in 2025 is mostly due to fewer egg-laying hens, pullets, and turkeys. This is likely because of mass killings for avian flu.
Broadly estimated, for each American there are 5 factory farmed broiler chickens alive at a given point in time.[1]
Each American has one hen actively laying eggs for them.[2]
For an American family of five, one pig is being raised for meat.[3] For a congregation of 75 parishioners, there’s one sow at some stage in the breeding process.[4]
Per family of five, one beef cow or steer is out on the range or on a feedlot.[5] One dairy cow is making milk products for about 25 people.[6]
Calculation: 1.743 billion / 342 million people = 5.1 chickens. We eat about 28 chickens per person per year.
Of the 369 million egg laying hens, about 304 million are table-egg layers, or about 89% of a hen per capita (304/342 million population). The average egg-laying hen produces about 300 eggs per year, with about 275 eggs consumed per capita per year.
Calculation: 74.5 million pigs minus 6 million sows = 68.5 million raised for meat. 68.5M / 342M = .2 pigs per person or 5 people per pig.
Calculation: Of the ~6 million breeding pigs, about 4.5 million are sows. (About a quarter are gilts.) 4.5M / 342 million people = .013 sows per person x 75 = 1 sow.
Calculation: 86.6 million cattle minus 13.2 dairy cows = 73.4 million / 342 million = .21 per person or ~ 1 per 5 people.
Calculation: ~13.2 million dairy cows / 342 million people = .039 per person x 25 = 1 cow.
Worldwide, approximately 34.5 billion farmed land animals were in inventory in 2023.
The most comprehensive figures on farmed land animal inventories are provided by the FAO, last released for 2023.[1-4]
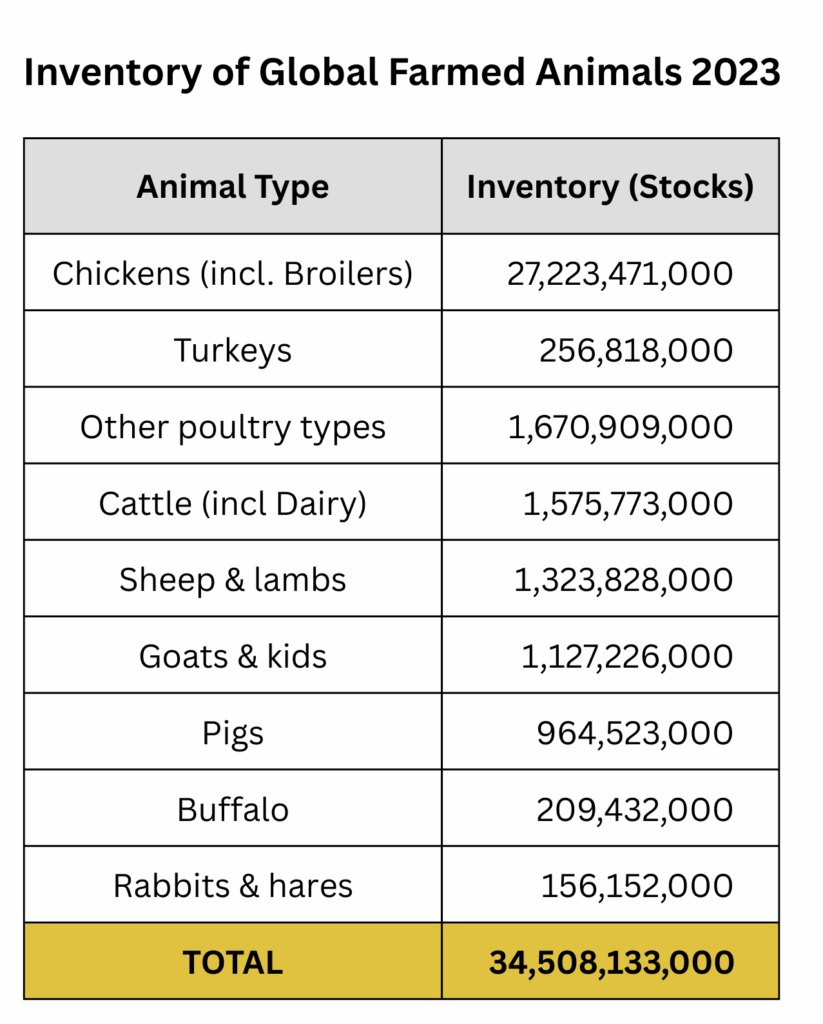
FAOSTAT Crops and livestock production, World, Stocks Live Animals (Accessed on 11/4/25) License: CC-BY-4.0. Note: The FAO uses the term “stocks” referring to the total count or inventory of animals (such as cattle, pigs, sheep, goats, poultry, etc.) that are present and alive at a specific point in time. Figures are rounded to the nearest thousand. See, FAO (June 2018) Guidelines on methods for estimating livestock production and productivity, Table 4.1, Table 4.7. https://openknowledge.fao.org/server/api/core/bitstreams/a7548126-efdc-459f-9742-e86ac3b781bc/content
Notes on animal types: Chickens includes broilers and egg-laying hens for breeding & egg production. Other poultry types include ducks, geese, and “other birds.” Cattle include beef and dairy cattle. See, FAO (June 2001) Food Balance Sheets: A handbook, Annex II, Concepts, Definitions and Classification, Livestock Statistics II(3). https://www.fao.org/4/x9892e/X9892e06.htm#TopOfPage
The FAO acknowledges that because of the diversity of livestock systems around the world and the data collection systems that vary by country, statistics should be viewed broadly. [See generally, FAO (June 2018) Guidelines on methods for estimating livestock production and productivity, pp. 1-3]