Biomass is the aggregated weight of living organisms, grouped according to species or location.[1] Estimates of biomass are helpful in assessing trends and impacts in ecological communities.[2,3]
Rafferty, J. P. (n.d.) biomass. In Encyclopaedia Britannica.com. [“Biomass is the weight or total quantity of living organisms of one animal or plant species (species biomass) or of all the species in a community…” Note: this is one usage of the word among many.]
Bar-On, Y. M., et al., (2018). The biomass distribution on Earth. PNAS 115(25)650606511, p. 1. https://www.pnas.org/doi/10.1073/pnas.1711842115 [A quantitative description of the distribution of biomass is essential … for understanding the historical effects and future impacts of human activities.”]
Greenspoon, L., et al., (2023). The global biomass of wild mammals. PNAS, 120(10), e2204892120, p. 1. [“Biomass as a metric allows us to compare species with very different body sizes, and can serve as an indicator of wild mammal presence, trends, and impacts, on a global scale.”]
The comparisons between the biomass of farmed and wild animals offer a stark assessment of the relative importance to society of these groups of animals. The following stats reflect a central development in the earth’s history.
Large portions of the planet’s land and resources have been appropriated for farmed animals and their food production, and the accompanying pollutants from chemical fertilizers, pesticides, and manure have affected large portions of the rest of the earth.
We are not aware of any U.S. calculations of current or historic wild animal biomass, so we focus on the global numbers.[1]
Note: In the U.S., the biomass ratio of farmed mammals to humans is about 1.5 to 1, similar to the global figure in the following question. Broadly estimated, 270M adults at 185 lbs. and 65M kids at 80 lbs. totals ~55B lbs. Back of the envelope calculation for farmed mammals, tallying just pigs, cattle and chickens: 73M pigs * 170 lbs. = 12B lbs. + 88M cattle * 800 lbs. = 70B pounds + 2B chickens * 3 lbs. = 6B lbs. Total = 88B lbs., or about 1.6 times the weight of humans, similar to the following global figure of .56/.37 = 1.51.
Farmed animals now dominate global land mammal biomass (aggregated weight), accounting for ~56% of all land mammals. Humans make up ~37%, wild mammals ~2%, and the remaining 5% is made up of horses, dogs, cats, camels, and other domesticated animals.[1,2]
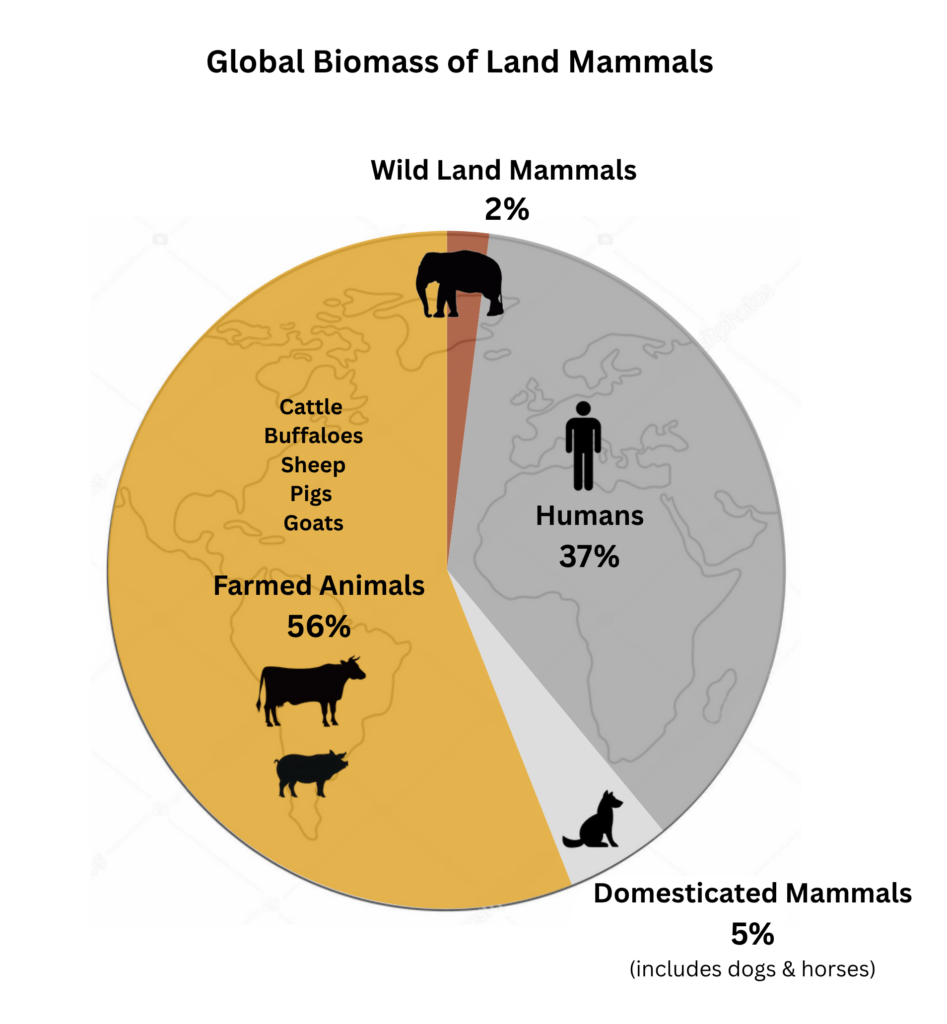
Greenspoon, L., et al. (2023). The global biomass of wild mammals. PNAS, 120(10), e2204892120. [See page 5, Materials and Methods, for most precise estimates. Of 1,065.6 million tons total, 5 species of farmed animals = 592.7 (55.6%), humans = 393.7 (36.9%), wild animals = 22.0 (2.1%) and other domesticated mammals = 57.2 (5.4%)]
Bar-On, Y. M., et al., (2018). The biomass distribution on Earth. PNAS 115(25)650606511, p. 1. [Though we use the figures from the 2023 Greenspoon report, the estimates from this 2018 Bar-on report are very similar. (Bar-On and Milo were also authors of the Greenspoon report.) Calculations for Bar-On: Of 0.17 total GT C for land mammals; 0.102 or 60.0% = livestock; 0.06 or 35.3% = humans; 0.005 or 2.9% = horses, camels; .003 or 1.8% = wild land mammals. Livestock = cattle, buffalo, pigs, sheep, goats.]
Globally, the total weight of farmed mammals raised for food (including cattle, buffaloes, sheep, pigs, and goats) is estimated to be ~25 times greater than the total weight of land mammals in the wild.[1]
![]()
Greenspoon, L., et al., (2023). The global biomass of wild mammals. PNAS, 120(10), e2204892120. [5 species of farmed animals = 592.7 million tons versus wild animals = 22.0 million tons. 592.7/22 = 26.9. These totals are “wet biomass.” We use the ratio of 25:1 here and throughout the site, since this figure better conveys the fact that the report offers very broad estimates.]
Globally, the biomass of farmed birds (chickens, turkeys, ducks, etc.) is ~70% of all bird biomass, while that of wild birds is ~30%.[1]
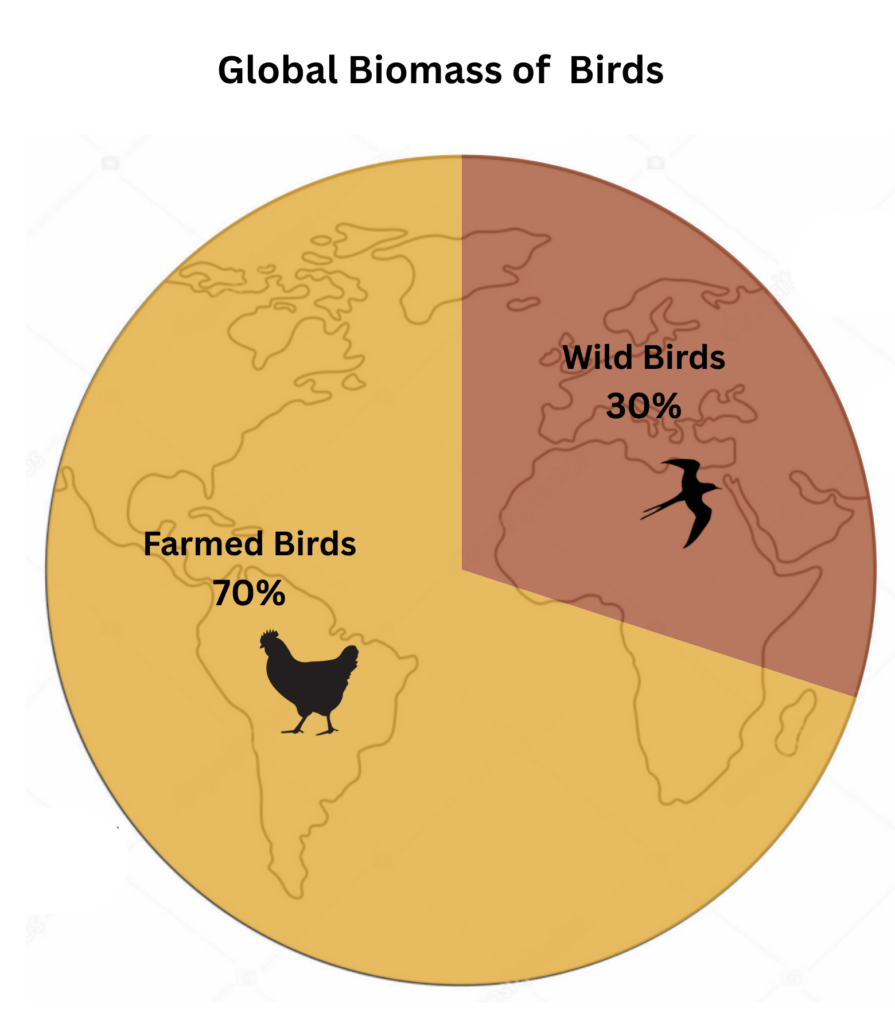
Bar-On, Y. M., et al., (2018). The biomass distribution on Earth. PNAS 115(25)650606511, p. 3. [“This is also true for wild and domesticated birds, for which the biomass of domesticated poultry (~0.005 Gt C, dominated by chickens) is about threefold higher than that of wild birds (~0.002 Gt C; SI Appendix, Table S12).” Calculation: adding .002 + .005 = .007 total birds. Farmed birds = .005/.007 = 71.4%. Since these are broad estimates, we use 70% and 30%.]
Globally, the total weight of birds raised for food (chickens, turkeys, ducks, etc.) is ~2.5 times the total weight of all wild birds.[1]

Bar-On, Y. M., et al., (2018). The biomass distribution on Earth. PNAS 115(25)650606511, p. 3. [“This is also true for wild and domesticated birds, for which the biomass of domesticated poultry (~0.005 Gt C, dominated by chickens) is about threefold higher than that of wild birds (~0.002 Gt C; SI Appendix, Table S12).”]
The biomass of wild land mammals before humans was ~7 times the size of current wild land mammals.[1] This is an approximately 85% loss from pre-human times.
Although pre-human figures are “very difficult to estimate accurately,” the following graph visualizes the current best estimates.[1]

Yinon Bar-On et al., (2018). The biomass distribution on Earth. PNAS 115(25)650606511, p. 3 [“Comparison of current global biomass with prehuman values (which are very difficult to estimate accurately) demonstrates the impact of humans on the biosphere. Human activity contributed to the Quaternary Megafauna Extinction between ~50,000 and ~3,000 y ago, which claimed around half of the large (>40 kg) land mammal species (30). The biomass of wild land mammals before this period of extinction was estimated by Barnosky (30) at ~0.02 Gt C. The present-day biomass of wild land mammals is approximately sevenfold lower, at ~0.003 Gt C.”]